AI PPT Maker
Templates
PPT Bundles
Design Services
Business PPTs
Business Plan
Management
Strategy
Introduction PPT
Roadmap
Self Introduction
Timelines
Process
Marketing
Agenda
Technology
Medical
Startup Business Plan
Cyber Security
Dashboards
SWOT
Proposals
Education
Pitch Deck
Digital Marketing
KPIs
Project Management
Product Management
Artificial Intelligence
Target Market
Communication
Supply Chain
Google Slides
Research Services
 One Pagers
All Categories
-
Home
- Customer Favorites
- Marketing Statistics
Marketing Statistics
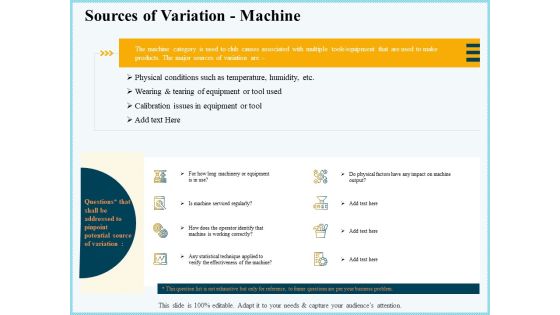
Vicious Circle Effect On Quality Assurance Sources Of Variation Machine Ppt Model Backgrounds PDF
Deliver and pitch your topic in the best possible manner with this vicious circle effect on quality assurance sources of variation machine ppt model backgrounds pdf. Use them to share invaluable insights on machinery or equipment, machine serviced regularly, working correctly, statistical technique app, physical factors and impress your audience. This template can be altered and modified as per your expectations. So, grab it now.
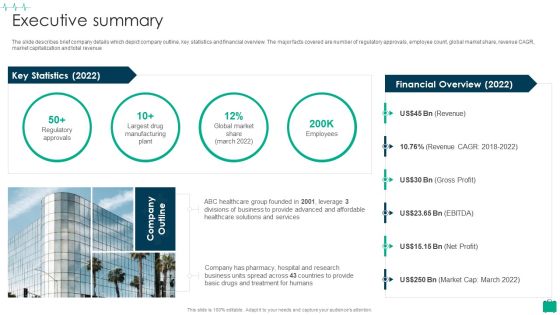
Healthcare Services Company Profile Executive Summary Themes PDF
The slide describes brief company details which depict company outline, key statistics and financial overview. The major facts covered are number of regulatory approvals, employee count, global market share, revenue CAGR, market capitalization and total revenue.This is a Healthcare Services Company Profile Executive Summary Themes PDF template with various stages. Focus and dispense information on one stage using this creative set, that comes with editable features. It contains large content boxes to add your information on topics like Regulatory Approvals, Advanced Affordable, Healthcare Solutions You can also showcase facts, figures, and other relevant content using this PPT layout. Grab it now.

Pharmaceutical And Clinical Research Summary Executive Summary Guidelines PDF
The slide describes brief company details which depict company outline, key statistics and financial overview. The major facts covered are number of regulatory approvals, employee count, global market share, revenue CAGR, market capitalization and total revenue. This is a Pharmaceutical And Clinical Research Summary Executive Summary Guidelines PDF template with various stages. Focus and dispense information on six stages using this creative set, that comes with editable features. It contains large content boxes to add your information on topics like Revenue, Gross Profit, Net Profit. You can also showcase facts, figures, and other relevant content using this PPT layout. Grab it now.
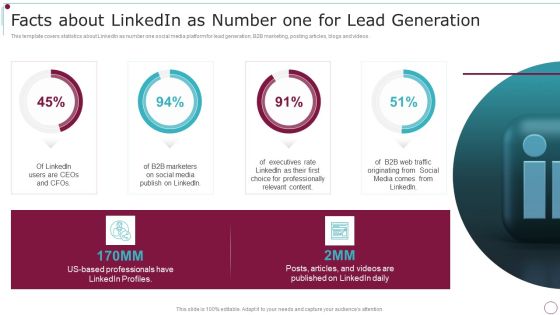
Playbook For Content Advertising Facts About Linkedin As Number One For Lead Generation Sample PDF
This template covers statistics about LinkedIn as number one social media platform for lead generation, B2B marketing, posting articles, blogs and videos. Deliver an awe inspiring pitch with this creative Playbook For Content Advertising Facts About Linkedin As Number One For Lead Generation Sample PDF bundle. Topics like Marketers, Professionally, Social Media can be discussed with this completely editable template. It is available for immediate download depending on the needs and requirements of the user.
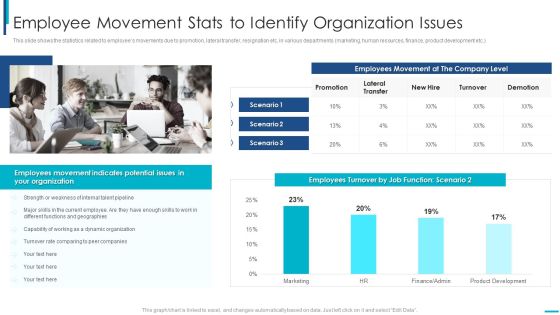
Skill Development Training To Strengthen Employee Performance Employee Movement Stats Professional PDF
This slide shows the statistics related to employees movements due to promotion, lateral transfer, resignation etc, in various departments marketing, human resources, finance, product development etc. Deliver an awe inspiring pitch with this creative skill development training to strengthen employee performance employee movement stats professional pdf bundle. Topics like dynamic organization, capability, geographies, strength, weakness can be discussed with this completely editable template. It is available for immediate download depending on the needs and requirements of the user.

Upskill Training For Employee Performance Improvement Employee Movement Stats To Identify Organization Issues Graphics PDF
This slide shows the statistics related to employees movements due to promotion, lateral transfer, resignation etc, in various departments marketing, human resources, finance, product development etc. Deliver an awe inspiring pitch with this creative upskill training for employee performance improvement employee movement stats to identify organization issues graphics pdf bundle. Topics like dynamic organization, capability, geographies, strength, weakness can be discussed with this completely editable template. It is available for immediate download depending on the needs and requirements of the user.

Social Media Brand Promotion Instructions Playbook Facts About Linkedin As Number Pictures PDF
This template covers statistics about LinkedIn as number one social media platform for lead generation, B2B marketing, posting articles, blogs and videos. Deliver an awe inspiring pitch with this creative Social Media Brand Promotion Instructions Playbook Facts About Linkedin As Number Pictures PDF bundle. Topics like Professionally Relevant, Traffic Originating, Executives Rate can be discussed with this completely editable template. It is available for immediate download depending on the needs and requirements of the user.

Linkedin Promotional Strategies For Organizational Growth Our Linkedin Company Page Optimize Your Linkedin Summary PDF
Below slide strives throw light on key activities to be focused for optimizing LinkedIn Company Page. It covers Content suggestions, page statistics and administration tools for content optimization.Deliver an awe inspiring pitch with this creative Linkedin Promotional Strategies For Organizational Growth Our Linkedin Company Page Optimize Your Linkedin Summary PDF bundle. Topics like Advertising, Marketing, Technology, Information, Recruitment can be discussed with this completely editable template. It is available for immediate download depending on the needs and requirements of the user.

Online Promotion Playbook Facts About Linkedin As Number One For Lead Generation Pictures PDF
This template covers statistics about LinkedIn as number one social media platform for lead generation, B2B marketing, posting articles, blogs and videos. Deliver an awe inspiring pitch with this creative online promotion playbook facts about linkedin as number one for lead generation pictures pdf bundle. Topics like facts about linkedin as number one for lead generation can be discussed with this completely editable template. It is available for immediate download depending on the needs and requirements of the user.
Globe With Bars And Business Icons Powerpoint Templates
Bar graph with globe for statistical analysis has been displayed in this business slide. This business diagram helps to exhibit global statistical analysis and research. Use this diagram to build an exclusive presentation.

Smartphone Application User Acquisition Techniques Overview Of User Acquisition Through Paid Advertising Formats PDF
Following slide exhibits overview of paid advertising for effective user acquisition. It further provide description and key statistics associated with investment. lead generation, brand awareness etc. Are you searching for a Smartphone Application User Acquisition Techniques Overview Of User Acquisition Through Paid Advertising Formats PDF that is uncluttered, straightforward, and original Its easy to edit, and you can change the colors to suit your personal or business branding. For a presentation that expresses how much effort you have put in, this template is ideal With all of its features, including tables, diagrams, statistics, and lists, its perfect for a business plan presentation. Make your ideas more appealing with these professional slides. Download Smartphone Application User Acquisition Techniques Overview Of User Acquisition Through Paid Advertising Formats PDF from Slidegeeks today.

Brand Value By Sector And Economy Guide To Understand Evaluate Mockup PDF
Purpose of this slide is to address the global brand value statistics in 2022. Statistics presented in the slide are by sector and economy. It also shows that technology sector has the highest brand value.Here you can discover an assortment of the finest PowerPoint and Google Slides templates. With these templates, you can create presentations for a variety of purposes while simultaneously providing your audience with an eye catching visual experience. Download Brand Value By Sector And Economy Guide To Understand Evaluate Mockup PDF to deliver an impeccable presentation. These templates will make your job of preparing presentations much quicker, yet still, maintain a high level of quality. Slidegeeks has experienced researchers who prepare these templates and write high quality content for you. Later on, you can personalize the content by editing the Brand Value By Sector And Economy Guide To Understand Evaluate Mockup PDF.
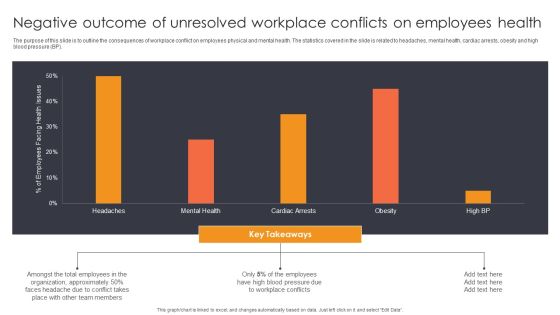
Negative Outcome Of Unresolved Workplace Conflicts On Employees Health Ppt Show Sample PDF
The purpose of this slide is to outline the consequences of workplace conflict on employees physical and mental health. The statistics covered in the slide is related to headaches, mental health, cardiac arrests, obesity and high blood pressure BP. Are you searching for a Negative Outcome Of Unresolved Workplace Conflicts On Employees Health Ppt Show Sample PDF that is uncluttered, straightforward, and original Its easy to edit, and you can change the colors to suit your personal or business branding. For a presentation that expresses how much effort you have put in, this template is ideal. With all of its features, including tables, diagrams, statistics, and lists, its perfect for a business plan presentation. Make your ideas more appealing with these professional slides. Download Negative Outcome Of Unresolved Workplace Conflicts On Employees Health Ppt Show Sample PDF from Slidegeeks today.
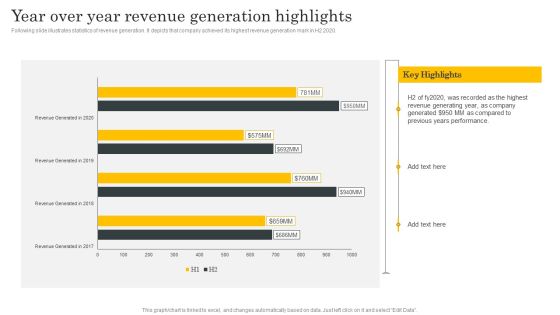
Financial Evaluation Report Year Over Year Revenue Generation Highlights Designs PDF
Following slide illustrates statistics of revenue generation. It depicts that company achieved its highest revenue generation mark in H2 2020. Are you searching for a Financial Evaluation Report Year Over Year Revenue Generation Highlights Designs PDF that is uncluttered, straightforward, and original Its easy to edit, and you can change the colors to suit your personal or business branding. For a presentation that expresses how much effort youve put in, this template is ideal With all of its features, including tables, diagrams, statistics, and lists, its perfect for a business plan presentation. Make your ideas more appealing with these professional slides. Download Financial Evaluation Report Year Over Year Revenue Generation Highlights Designs PDF from Slidegeeks today.

Influencer Advertising Toolkit How Do Influencers Want To Be Compensated Formats PDF
Mentioned graph displays the survey results on how influencers want to be compensated while collaborating with businesses. Statistics shows that 69persent of the influencers prefer the monetary compensation.Deliver an awe inspiring pitch with this creative Influencer Advertising Toolkit How Do Influencers Want To Be Compensated Formats PDF bundle. Topics like Affiliate Partnership, Moetary Compensation, Given Preferences can be discussed with this completely editable template. It is available for immediate download depending on the needs and requirements of the user.

Influencer Advertising Toolkit Key Demographics For Social Media Campaign Infographics PDF
Mentioned slide depicts key statistics that an influencer can use to address audience demographics details when running a social media campaign. Deliver and pitch your topic in the best possible manner with this Influencer Advertising Toolkit Key Demographics For Social Media Campaign Infographics PDF. Use them to share invaluable insights on Key Demographics, Social Media, Campaign and impress your audience. This template can be altered and modified as per your expectations. So, grab it now.

About Personal Branding Definition And Interesting Facts Microsoft PDF
Purpose of this slide is to address the importance of personal branding. Information covered in the slide are the statistics related to personal brand and its benefits to a person or company. There are so many reasons you need a About Personal Branding Definition And Interesting Facts Microsoft PDF. The first reason is you can not spend time making everything from scratch, Thus, Slidegeeks has made presentation templates for you too. You can easily download these templates from our website easily.

Successful Brand Development Plan Website Traffic Comparison Guidelines PDF
This slide portrays comparison statistics of firms website traffic along with its competitor. It includes details of website rank at global level as well as country level.Deliver an awe inspiring pitch with this creative successful brand development plan website traffic comparison guidelines pdf bundle. Topics like website traffic comparison can be discussed with this completely editable template. It is available for immediate download depending on the needs and requirements of the user.

Sales Performance Highlight In Fy22 Brand Techniques Structure Designs PDF
This slide illustrates sales performance highlight of the company in financial year 2020. It also shows the statistics of units sold across different the regions. Deliver and pitch your topic in the best possible manner with this sales performance highlight in fy22 brand techniques structure designs pdf. Use them to share invaluable insights on sales performance highlight in fy22 and impress your audience. This template can be altered and modified as per your expectations. So, grab it now.

Website Traffic Comparison Brand Techniques Structure Microsoft PDF
This slide portrays comparison statistics of firms website traffic along with its competitor. It includes details of website rank at global level as well as country level. Deliver and pitch your topic in the best possible manner with this website traffic comparison brand techniques structure microsoft pdf. Use them to share invaluable insights on website traffic comparison and impress your audience. This template can be altered and modified as per your expectations. So, grab it now.

Brand Development Manual Sales Performance Highlight In FY22 Microsoft PDF
This slide illustrates sales performance highlight of the company in financial year 2022. It also shows the statistics of units sold across different the regions.Deliver an awe inspiring pitch with this creative Brand Development Manual Sales Performance Highlight In FY22 Microsoft PDF bundle. Topics like Sales Performance Highlight In FY22 can be discussed with this completely editable template. It is available for immediate download depending on the needs and requirements of the user.

Brand Development Manual Website Traffic Comparison Professional PDF
This slide portrays comparison statistics of firms website traffic along with its competitor. It includes details of website rank at global level as well as country level.Deliver an awe inspiring pitch with this creative Brand Development Manual Website Traffic Comparison Professional PDF bundle. Topics like Website Traffic Comparison can be discussed with this completely editable template. It is available for immediate download depending on the needs and requirements of the user.

Establishing Successful Brand Strategy To Captivate Consumers Sales Performance Highlight In FY20 Rules PDF
This slide illustrates sales performance highlight of the company in financial year 2020. It also shows the statistics of units sold across different the regions. Deliver and pitch your topic in the best possible manner with this establishing successful brand strategy to captivate consumers sales performance highlight in fy20 rules pdf. Use them to share invaluable insights on sales performance highlight in fy20 and impress your audience. This template can be altered and modified as per your expectations. So, grab it now.

Establishing Successful Brand Strategy To Captivate Consumers Website Traffic Comparison Download PDF
This slide portrays comparison statistics of firms website traffic along with its competitor. It includes details of website rank at global level as well as country level. Deliver and pitch your topic in the best possible manner with this establishing successful brand strategy to captivate consumers website traffic comparison download pdf. Use them to share invaluable insights on website traffic comparison and impress your audience. This template can be altered and modified as per your expectations. So, grab it now.

Successful Brand Development Plan Sales Performance Highlight In FY20 Download PDF
This slide illustrates sales performance highlight of the company in financial year 2020. It also shows the statistics of units sold across different the regions.Deliver and pitch your topic in the best possible manner with this successful brand development plan sales performance highlight in fy20 download pdf. Use them to share invaluable insights on sales performance highlight in fy20 and impress your audience. This template can be altered and modified as per your expectations. So, grab it now.

Product Kick Off Strategy Measuring Customer Satisfaction Over Time Inspiration PDF
This slide shows dashboard that illustrates informational statistics for the survey questions asked from existing valuable customers. Deliver an awe inspiring pitch with this creative product kick off strategy measuring customer satisfaction over time inspiration pdf bundle. Topics like detractors, passive, promoters, process can be discussed with this completely editable template. It is available for immediate download depending on the needs and requirements of the user.

Bars Displaying Percentage Growth PowerPoint Templates
Our above PPT slide contains bar graph displaying percentage growth. This diagram of bar graph helps to depict statistical information. Use this diagram to impart more clarity to data and to create more sound impact on viewers.

Table Of Contents For Virtual Video Hosting Platform Capital Raising Pitch Deck Summary PDF
Deliver an awe inspiring pitch with this creative table of contents for virtual video hosting platform capital raising pitch deck summary pdf bundle. Topics like online video hosting platform overview, addressing purpose defining brand and culture, key statistics associated to video hosting platform can be discussed with this completely editable template. It is available for immediate download depending on the needs and requirements of the user.

Strategy To Enhance Buyer Intimacy Customer Experience Dashboard Ppt Styles Ideas PDF
Mentioned slide provides comprehensive statistics for measuring and evaluating customer experience level with respect to brand persona. It covers customer satisfaction index, rewards member index etc. Deliver an awe inspiring pitch with this creative strategy to enhance buyer intimacy customer experience dashboard ppt styles ideas pdf bundle. Topics like customer experience dashboard can be discussed with this completely editable template. It is available for immediate download depending on the needs and requirements of the user.

Customer Rapport Strategy To Build Loyal Client Base Customer Experience Dashboard Designs PDF
Mentioned slide provides comprehensive statistics for measuring and evaluating customer experience level with respect to brand persona. It covers customer satisfaction index, rewards member index etc. Deliver an awe inspiring pitch with this creative customer rapport strategy to build loyal client base customer experience dashboard designs pdf bundle. Topics like customer duration, rewards member, customer satisfaction can be discussed with this completely editable template. It is available for immediate download depending on the needs and requirements of the user.
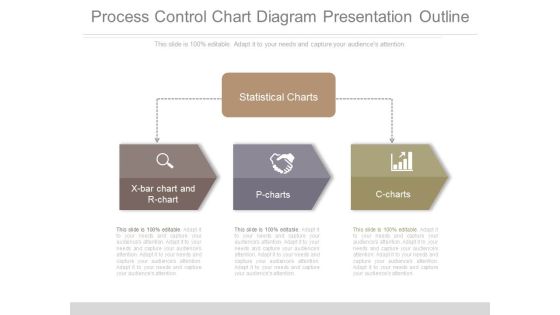
Process Control Chart Diagram Presentation Outline
This is a process control chart diagram presentation outline. This is a three stage process. The stages in this process are statistical charts, x bar chart and r chart, p charts, c charts.
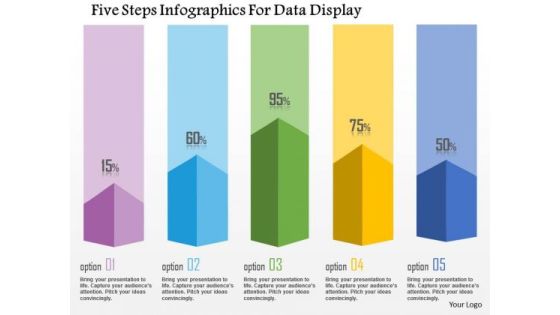
Business Diagram Five Steps Infographics For Data Display Presentation Template
This business diagram has been designed with graphic of five staged info graphics. This diagram can be used to display statistical information. Use this bar graph for your business and sales related presentations.

Information Science Tools For Data Science Sas Ppt PowerPoint Presentation Infographics Graphic Images PDF
This slide describes the Statistical Analysis System used in data science for data management and modeling. It includes robust data, SAS studio, various data types support, and data encryption.This is a Information Science Tools For Data Science Sas Ppt PowerPoint Presentation Infographics Graphic Images PDF template with various stages. Focus and dispense information on one stage using this creative set, that comes with editable features. It contains large content boxes to add your information on topics like Proprietary Software, Statistical Modeling, Data Scientists. You can also showcase facts, figures, and other relevant content using this PPT layout. Grab it now.

Multi Stage Quantitative Data Analysis Collection And Analysis Process Rules PDF
This slide provides a multi stage process outlining techniques and tools needed for executing an successful quantitative analysis. It covers stages such as data collection methods, research questions or hypothesis created, software, statistical tools, output and interpretations. Persuade your audience using this Multi Stage Quantitative Data Analysis Collection And Analysis Process Rules PDF. This PPT design covers five stages, thus making it a great tool to use. It also caters to a variety of topics including Data Collection Methods, Software, Statistical Tools, Output And Interpretations. Download this PPT design now to present a convincing pitch that not only emphasizes the topic but also showcases your presentation skills.
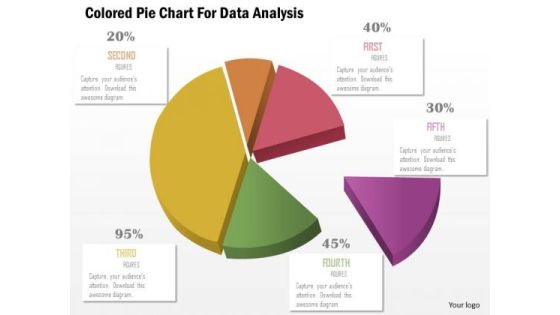
Business Diagram Colored Pie Chart For Data Analysis Presentation Template
This business slide displays pie chart. This diagram is a data visualization tool that gives you a simple way to present statistical information. This slide helps your audience examine and interpret the data you present.
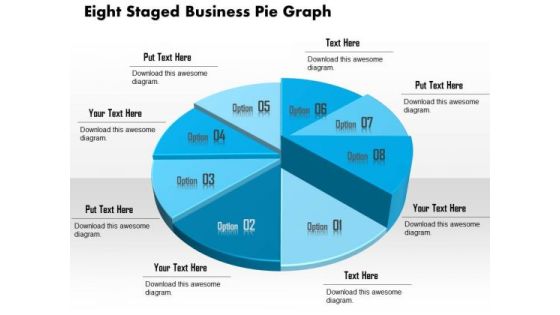
Business Diagram Eight Staged Business Pie Graph Presentation Template
This business slide displays eight staged pie chart. This diagram is a data visualization tool that gives you a simple way to present statistical information. This slide helps your audience examine and interpret the data you present.
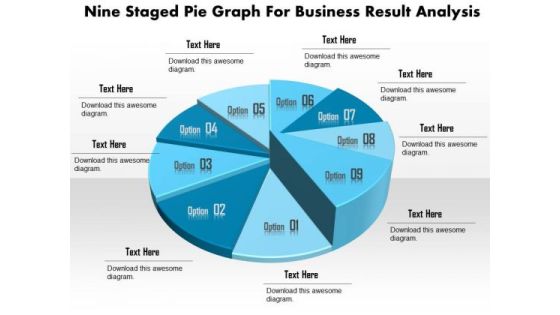
Business Diagram Nine Staged Pie Graph For Business Result Analysis Presentation Template
This business slide displays nine staged pie chart. This diagram is a data visualization tool that gives you a simple way to present statistical information. This slide helps your audience examine and interpret the data you present.

Business Diagram Seven Staged Pie Graph For Business Analysis Presentation Template
This business slide displays seven staged pie chart. This diagram is a data visualization tool that gives you a simple way to present statistical information. This slide helps your audience examine and interpret the data you present.

Business Diagram Six Staged 3d Pie Graph For Result Analysis Presentation Template
This business slide displays six staged pie chart. This diagram is a data visualization tool that gives you a simple way to present statistical information. This slide helps your audience examine and interpret the data you present.

Applied Enterprise Architecture Sample Diagram Ppt
This is a applied enterprise architecture sample diagram ppt. This is a eight stage process. The stages in this process are optimization, predictive modeling, forecasting and extrapolation, statistical analysis, alerts, dashboards query/drill down, ad-hoc reporting, standard reports.

Professional Services Support Diagram Presentation Visual Aids
This is a professional services support diagram presentation visual aids. This is a five stage process. The stages in this process are statistical models, gather data, enrollment, capacity, boundaries.

Business Diagram Four Staged Triangular Design For Text Display Presentation Template
Four staged triangular design text boxes are used to design this business diagram. This slide can be used to present statistical information in innovative manner Download this slide to earn good impressions from the audience.
Seven Staged Business Cubes And Icons Powerpoint Template
This PowerPoint template has been designed with graphics of seven cubes and business icons. Download this PPT slide for business and financial analysis. You may also use this professional template to depict statistical analysis.

Control Quality Management Template Powerpoint Guide
This is a control quality management template powerpoint guide. This is a four stage process. The stages in this process are methods for managing quality control, statistical sampling, quality tools flowcharts scatter diagram histograms, inspection, approved change requests review.

Managing Project Quality Diagram Powerpoint Slide Backgrounds
This is a managing project quality diagram powerpoint slide backgrounds. This is a four stage process. The stages in this process are statistical sampling, quality tools , methods for managing quality control, inspection, approved change request review.
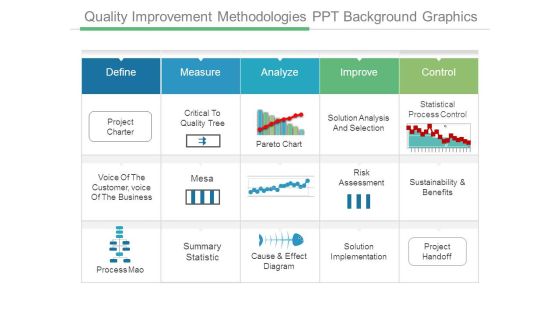
Quality Improvement Methodologies Ppt Background Graphics
This is a quality improvement methodologies ppt background graphics. This is a five stage process. The stages in this process are define, measure, analyze, improve, control, project charter, critical to quality tree, pareto chart, solution analysis and selection, statistical process control, voice of the customer, voice of the business, mesa, risk assessment, sustainability and benefits, process mao, summary statistic, cause and effect diagram, solution implementation, project handoff.

Continuous Improvement Cycle Powerpoint Show
This is a continuous improvement cycle powerpoint show. This is a five stage process. The stages in this process are define, measure, analyze, improve, control, project charter, critical to quality tree, pareto chart, solution analysis and selection, statistical process control, voice of the customer voice of the business, mesa, risk assessment, sustainability and benefits, process mao, summary statistic, cause and effect diagram, solution implementation, project handoff.

Pdca Infographic Template Powerpoint Slide Backgrounds
This is a pdca infographic template powerpoint slide backgrounds. This is a five stage process. The stages in this process are define, measure, analyze, improve, control, project charter, critical to quality tree, pareto chart, solution analysis and selection, statistical process control, voice of the customer voice of the business, mesa, risk assessment, sustainability and benefits, process mao, summary statistic, cause and effect diagram, solution implementation, project handoff.
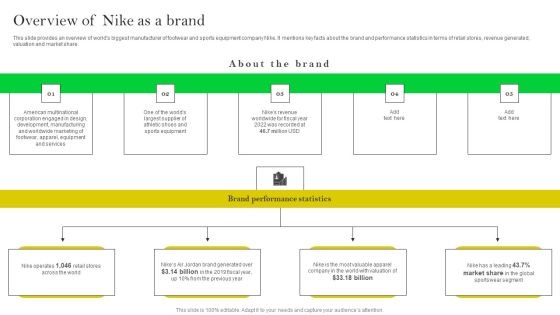
How Nike Developed And Executed Strategic Promotion Techniques Overview Of Nike As A Brand Structure PDF
This slide provides an overview of worlds biggest manufacturer of footwear and sports equipment company Nike. It mentions key facts about the brand and performance statistics in terms of retail stores, revenue generated, valuation and market share. If your project calls for a presentation, then Slidegeeks is your go to partner because we have professionally designed, easy to edit templates that are perfect for any presentation. After downloading, you can easily edit How Nike Developed And Executed Strategic Promotion Techniques Overview Of Nike As A Brand Structure PDF and make the changes accordingly. You can rearrange slides or fill them with different images. Check out all the handy templates.

Private Video Streaming Platform Capital Fundraising Pitch Deck Online Video Hosting Platform Summary PDF
This slide caters details about video hosting platform, in terms of technology utilized, headquarters, mission statement, estimated rise in viewers in US and online video platform market share in US. Deliver and pitch your topic in the best possible manner with this private video streaming platform capital fundraising pitch deck key statistics associated to video mockup pdf. Use them to share invaluable insights on private video streaming platform capital fundraising pitch deck various metrics determining download pdf and impress your audience. This template can be altered and modified as per your expectations. So, grab it now.

Overview Of Search Engine Optimization Training Deck On SEO Training Ppt
Presenting training deck on Overview of Search Engine Optimization. This deck comprises of 79 slides. The topics covered are the meaning, importance, statistics related to SEO, and the difference between traditional and modern SEO. It also includes the working and market share of search engines, the difference between organic and paid search, SEO career path, certifications, and key takeaways. This PPT presentation is thoroughly researched by the experts, and every slide consists of appropriate content. Each slide is well crafted and designed by our PowerPoint experts. All slides are customizable.

Data Management Example Of Ppt Presentation
This is a data management example of ppt presentation. This is a three stage process. The stages in this process are statistical modelling, data management, exploration and description.

Six Sigma Circular Flowchart Ppt Images
This is a six sigma circular flowchart ppt images. This is a five stage process. The stages in this process are recognize, realize, define, control, improve, analyze, measure, voice customer and voice of process, practical problem, statistical problem, statistical solution, practical solution, control plan, result.

Six Sigma Circular Chart With Down Arrows Powerpoint Slide Images
This is a six sigma circular chart with down arrows powerpoint slide images. This is a five stage process. The stages in this process are recognize, realize, measure, define, analyze, improve, control, voice of customer and voice of process, practical problem, statistical problem, statistical solution, practical solution, control plan, result.

The Improvement Pdca Cycle Ppt PowerPoint Presentation Layout
This is a the improvement pdca cycle ppt powerpoint presentation layout. This is a five stage process. The stages in this process are project charter, critical to quality tree, pareto chart, solution analysis and selection, statistical process control, mesa, risk assessment, sustainability and benefits, summary statistic, cause and effect diagram, solution implementation, project handoff.

Global Growth Data Analysis Bar Graph Ppt Powerpoint Presentation Infographic Template Outfit
This is a global growth data analysis bar graph ppt powerpoint presentation infographic template outfit. The topics discussed in this diagram are market growth, market opportunity, market profitability. This is a completely editable PowerPoint presentation, and is available for immediate download.

Key Duties Of Business Data Analyst Ppt PowerPoint Presentation Gallery Rules PDF
Presenting key duties of business data analyst ppt powerpoint presentation gallery rules pdf to dispense important information. This template comprises one stages. It also presents valuable insights into the topics including analyzing data using statistical techniques, identifying trends in data sets, provide actionable insights for growth to management, mention function. This is a completely customizable PowerPoint theme that can be put to use immediately. So, download it and address the topic impactfully.

Demand Forecasting Techniques Ppt Slide
This is a demand forecasting techniques ppt slide. This is a four stage process. The stages in this process are methods of demand forecasting, opinion polling method, statistical method, expert opinion method, sales force opinion survey method, consumers survey methods, trend projection, barometric techniques, economic techniques, complete, enumeration survey method, sample survey method, end use survey method, regression method, simultaneous equation method.

Procedure Of Time Series Analysis Diagram Powerpoint Slide Clipart
This is a procedure of time series analysis diagram powerpoint slide clipart. This is a eight stage process. The stages in this process are data acquisition, preprocessing, correlation and spectral analysis, build the arima model, make predictions, modeling and prediction, statistical analysis, visualize the time series.

Best Practices For Quality Management Ppt Powerpoint Design
This is a best practices for quality management ppt powerpoint design. This is a nine stage process. The stages in this process are tools for managing quality, cost benefits analysis, cost of quality, basic quality tools, benchmarking, design of experiments, statistical sampling, additional quality planning tools, meetings.
