AI PPT Maker
Templates
PPT Bundles
Design Services
Business PPTs
Business Plan
Management
Strategy
Introduction PPT
Roadmap
Self Introduction
Timelines
Process
Marketing
Agenda
Technology
Medical
Startup Business Plan
Cyber Security
Dashboards
SWOT
Proposals
Education
Pitch Deck
Digital Marketing
KPIs
Project Management
Product Management
Artificial Intelligence
Target Market
Communication
Supply Chain
Google Slides
Research Services
 One Pagers
All Categories
-
Home
- Customer Favorites
- Marketing Resources
Marketing Resources

Stock Photo Dollars Covered With Lock And Chain PowerPoint Slide
This Power Point image template has been designed with graphic of dollar and chain. In this image dollar is covered with chain which shows the concept of safety. Use this image template financial security related presentations.
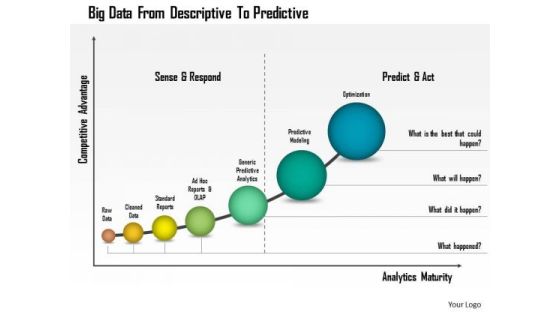
Business Diagram Big Data From Descriptive To Predictive Presentation Template
This business diagram has been designed with graphic of linear bar graph. This growing bar graph depicts the concept of big data analysis. Use this professional diagram for your financial and business analysis.
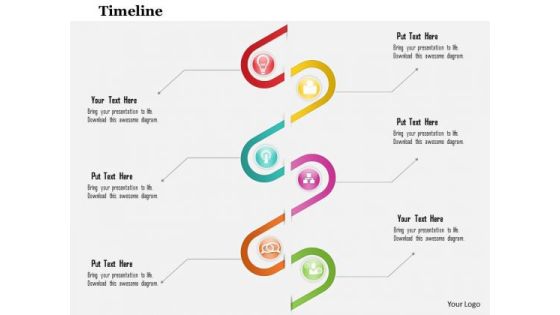
Business Diagram Six Staged Spiral Diagram For Data Flow Presentation Template
This business slide depicts six staged spiral diagram. This diagram provides an effective way of displaying information you can edit text, color, shade and style as per you need. Present your views using this innovative slide and be assured of leaving a lasting impression.
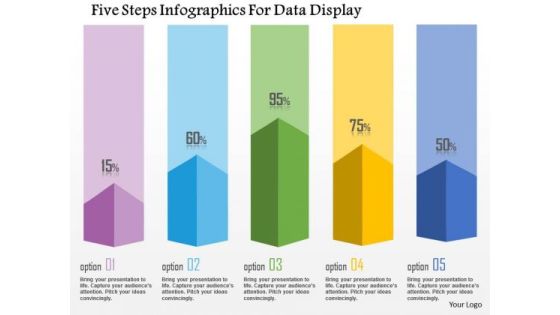
Business Diagram Five Steps Infographics For Data Display Presentation Template
This business diagram has been designed with graphic of five staged info graphics. This diagram can be used to display statistical information. Use this bar graph for your business and sales related presentations.
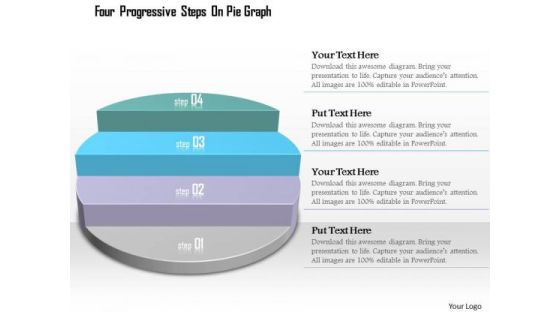
Business Diagram Four Progressive Steps On Pie Graph Presentation Template
This diagram displays progressive steps on pie chart. It contains graphic of pie graph with four steps. Use this diagram, in your presentations to express views on process, steps, stages, progress, targets, goals, success and achievements. Give professional appearance to your presentations using this business slide.

Business Diagram Compass With Multiple Business Plan Presentation Template
This power point template has been designed with graphic of compass. This PPT contains the concept of making business plans. Use this PPT for business and management related presentations.
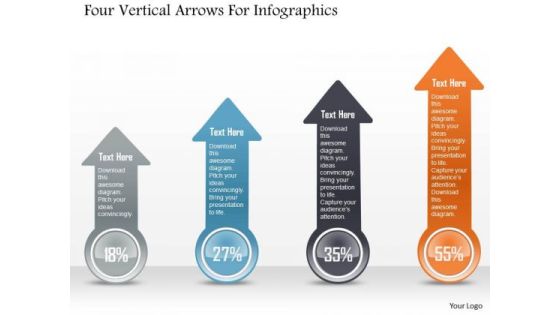
Business Diagram Four Vertical Arrows For Infographics PowerPoint Template
Four vertical arrows are used to craft this power point template. This PPT slide contains the concept of information representation. Display your information in any presentation with this professional PPT slide.
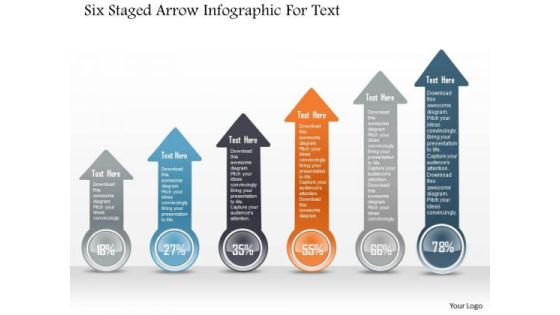
Business Diagram Six Staged Arrow Infographic For Text PowerPoint Template
Six staged colored arrow info graphics diagram has been used to craft this power point template. This PPT contains the concept of business process flow and information representation. Display any process flow in your presentation with this professional PPT slide.
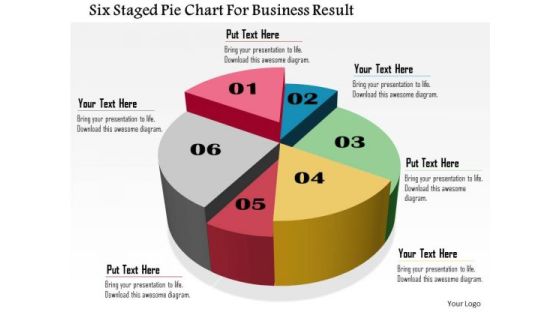
Business Daigram Six Staged Pie Chart For Business Result Presentation Templets
Six staged pie chart is used to design this business slide. Download this diagram to make business and financial reports. Use our above diagram to express information in a visual way.

Business Diagram Pencils For 4 Financial Statements Presentation Template
Emphatically define your message with this slide which contains a graphic of pencils. Above image may be used to display four financial statements. Use this slide to build exclusive presentations for your viewers.
Business Diagram Pie Chart With Icons For Financial Analysis Presentation Template
This professional business diagram slide has been designed with pie chart and icons. It contains concept of financial analysis. Use this slide to build exclusive presentations for your viewers.
Business Diagram Steps With Icons For Success Presentation Template
This business slide displays icons on stairs. Use this diagram slide, in your presentations to depict growth and progress steps. Make your presentations outshine using this professional slide.
Business Diagram Options For Corporate Financial Management Presentation Template
This diagram contains list of four options. Download this diagram slide to display corporate financial management. This diagram provides an effective way of displaying information you can edit text, color, shade and style as per you need.

Business Diagram Six Options In Pyramid Presentation Template
Sales process can be explained with this pyramid diagram. This diagram contains the graphic of pyramid chart with six options. This diagram provides an effective way of displaying information.

Stock Photo Bar Graph With Growth Arrow PowerPoint Slide
This creative image displays design of Bar Graph with Growth Arrow. This image has been designed to depict business on an Upward Trend. Create an impact with this quality image and make professional presentations.
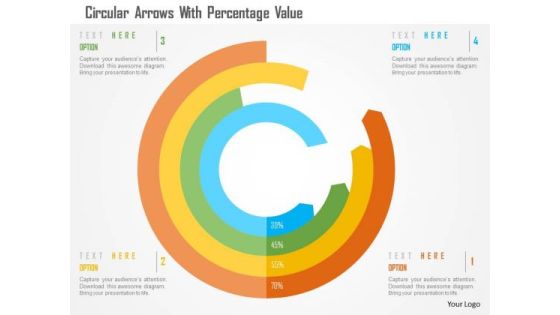
Business Diagram Circular Arrows With Percentage Value Presentation Template
This business slide has been designed with circular arrows. You may download this diagram to display percentage growth data. This template is innovatively designed to highlight your worthy views
Business Diagram Cloud Icon For Data Storage Presentation Template
Concept of cloud computing and data storage has been defined in this power point template. This business diagram contains the graphic of clouds. Use this diagram for business and technology related presentations.

Business Diagram Folders For Financial Review Presentation Template
This business diagram has been designed with graphics of colored folders. You may download this slide for financial review. Use this slide to create an impact on your viewers.
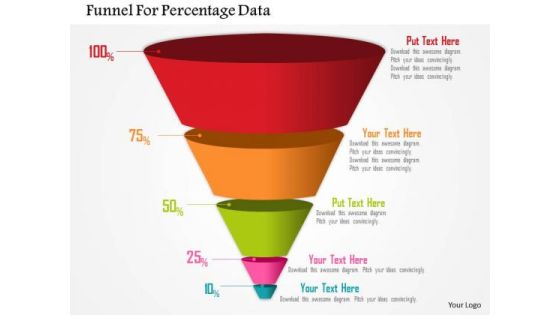
Business Diagram Funnel For Percentage Data Presentation Template
Four staged funnel diagram has been used to design this power point template. This diagram contains the concept of filtration. Present your views and ideas with this impressive image.
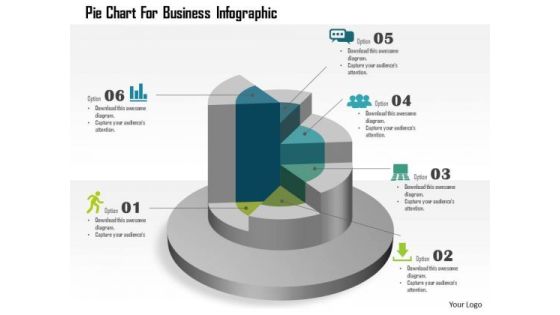
Business Diagram Pie Chart For Business Infographic Presentation Template
This template displays pie chart business infographic. You may download this business slide for result analysis. Amplify your thoughts via this appropriate business template.
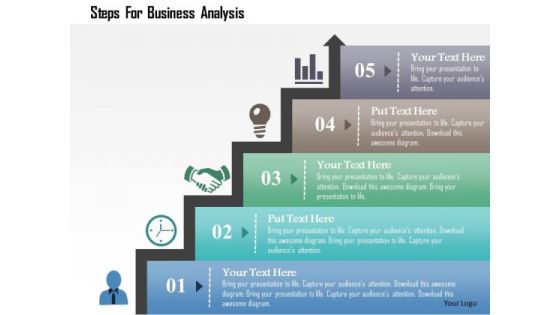
Business Diagram Steps For Business Analysis Presentation Template
Concept of time management has been defined in this power point template diagram. This diagram contains the graphic of bar graph. Amplify your thoughts via this appropriate business template.

Business Diagram Pencil Graph For Statistics Presentation Template
The above template contains graphics of pencil graph. This diagram may be used to display statistical information. This diagram slide will
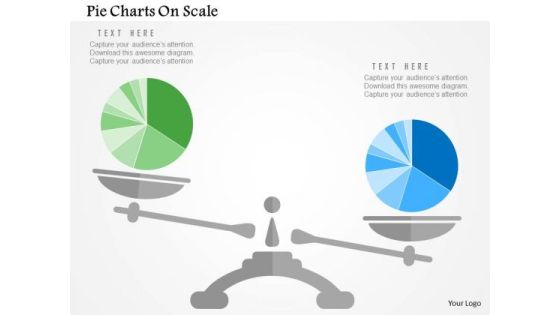
Business Diagram Pie Charts On Scale Presentation Template
Our above slide display graphics of pie chart on a scale. Download this diagram slide to display competitive analysis of business. Adjust the above diagram in your business presentations to visually support your content.

Business Diagram Bar Graph For Growth And Progress Presentation Template
This business slide has been designed with graphics of bar chart. You may download this diagram to display concepts like growth, progress and success in business. Download this diagram slide to make impressive presentations.

Business Diagram Bars For Profit Percentages Presentation Template
Download this exclusive business diagram to present profit in percentage ratio. This slide contains the graphic of bars. This diagram can be useful for business presentations.
Business Diagram Icons Around Pie Chart Presentation Template
Strategy and planning can be displayed with this business diagram. This slide contains the graphic of icons around pie chart Use this editable slide to build quality presentation for your viewers.
Circles With Icons For Communication PowerPoint Template
The above template displays a diagram of circles with icons. This diagram has been professionally designed to emphasize on concept of competitive strategy. Grab centre stage with this slide. Capture the attention of your audience.
Business Diagram Icons And Charts For Business Growth Presentation Template
Our above slide contains graphics of business charts and icons. It helps to display business reports and analysis. Use this diagram to impart more clarity to data and to create more sound impact on viewers.

Business Diagram Matrix Chart For Financial Review Presentation Template
Our above business diagram has been designed with graphics of matrix chart. This slide is suitable to present financial review. Use this business diagram to present your work in a more smart and precise manner.
Icons For Cloud Computing PowerPoint Template
Develop competitive advantage with our above template which contains a diagram of cloud network. This diagram may used to depict concepts like cloud computing and technology. This slide provides an effective way of displaying information.
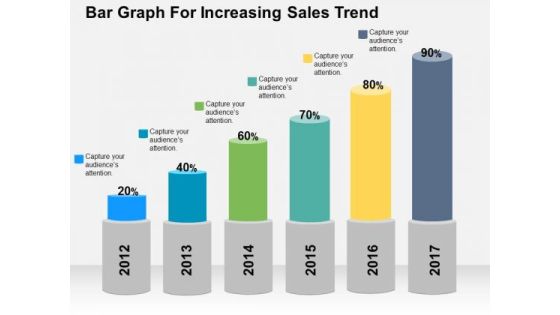
Bar Graph For Increasing Sales Trend PowerPoint Template
Deliver amazing presentations with our above template showing bar graph with percentage values. You may download this slide to depict increase in sales trends. Capture the attention of your audience using this diagram.
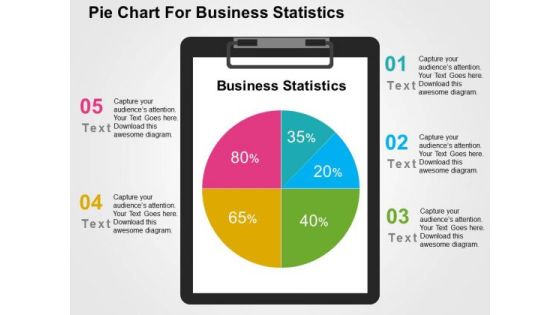
Pie Chart For Business Statistics PowerPoint Template
Visually support your presentation with our above template showing pie chart. This slide has been professionally designed to present business statistics. This template offers an excellent background to build impressive presentation.
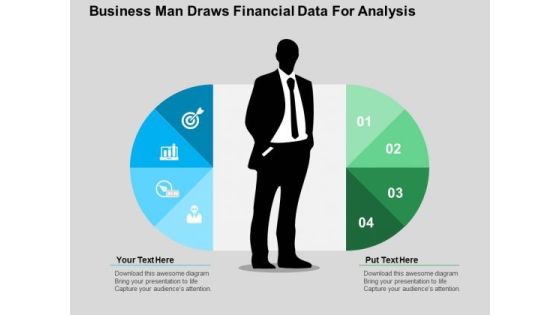
Business Man Draws Financial Data For Analysis PowerPoint Templates
This PowerPoint slide has a theme for financial data analysis. This image has been designed to display concept of financial planning and analysis. Deliver amazing presentations to mesmerize your audience using this image
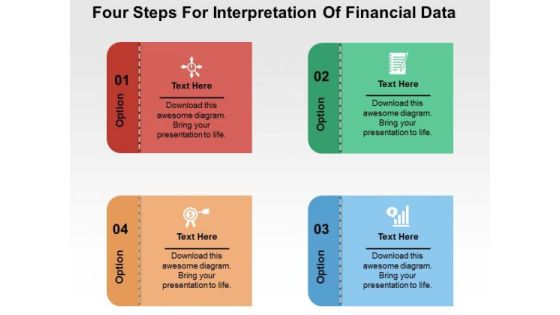
Four Steps For Interpretation Of Financial Data PowerPoint Templates
Our PPT above slide displays graphics of four text boxes with icons. This template may be used to depict interpretation of financial data. You can present your opinions using this impressive slide.

Scorecard For Companys Performance And Financial Condition PowerPoint Templates
Use this PPT slide to display companies performance financial planning. This slide contains graphics of circular scorecard. Trigger the imagination of your audience with this professional diagram.

Bars Displaying Percentage Growth PowerPoint Templates
Our above PPT slide contains bar graph displaying percentage growth. This diagram of bar graph helps to depict statistical information. Use this diagram to impart more clarity to data and to create more sound impact on viewers.
Boxes For Four Basic Financial Statements PowerPoint Templates
This business slide contains graphics of four text boxes. This diagram is suitable to present four basic financial statements. Visual effect of this diagram helps in maintaining the flow of the discussion and provides more clarity to the subject.

Graph Showing Economy Crash PowerPoint Templates
This business slide contains design of graph. This diagram is suitable to present downfall and economy crash. Visual effect of this diagram helps in maintaining the flow of the discussion and provides more clarity to the subject.

Illustration Of Dollar Growth Graph PowerPoint Template
This business slide contains graphics of dollar symbols on graph. This diagram helps to portray concept of financial planning. Present your views using this innovative slide and be assured of leaving a lasting impression.

Infographic For Mission Vision And Values PowerPoint Template
This slide contains the infographic diagram. Download this exclusive business diagram to present business mission, vision and values. This diagram can be useful for business presentations.
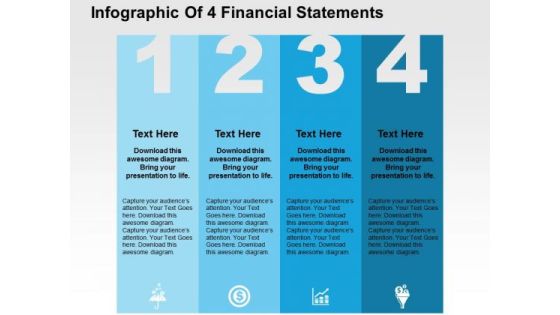
Infographic Of 4 Financial Statements PowerPoint Template
Four financial statements can be displayed in this business diagram. This slide contains the graphic of four text boxes with icons Use this editable slide to build quality presentation for your viewers.
Linear Infographic For Business Management PowerPoint Template
Graphic of tags in linear flow has been used to design this business diagram. This diagram slide may be used to depict business steps in linear flow. Download this diagram for business research and analysis.
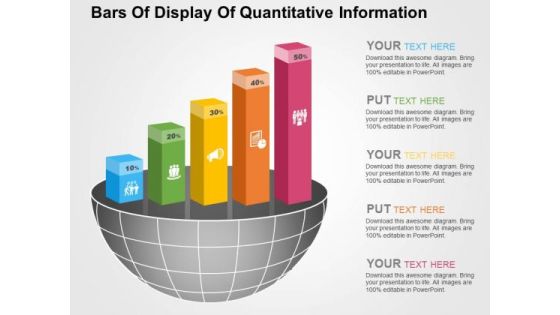
Bars Of Display Of Quantitative Information PowerPoint Templates
Visually support your presentation with our above template illustrating quantitative information. It contains graphics of bars. Etch your views in the brains of your audience with this diagram slide.
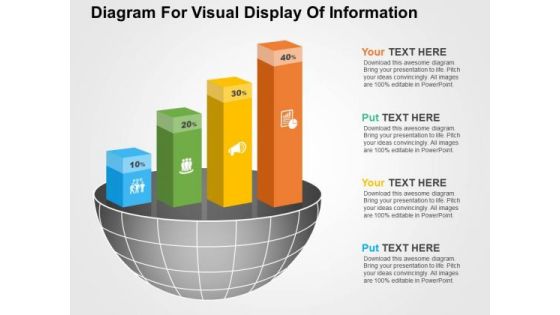
Diagram For Visual Display Of Information PowerPoint Templates
Visually support your presentation with our above template illustrating quantitative information. It contains graphics of bars. Etch your views in the brains of your audience with this diagram slide.

Percentage Data Growth Chart Powerpoint Slides
This PowerPoint template has been designed with percentage data growth chart. Download this PPT chart to depict financial ratio analysis. This PowerPoint slide is of great help in the business sector to make realistic presentations and provides effective way of presenting your newer thoughts.

Understand The Customer Needs Template 2 Ppt PowerPoint Presentation Show Graphics Pictures
This is a understand the customer needs template 2 ppt powerpoint presentation show graphics pictures. This is a five stage process. The stages in this process are understand your customer, what they do, when they buy, how they buy, what they expect of you.

Sample Financial Analysis Report Manufacturing Ppt PowerPoint Presentation Complete Deck With Slides
This is a sample financial analysis report manufacturing ppt powerpoint presentation complete deck with slides. This is a one stage process. The stages in this process are sample, financial, analysis, report, manufacturing.
Portfolio Performance Dashboard Ppt PowerPoint Presentation Icon Designs Download
Presenting this set of slides with name portfolio performance dashboard ppt powerpoint presentation icon designs download. The topics discussed in these slides are assets management, portfolio performance. This is a completely editable PowerPoint presentation and is available for immediate download. Download now and impress your audience.

Increased Online Sales Increased Profitability Ppt Samples
This is a increased online sales increased profitability ppt samples. This is a three stage process. The stages in this process are increased online sales, increased profitability, increase offline sales, increased operating costs, increased employee morale, decrease call center volume, decrease operating costs, no impact.

People Development With Business Strategy Template Presentation Ideas
This is a people development with business strategy template presentation ideas. This is a eight stage process. The stages in this process are compete and grow, improve efficiency and cost, manage business operational risk, execute in line with strategy, business driven flexible, cost effective operations, resilient operations, manageable.

Best Practices For Quality Management Ppt Powerpoint Design
This is a best practices for quality management ppt powerpoint design. This is a nine stage process. The stages in this process are tools for managing quality, cost benefits analysis, cost of quality, basic quality tools, benchmarking, design of experiments, statistical sampling, additional quality planning tools, meetings.

Introduction Stage Of New Product Powerpoint Templates
This is a introduction stage of new product powerpoint templates. This is a five stage process. The stages in this process are sales, low sales, profits, negative profits, competition, little competition, targets, innovators are targeted, cost, high cost per customer acquired.

Conversion Rate Optimization With Process Of Audit Diagram Ppt Slides
This is a conversion rate optimization with process of audit diagram ppt slides. This is a four stage process. The stages in this process are visibility, find more traffic channels, architecture, reduce advertising cost.
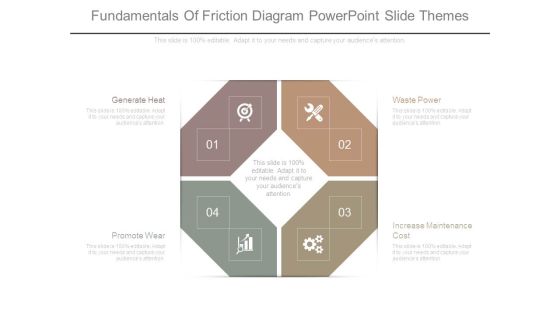
Fundamentals Of Friction Diagram Powerpoint Slide Themes
This is a fundamentals of friction diagram powerpoint slide themes. This is a four stage process. The stages in this process are generate heat, promote wear, increase maintenance cost, waste power.
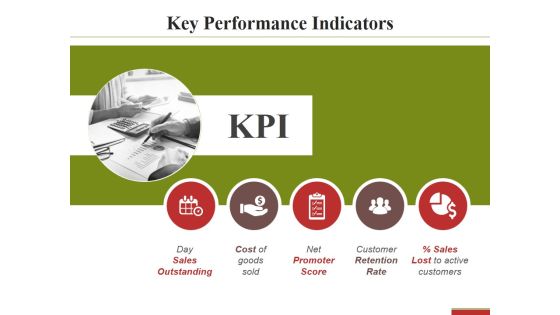
Key Performance Indicators Template 2 Ppt PowerPoint Presentation Pictures Slide
This is a key performance indicators template 2 ppt powerpoint presentation pictures slide. This is a five stage process. The stages in this process are day sales outstanding, cost of goods sold, net promoter score.
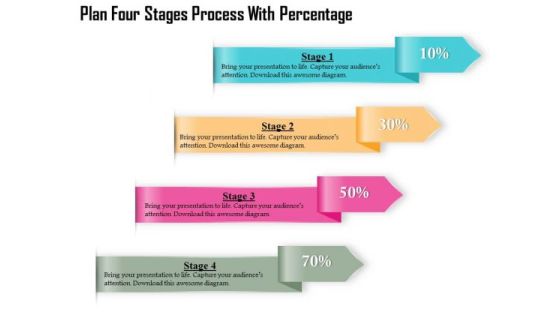
Business Diagram Four Stages Process With Percentage Presentation Template
Four multicolored tags in vertical order has been used to decorate this business diagram. This diagram contains the concept of financial data display with percent values. This diagram can be used for management and finance related presentations.

Business Diagram Three Stages Process Percentage Presentation Template
Three multicolored tags in vertical order has been used to decorate this business diagram. This diagram contains the concept of financial data display with percent values. This diagram can be used for management and finance related presentations.
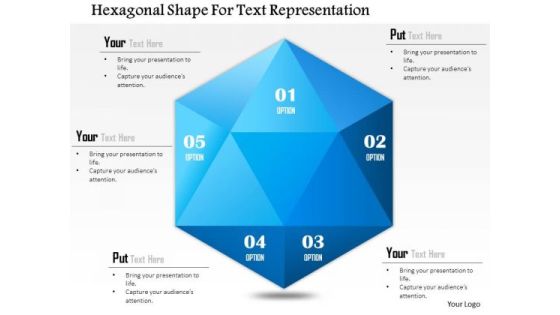
Business Diagram Hexagonal Shape For Text Representation Presentation Template
Graphic of hexagonal shape has been used to design this business diagram. This business slide can be used to represent business information. Use this diagram for your business and finance related presentations.
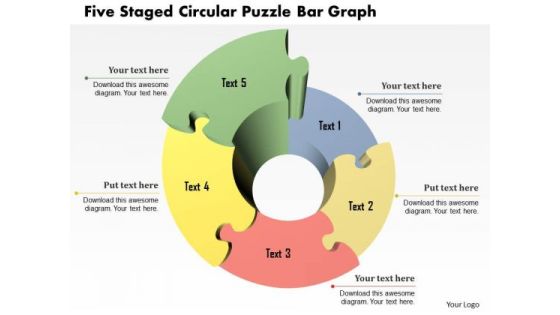
Business Diagram Five Staged Circular Puzzle Bar Graph Presentation Template
Five staged circular puzzle bar graph been used to design this power point template. This PPT contains the concept of business timeline. Show timelines for your business achievements and use this PPT for your business and finance related presentations.
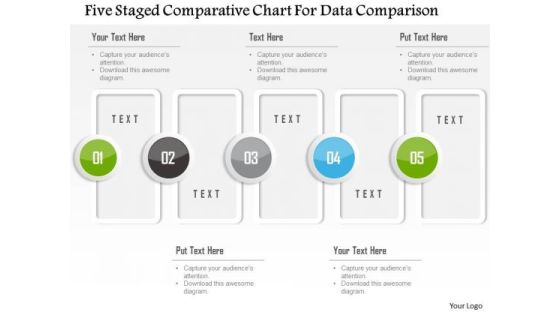
Business Diagram Five Staged Comparative Chart For Data Comparison Presentation Template
Five staged comparative chart has been used to design this power point template. This PPT contains the concept of data comparison. Use this PPT for your business and finance based data comparison in any financial presentation.

Business Diagram Four Staged Linear Timeline Diagram For Business Presentation Template
Four staged linear timeline diagram has been used d to decorate this Power Point template. This PPT contains the concept of process flow. Use this PPT and build quality presentation for business and finance related presentation.
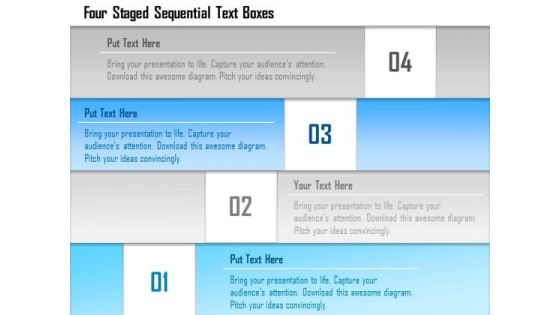
Business Diagram Four Staged Sequential Text Boxes Presentation Template
Four staged sequential stair designed text boxes are used to design this power point template. This PPT contains the concept of data flow. Use this PPT for your business and finance related presentations.
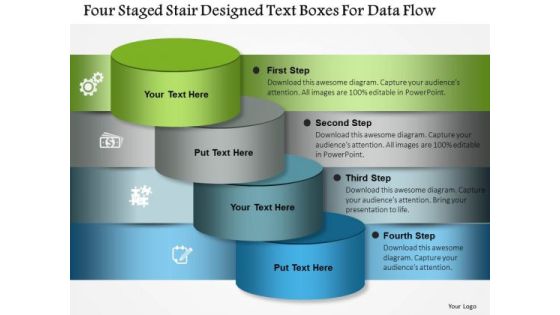
Business Diagram Four Staged Stair Designed Text Boxes For Data Flow Presentation Template
Four staged stair designed text boxes are used to design this power point template. This PPT contains the concept of data flow. Use this PPT for your business and finance related presentations.
Icons On Puzzles For Property Deals PowerPoint Template
Concepts of real estate and finance have been displayed in this business diagram slide. This professional diagram contains diagram of puzzle Infographic. Use this slide to build unique presentations for your viewers.

Infographic For Management Studies PowerPoint Templates
Our above slide has been designed with concentric semi circles. This infographic slide is best to describe concept of managerial finance. You can provide a fantastic explanation of the topic with this slide.

Infographics For Business Management Strategic Planning Powerpoint Template
This Power Point template has been designed with infographic diagram. This PPT diagram may be used for concepts like business management and strategic planning. Use this PPT diagram for business and finance related presentations.
Semi Circle Of Five Business Icons Powerpoint Template
This Power Point template has been crafted designed with semicircle of five business icons. This PPT diagram contains the concept of business strategy and planning process. Use this PPT diagram for business and finance related presentations.
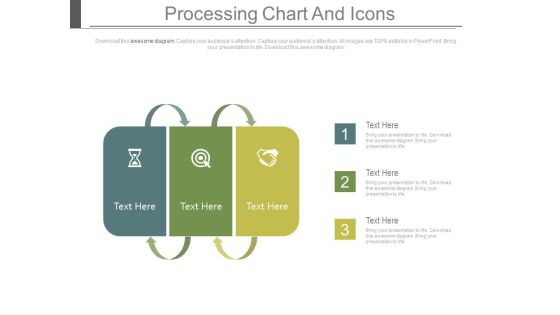
Three Steps Strategic Planning Model Powerpoint Template
This Power Point template has been designed with three steps strategic planning model. This PPT slide portrays the concept of business planning. Use this PPT diagram for business and finance related presentations.

Circles With Dollar Home Message And Target Icons Powerpoint Template
The above PPT template displays four icons of dollar, home, message and target. This diagram is excellent visual tools for explaining concept of home finance. Download this slide to attract the attention of your audience.

Examples Of Scorecards Dashboard Diagram Powerpoint Show
This is a examples of scorecards dashboard diagram powerpoint show. This is a four stage process. The stages in this process are finance, education and growth, customer relationship, process.

Balanced Scorecard Implementation Ppt Slides
This is a balanced scorecard implementation ppt slides. This is a four stage process. The stages in this process are internal business processes, finance, strategy, customers, education and growth.
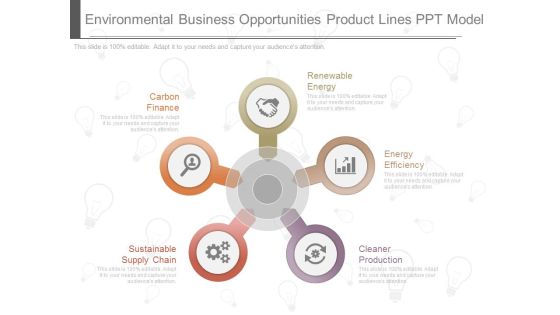
Environmental Business Opportunities Product Lines Ppt Model
This is a environmental business opportunities product lines ppt model. This is a five stage process. The stages in this process are carbon finance, renewable energy, sustainable supply chain, energy efficiency, cleaner production.\n\n\n\n\n\n\n\n\n\n

Customer Distribution Requirement Plan Template Ppt Slide Styles
This is a customer distribution requirement plan template ppt slide styles. This is a five stage process. The stages in this process are operations, executive, services, sales, finance, business one.\n\n\n

Trading System And Order Example Presentation Ideas
This is a trading system and order example presentation ideas. This is a nine stage process. The stages in this process are setting, shipping, tender, purchase, sales, finance, inventory.

Business Processes Of Organization Diagram Example Of Ppt
This is a business processes of organization diagram example of ppt. This is a eight stage process. The stages in this process are hr, inventory, sales, purchase, finance and accounting, crm, engineering production, scm.

Operational Flow Of Financial Services Chart Example Of Ppt
This is a operational flow of financial services chart example of ppt. This is a five stage process. The stages in this process are customer, mobile, atm, employees, high finance trading.

Roadmap For Building Organizational Efficiency Ppt Summary
This is a roadmap for building organizational efficiency ppt summary. This is a three stage process. The stages in this process are priorities, governance, finance, capacity, stockholders, targets, institutions, action plan, scoping, who, how, what.
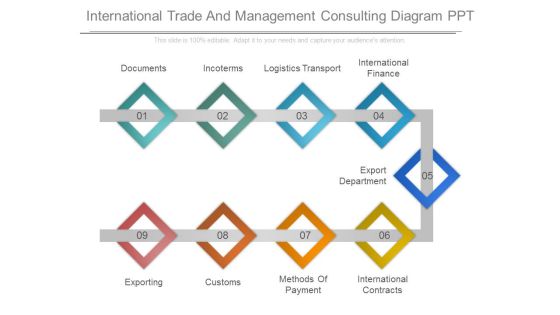
International Trade And Management Consulting Diagram Ppt
This is a international trade and management consulting diagram ppt. This is a nine stage process. The stages in this process are documents, incoterms, logistics transport, international finance, export department, exporting, customs, methods of payment, international contracts.
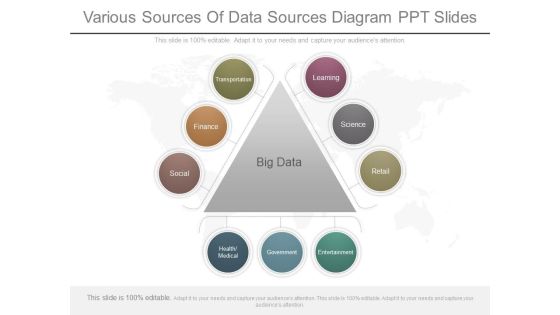
Various Sources Of Data Sources Diagram Ppt Slides
This is a various sources of data sources diagram ppt slides. This is a three stage process. The stages in this process are learning, science, retail, entertainment, government, health medical, social, finance, transportation.
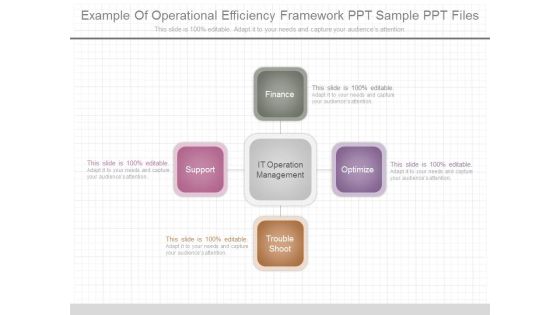
Example Of Operational Efficiency Framework Ppt Sample Ppt Files
This is a example of operational efficiency framework ppt sample ppt files. This is a four stage process. The stages in this process are finance, optimize, troubleshoot, support, it operation management.
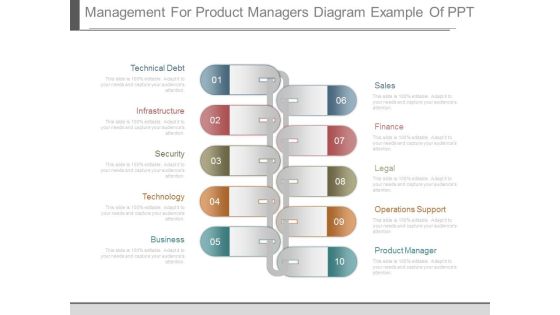
Management For Product Managers Diagram Example Of Ppt
This is a management for product managers diagram example of ppt. This is a ten stage process. The stages in this process are technical debt, infrastructure, security, technology, business, sales, finance, legal, operations support, product manager.
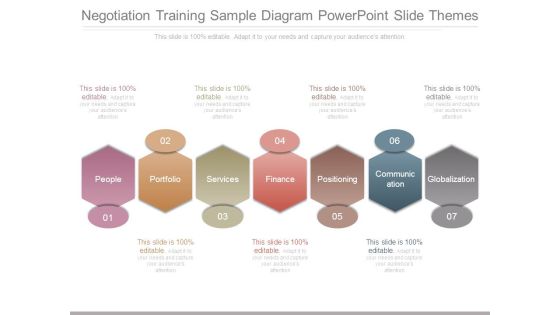
Negotiation Training Sample Diagram Powerpoint Slide Themes
This is a negotiation training sample diagram powerpoint slide themes. This is a seven stage process. The stages in this process are people, portfolio, services, finance, positioning, communication, globalization.
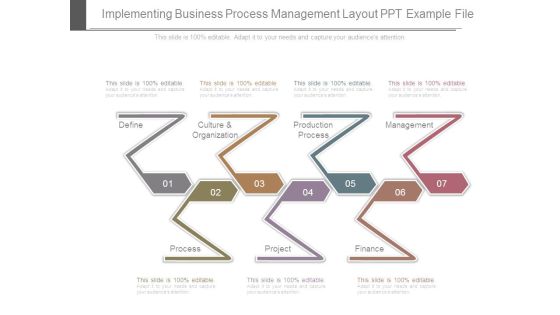
Implementing Business Process Management Layout Ppt Example File
This is a implementing business process management layout ppt example file. This is a seven stage process. The stages in this process are define, culture and organization, production process, management, finance, project, process.

The Allure Of Matrix Management Diagram Powerpoint Slides
This is a the allure of matrix management diagram powerpoint slides. This is a eight stage process. The stages in this process are context, community, control, clarity, research, production, sales, finance.

Buy Trade Process Diagram Powerpoint Slides Design
This is a buy trade process diagram powerpoint slides design. This is a six stage process. The stages in this process are preparing to shop, find a realtor, property search, financing, making an offer, closing.
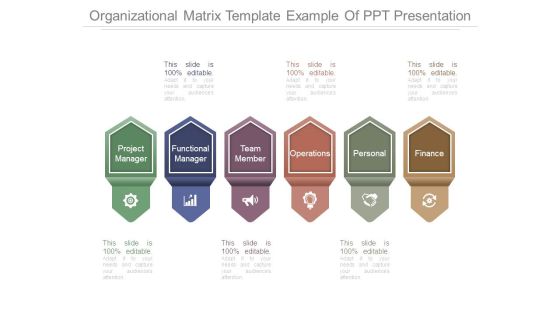
Organizational Matrix Template Example Of Ppt Presentation
This is a organizational matrix template example of ppt presentation. This is a six stage process. The stages in this process are project manager, functional manager, team member, operations, personal, finance.

Balanced Scorecard Perspectives Example Presentation Graphics
This is a balanced scorecard perspectives example presentation graphics. This is a five stage process. The stages in this process are financial perspective, customer perspective, internal process perspective, finance, learning and growth.

Business Management Dashboard Slide Powerpoint Graphics
This is a business management dashboard slide powerpoint graphics. This is a four stage process. The stages in this process are property system, crm system, asset system, finance system.

Our Team Ppt PowerPoint Presentation Rules
This is a our team ppt powerpoint presentation rules. This is a four stage process. The stages in this process are john smith finance manager, marry smith ceo and founder, joe smith product manager.
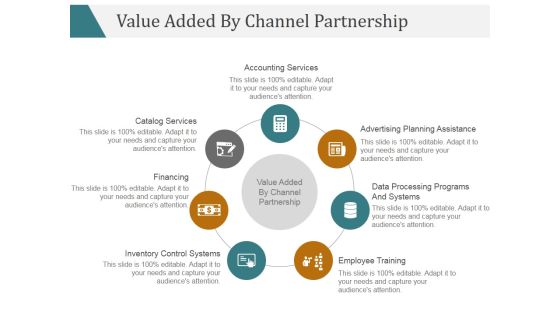
Value Added By Channel Partnership Ppt PowerPoint Presentation Layouts
This is a value added by channel partnership ppt powerpoint presentation layouts. This is a seven stage process. The stages in this process are financing, catalog services, employee training.
Investor Pitch Startup Ppt PowerPoint Presentation Complete Deck With Slides

Portfolio Evaluation Template 2 Ppt PowerPoint Presentation Inspiration Information
This is a portfolio evaluation template 2 ppt powerpoint presentation inspiration information. This is a five stage process. The stages in this process are pie, finance, percentage, business, growth.
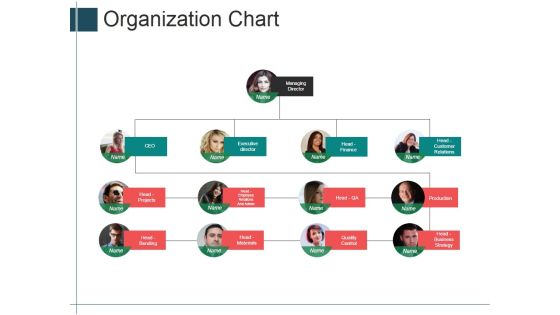
Organization Chart Ppt PowerPoint Presentation Portfolio Shapes
This is a organization chart ppt powerpoint presentation portfolio shapes. This is a four stage process. The stages in this process are managing director, executive director, head finance, head projects.
Selection Of The Optimal Portfolio Template 2 Ppt PowerPoint Presentation Icon Introduction
This is a selection of the optimal portfolio template 2 ppt powerpoint presentation icon introduction. This is a three stage process. The stages in this process are real estate, stocks, bonds, percentage, finance.

Changes In Competitive Environment Template 2 Ppt PowerPoint Presentation Infographic Template Themes
This is a changes in competitive environment template 2 ppt powerpoint presentation infographic template themes. This is a four stage process. The stages in this process are weekly, monthly, year, finance, percentage.

Our Team Template 1 Ppt PowerPoint Presentation Show Graphics
This is a our team template 1 ppt powerpoint presentation show graphics. This is a three stage process. The stages in this process are director of sales, product manager, finance manager, designer, graphic designer.

Capex Summary Template 1 Ppt PowerPoint Presentation Gallery Layout
This is a capex summary template 1 ppt powerpoint presentation gallery layout. This is a four stage process. The stages in this process are machine, milestone, percentage, finance, business.

Capex Summary Template 2 Ppt PowerPoint Presentation Show Slide
This is a capex summary template 2 ppt powerpoint presentation show slide. This is a four stage process. The stages in this process are building, machine, milestone, percentage, finance.
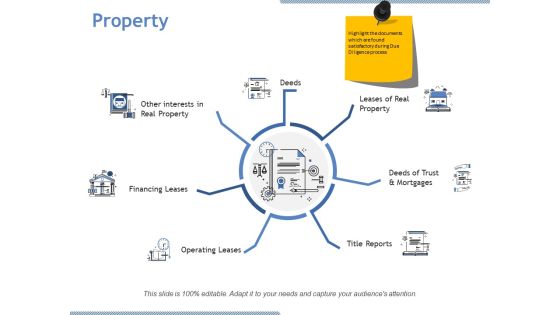
Property Ppt PowerPoint Presentation Professional Background Designs
This is a property ppt powerpoint presentation professional background designs. This is a seven stage process. The stages in this process are deeds, financing leases, operating leases, title reports, leases of real property.
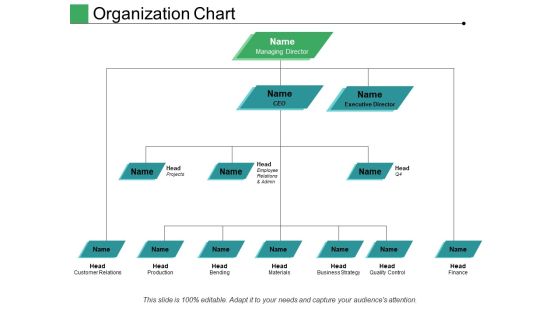
Organization Chart Ppt PowerPoint Presentation Pictures Structure
This is a organization chart ppt powerpoint presentation pictures structure. This is a three stage process. The stages in this process are managing director, executive director, head, ceo, finance.

Steps Of Expense Procedure For Financial Corporation Ppt Show PDF
The following slide showcases steps of budgeting in firms to help manage funds of the company. The steps covered are assess financial resources, determine expenses, set goals, create plan and target progress. Presenting Steps Of Expense Procedure For Financial Corporation Ppt Show PDF to dispense important information. This template comprises five stages. It also presents valuable insights into the topics including Assess Financial Resources, Determine Expenses, Set Goals, Create Plan. This is a completely customizable PowerPoint theme that can be put to use immediately. So, download it and address the topic impactfully.

Value Stream Mapping Lean Six Sigma Sample Ppt Design
This is a value stream mapping lean six sigma sample ppt design. This is a four stage process. The stages in this process are executive planning session eps, value stream analysis, rapid improvement plan rip, rapid improvement events ries, lean principles, customer value map the value stream create flow and pull seek perfection, project, just do its, cost reduction reports, standard work, flow, pull, dmaic.

Annual Report Project Plan Ppt Slide
This is a annual report project plan ppt slide. This is a one stage process. The stages in this process are financial statement, 10 k report, directors report, green annual report, auditors report, grey literature.
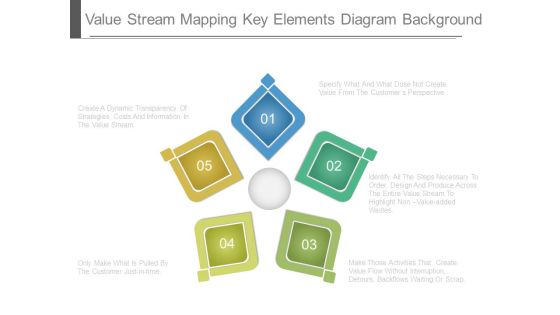
Value Stream Mapping Key Elements Diagram Background
This is a value stream mapping key elements diagram background. This is a five stage process. The stages in this process are specify what and what dose not create value from the customer perspective, identify all the steps necessary to order design and produce across the entire value stream to highlight non value added wastes, make those activities that create value flow without interruption detours backflows waiting or scrap, only make what is pulled by the customer just in time, create a dynamic transparency of strategies costs and information in the value stream.

Manage Sales Performance Diagram Powerpoint Ideas
This is a manage sales performance diagram powerpoint ideas. This is a eight stage process. The stages in this process are sales management, selecting sales team members and stimulating individual talent, developing, training and coaching, sustaining commitment to the organization, manage sales performance, budgets and targets, stimulate and manage change, develop and mange sales strategies, support the sales effort and instill discipline, create manage sales systems, processes and protocols.\n\n

Define Overall Sustainability Vision Presentation Slides
This is a define overall sustainability vision presentation slides. This is a twelve stage process. The stages in this process are setting implementation strategic, setting evaluation and monitoring parameters, actual implementation of the strategies, periodic review and course corrections, third party independent verification, publication of sustainability reports, identifying various stakeholders, identifying key areas for sustainability, define overall sustainability vision, strategy discussions, holding consultation meetings, setting goals and allocating budgets.

Force Field Analysis Diagram Powerpoint Slides
This is a force field analysis diagram powerpoint slides. This is a five stage process. The stages in this process are driving forces, restraining forces, increase in sale, customers trust brand, cost implication.

Consequences Of Poor Quality Ppt PowerPoint Presentation Styles Guidelines
This is a consequences of poor quality ppt powerpoint presentation styles guidelines. This is a six stage process. The stages in this process are lost revenue, lost customers, increased cost, damaged brand, lower profits.
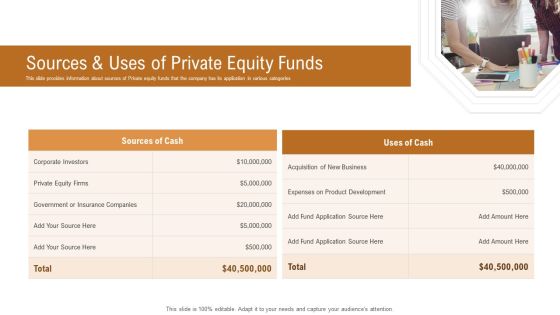
Investor Pitch Deck To Generate Venture Capital Funds Sources And Uses Of Private Equity Funds Introduction PDF
This slide provides information about sources of Private equity funds that the company has its application in various categories. This is a investor pitch deck to generate venture capital funds sources and uses of private equity funds introduction pdf template with various stages. Focus and dispense information on one stage using this creative set, that comes with editable features. It contains large content boxes to add your information on topics like sources of cash, acquisition of new business, expenses on product development. You can also showcase facts, figures, and other relevant content using this PPT layout. Grab it now.

Stock Photo Business Strategy Model 3d Graphic Of House With Red Roof Images
Delight Them With Our Stock Photo Business Strategy Model 3d Graphic Of House With Red Roof Images Powerpoint Templates. Your Audience Will Be Ecstatic. Our business Powerpoint Templates Are Created Cost Effective. They Understand The Need For Economy.

Business Framework The Cycle Of Timing 01 PowerPoint Presentation
This business slide depicts framework for cycle of timing. It contains diagram of know how competition depicting escalating costs and risks on each cycle. Download this awesome diagram to capture your audiences attention.
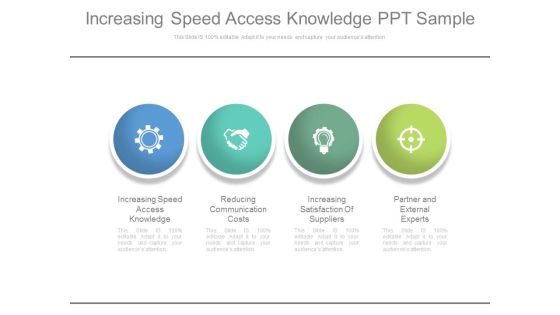
Increasing Speed Access Knowledge Ppt Sample
This is a increasing speed access knowledge ppt sample. This is a four stage process. The stages in this process are increasing speed access knowledge, reducing communication costs, increasing satisfaction of suppliers, partner and external experts.

International Trade Law Layout Sample Of Ppt Presentation
This is a international trade law layout sample of ppt presentation. This is a fourteen stage process. The stages in this process are international trade, outsourcing, tariff, import, cost, insurance, documents, freight, customs, origin, law, pricing, globalization, exchange rate.
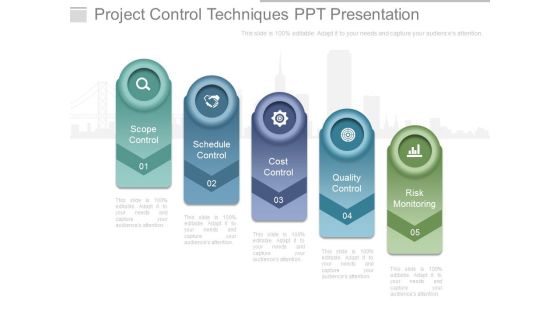
Project Control Techniques Ppt Presentation
This is a project control techniques ppt presentation. This is a five stage process. The stages in this process are scope control, schedule control, cost control, quality control, risk monitoring.

Operation Management Strategy Example Ppt Samples
This is a operation management strategy example ppt samples. This is a five stage process. The stages in this process are low cost product, technical superiority, research development, product innovation, high value offerings.

Highly Integrated Capabilities Powerpoint Slides
This is a highly integrated capabilities powerpoint slides. This is a seven stage process. The stages in this process are smartphone platform roadmap, higher performance, performance smartphone, lower cost, highly integrated capabilities, future platforms, value smartphone.

Technology And Service Example Of Ppt Presentation
This is a technology and service example of ppt presentation. This is a seven stage process. The stages in this process are insufficient space, workplace strategy, focus on work, technology and service, go green, cost focus, virtual workforce.
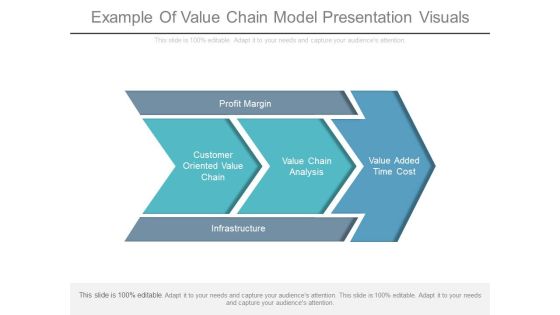
Example Of Value Chain Model Presentation Visuals
This is a example of value chain model presentation visuals. This is a five stage process. The stages in this process are profit margin, customer oriented value chain, value chain analysis, value added time cost, infrastructure.

Unique Value For Target Customers Ppt Presentation
This is a unique value for target customers ppt presentation. This is a four stage process. The stages in this process are convenience to buy, cost to satisfy, communication, consumer wants and needs.

Construction Industry Management Plan Powerpoint Slide Ideas
This is a construction industry management plan powerpoint slide ideas. This is a six stage process. The stages in this process are architects, cost managers, consulting engineers, house builders, service and maintenance, clients.

Accrual Accounting Principles Ppt Powerpoint Shapes
This is a accrual accounting principles ppt powerpoint shapes. This is a four stage process. The stages in this process are provides and more accurate financial picture, revenue when customer has ownership, cost are incurred, accrual accounting.
Total Maintenance Management Planning Diagram Slides
This is a total maintenance management planning diagram slides. This is a six stage process. The stages in this process are equipment reliability, least operating costs, defect elimination, maximum production, risk reduction, failure avoidance.
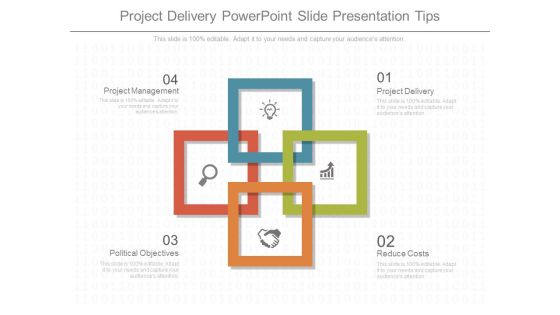
Project Delivery Powerpoint Slide Presentation Tips
This is a project delivery powerpoint slide presentation tips. This is a four stage process. The stages in this process are project management, political objectives, project delivery, reduce costs.
Advanced Customer Care Department Example Powerpoint Slide
This is a advanced customer care department example powerpoint slide. This is a six stage process. The stages in this process are environment, choice, quality, cost, accessibility, customer service.

Search Engine Optimization Objectives Ppt Slide
This is a search engine optimization objectives ppt slide. This is a seven stage process. The stages in this process are website traffic analysis, product awareness, reduced cost, increase site traffic, sales revenue, repeat visitors, sales leads.
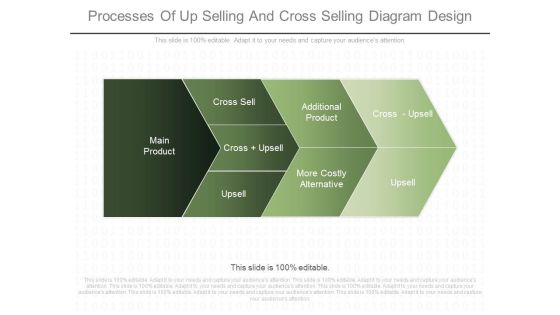
Processes Of Up Selling And Cross Selling Diagram Design
This is a processes of up selling and cross selling diagram design. This is a four stage process. The stages in this process are main product, cross sell, cross upsell, upsell, additional product, more costly alternative, cross upsell.

Build The Franchise Powerpoint Slide Clipart
This is a build the franchise powerpoint slide clipart. This is a four stage process. The stages in this process are build the franchise, improve cost structure, increase value to customer, improve use of assets.
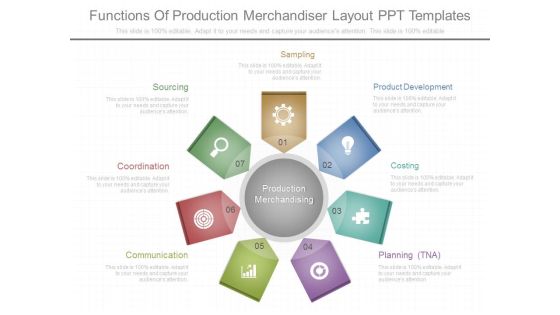
Functions Of Production Merchandiser Layout Ppt Templates
This is a functions of production merchandiser layout ppt templates. This is a seven stage process. The stages in this process are sampling, product development, costing, planning tna, communication, coordination, sourcing, production merchandising.

Customer Focus Planning Layout Ppt Info Graphic Template
This is a customer focus planning layout ppt info graphic template. This is a four stage process. The stages in this process are customer solvation, customer cost, commutation, convenience, customer focus.
Relevant Content Powerpoint Slides
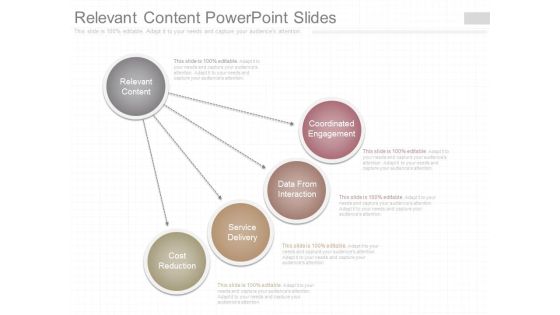
This is a relevant content powerpoint slides. This is a four stage process. The stages in this process are relevant content, coordinated engagement, data from interaction, service delivery, cost reduction.
Importance Of Big Data Analytics Sample Diagram Ppt Slides
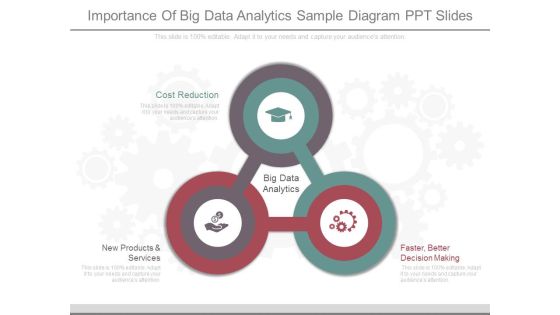
This is a importance of big data analytics sample diagram ppt slides. This is a three stage process. The stages in this process are cost reduction, big data analytics, new products and services, faster, better decision making.

Competitive Advantage Of Big Data Sample Ppt Slides
This is a competitive advantage of big data sample ppt slides. This is a five stage process. The stages in this process are possible cost savings, continual innovation, visibility into causal relationship, potential revenue, more informed decision making, competitive advantage.
Revenue Guidance On R And D Example Ppt Slides
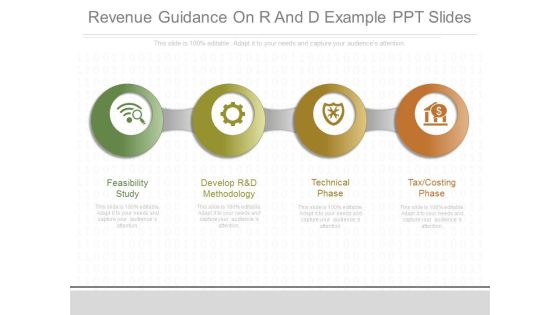
This is a revenue guidance on r and d example ppt slides. This is a four stage process. The stages in this process are feasibility study, develop r and d methodology, technical phase, tax costing phase.
Operational Dashboards Powerpoint Slide Examples
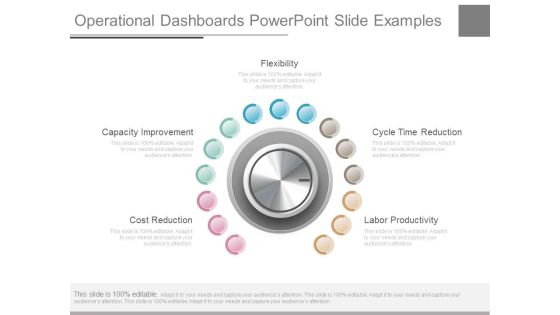
This is a operational dashboards powerpoint slide examples. This is a five stage process. The stages in this process are cost reduction, capacity improvement, flexibility, cycle time reduction, labor productivity.
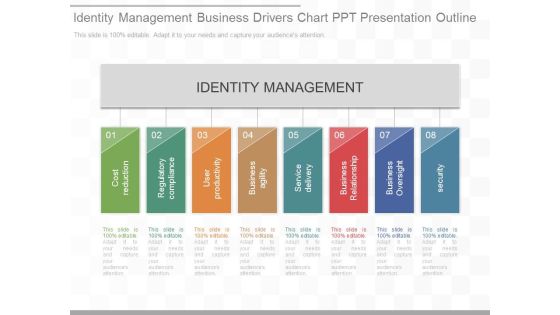
Identity Management Business Drivers Chart Ppt Presentation Outline
This is a identity management business drivers chart ppt presentation outline. This is a eight stage process. The stages in this process are identity management, cost reduction, regulatory compliance, user productivity, business agility, service delivery, business relationship, business oversight, security.

Example Of Transitional Strategy Ppt Presentation Diagrams
This is a example of transitional strategy ppt presentation diagrams. This is a four stage process. The stages in this process are cost reduction consideration, local responsiveness consideration, global strategy, transnational strategy, international strategy, multi domestic strategy.
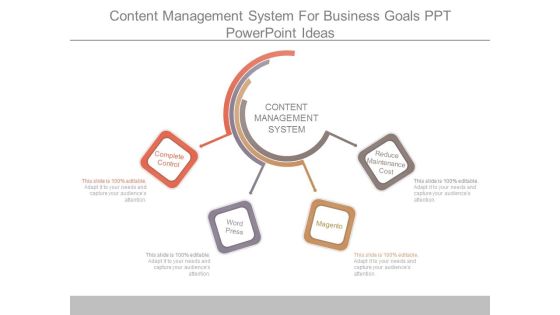
Content Management System For Business Goals Ppt Powerpoint Ideas
This is a content management system for business goals ppt powerpoint ideas. This is a four stage process. The stages in this process are content management system, complete control, word press, magento, reduce maintenance cost.

B2b Supply Chain Diagram Powerpoint Graphics
This is a b2b supply chain diagram powerpoint graphics. This is a seven stage process. The stages in this process are goal, initiatives, information, productivity, customer satisfaction, supply chain excellence, cost saving.

Building Quality Products And Services Template Presentation Design
This is a building quality products and services template presentation design. This is a eight stage process. The stages in this process are highest quality, business success, increased profitability, cost reduction, enhanced security, web enabled services, quality beyond.

Flexible Working Policies Presentation Slide Powerpoint Graphics
This is a flexible working policies presentation slide powerpoint graphics. This is a six stage process. The stages in this process are assign, allocate, monitor, evaluate, full system integration, reduce admin costs, kpi tracking, connect, interact.
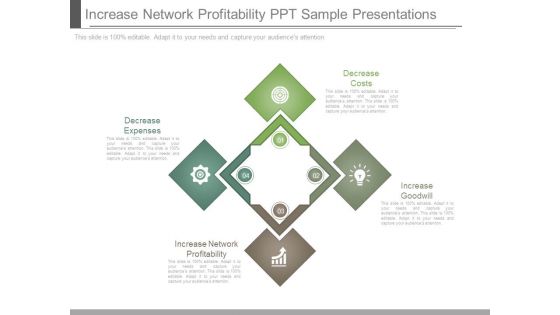
Increase Network Profitability Ppt Sample Presentations
This is a increase network profitability ppt sample presentations. This is a four stage process. The stages in this process are decrease expenses, increase network profitability, increase goodwill, decrease costs.

Task Chance Management Template Presentation Visuals
This is a task chance management template presentation visuals. This is a five stage process. The stages in this process are quality, cost, staff, developing individuals, building the team.

Customer Engagement Model For Continuous Improvement Ppt Ideas
This is a customer engagement model for continuous improvement ppt ideas. This is a three stage process. The stages in this process are process, best particle, performance engineering, cost, technology, people, productivity, efficiency, scalability, customer satisfaction, optimization, continuous improvement.

B2b Integration Benefits Sample Diagram Ppt Sample
This is a b2b integration benefits sample diagram ppt sample. This is a four stage process. The stages in this process are manual paper work, lack of visibility, lower cost of it infrastructure, optimized staff efficiency.
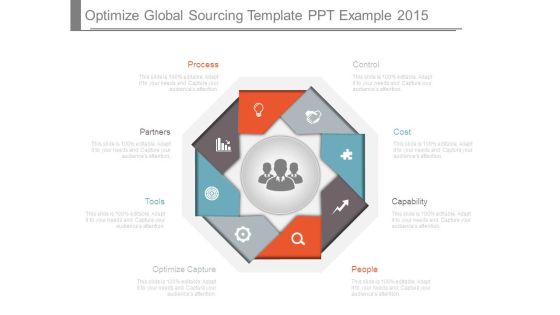
Optimize Global Sourcing Template Ppt Example 2015
This is a optimize global sourcing template ppt example 2015. This is a eight stage process. The stages in this process are control, cost, capability, people, optimize capture, tools, partners, process.
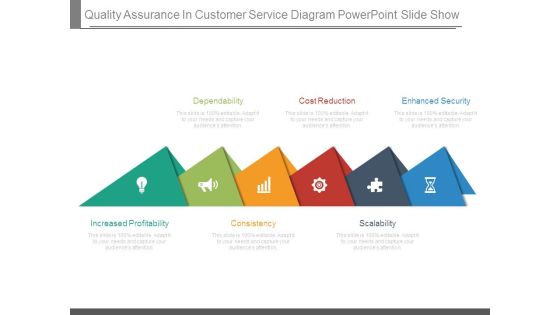
Quality Assurance In Customer Service Diagram Powerpoint Slide Show
This is a quality assurance in customer service diagram powerpoint slide show. This is a six stage process. The stages in this process are dependability, cost reduction, enhanced security, scalability, consistency, increased profitability.
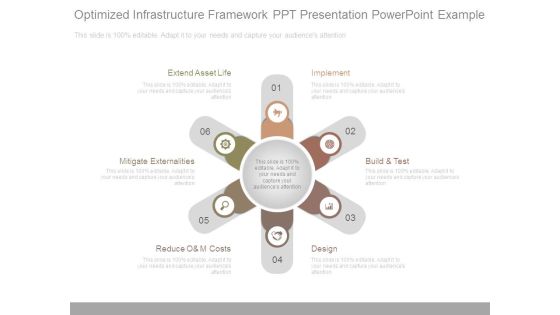
Optimized Infrastructure Framework Ppt Presentation Powerpoint Example
This is a optimized infrastructure framework ppt presentation powerpoint example. This is a six stage process. The stages in this process are implement, build and test, design, reduce o and m costs, mitigate externalities, extend asset life.

Asset Management Business Diagram Powerpoint Slides Background Image
This is a asset management business diagram powerpoint slides background image. This is a seven stage process. The stages in this process are retirement, maintenance, risk, cost, growth, bonds, stocks.
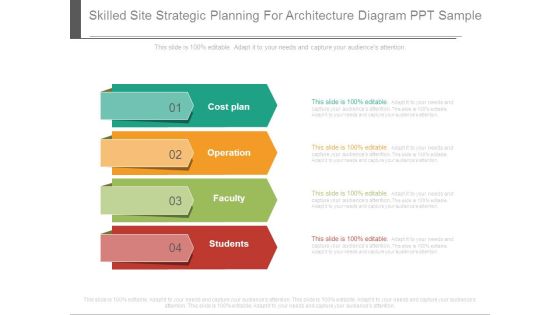
Skilled Site Strategic Planning For Architecture Diagram Ppt Sample
This is a skilled site strategic planning for architecture diagram ppt sample. This is a four stage process. The stages in this process are cost plan, operation, faculty, students.
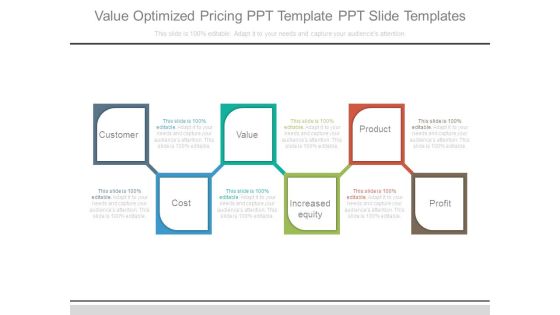
Value Optimized Pricing Ppt Template Ppt Slide Templates
This is a value optimized pricing ppt template ppt slide templates. This is a six stage process. The stages in this process are customer, cost, value, increased equity, product, profit.

Customer Focus Development Diagram Powerpoint Slides Background
This is a customer focus development diagram powerpoint slides background. This is a seven stage process. The stages in this process are product leadership, customer intimacy, customer solution, convenience, customer focus, customer cost, communication.

Benefits Of Workflow Administration Diagram Ppt Presentation Visual Aids
This is a benefits of workflow administration diagram ppt presentation visual aids. This is a five stage process. The stages in this process are automate information flow processes, design, improved project team work, operate, saving time and costs.

Break Even Analysis Template Powerpoint Slide Presentation Tips
This is a break even analysis template powerpoint slide presentation tips. This is a four stage process. The stages in this process are loss, break even point, meet costs, make profit.

Compete And Grow Powerpoint Slide Background Image
This is a compete and grow powerpoint slide background image. This is a two stage process. The stages in this process are compete and grow, improve efficiency and cost.

Prospect Need Assessment Example Ppt Slide
This is a prospect need assessment example ppt slide. This is a eight stage process. The stages in this process are analysis, preferences, habit, income, needs, change in profits, change in costs, change in revenues, change in quantity.

Contractor Estimate Template Powerpoint Slides Deck Template
This is a contractor estimate template powerpoint slides deck template. This is a six stage process. The stages in this process are construction planning, schedule oriented, equipment, material, direct costs, stability.

Benefit Strategy Layout Powerpoint Slide Backgrounds
This is a benefit strategy layout powerpoint slide backgrounds. This is a six stage process. The stages in this process are workforce advantage, cost advantage, benefit strategy, corporate culture, current benefit strategy, overall objectives.
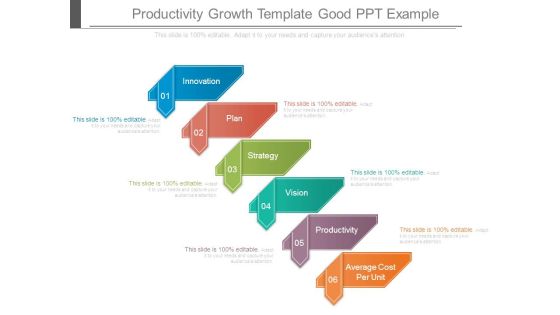
Productivity Growth Template Good Ppt Example
This is a productivity growth template good ppt example. This is a six stage process. The stages in this process are innovation, plan, strategy, vision, productivity, average cost per unit.

Organizational Performance Model Template Powerpoint Slide Templates Download
This is a organizational performance model template powerpoint slide templates download. This is a four stage process. The stages in this process are executive coaching, cost management, leadership assessment, process management.

Progress Action Strategy Diagram Powerpoint Slide Graphics
This is a progress action strategy diagram powerpoint slide graphics. This is a six stage process. The stages in this process are lower inventory costs, self assessment, formative assessment evaluation, find alternative revenue streams, summative evaluation, implementing of the plan.

Record Trade Planning Template Powerpoint Slide Themes
This is a record trade planning template powerpoint slide themes. This is a six stage process. The stages in this process are maintain, secure, grow, account size, price pressure, cost pressure.

Cms Web Development Process Diagram Powerpoint Images
This is a cms web development process diagram powerpoint images. This is a seven stage process. The stages in this process are cms, services, simplified content management, save time and efforts, reduce maintenance cost, complete control, catalogue, projects.

E Learning For A Stronger Workforce Example Ppt Slides
This is a e learning for a stronger workforce example ppt slides. This is a four stage process. The stages in this process are orientation, cost effective, quick to update, performance.

Broadcast Media Task Administration Example Of Ppt Presentation
This is a broadcast media task administration example of ppt presentation. This is a four stage process. The stages in this process are planning and costing, design and production, testing, delivery.

Business Trading Diagram Ppt Design
This is a business trading diagram ppt design. This is a two stage process. The stages in this process are store, cutting, design, quality, manufacture, the major diff, costs of goods, ending merchandise.
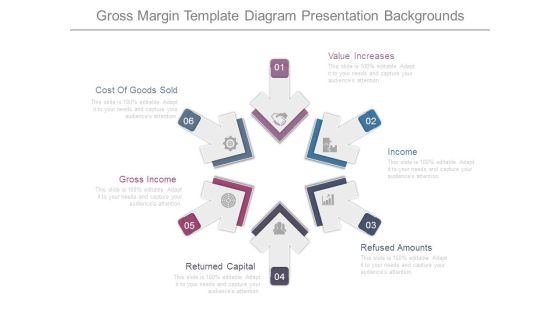
Gross Margin Template Diagram Presentation Backgrounds
This is a gross margin template diagram presentation backgrounds. This is a six stage process. The stages in this process are value increases, income, refused amounts, returned capital, gross income, cost of goods sold.
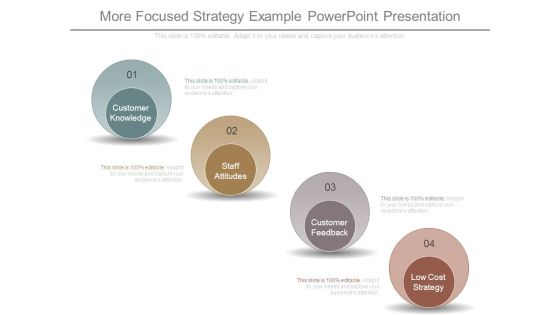
More Focused Strategy Example Powerpoint Presentation
This is a more focused strategy example powerpoint presentation. This is a four stage process. The stages in this process are customer knowledge, staff attitudes, customer feedback, low cost strategy.

Sales Pricing Strategy Template Presentation Diagrams
This is a sales pricing strategy template presentation diagrams. This is a six stage process. The stages in this process are cost, volume, value, yield management, real time, auction.

Project Management Activities Diagram Presentation Powerpoint Templates
This is a project management activities diagram presentation powerpoint templates. This is a seven stage process. The stages in this process are cost management, communication, time management, timing, development, strategy, control.
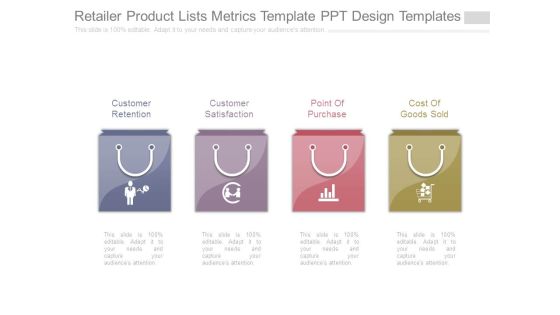
Retailer Product Lists Metrics Template Ppt Design Templates
This is a retailer product lists metrics template ppt design templates. This is a four stage process. The stages in this process are customer retention, customer satisfaction, point of purchase, cost of goods sold.
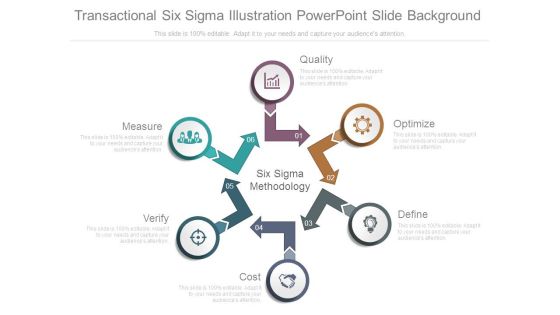
Transactional Six Sigma Illustration Powerpoint Slide Background
This is a transactional six sigma illustration powerpoint slide background. This is a six stage process. The stages in this process are quality, optimize, define, cost, verify, measure, six sigma methodology.
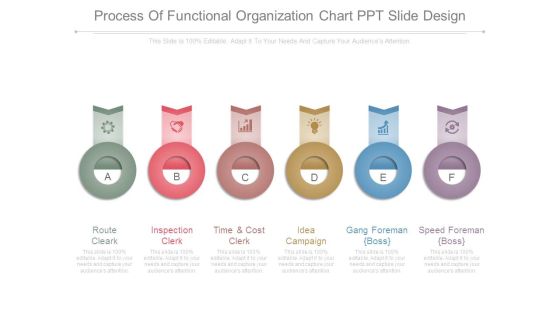
Process Of Functional Organization Chart Ppt Slide Design
This is a process of functional organization chart ppt slide design. This is a six stage process. The stages in this process are route cleark, inspection clerk, time and cost clerk, idea campaign, gang foreman boss, speed foreman boss.

Constructional Task Management Layout Ppt Design
This is a constructional task management layout ppt design. This is a four stage process. The stages in this process are improve quality, mitigate risk, lower costs, accelerate results.

Application Optimization Example Powerpoint Slide Show
This is a application optimization example powerpoint slide show. This is a six stage process. The stages in this process are control, cost, capability, optimize capture, application transport, application placement.
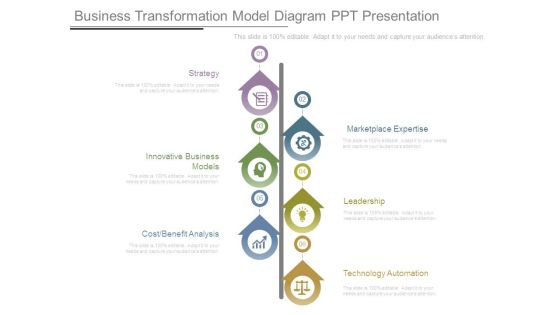
Business Transformation Model Diagram Ppt Presentation
This is a business transformation model diagram ppt presentation. This is a six stage process. The stages in this process are strategy, innovative business models, cost benefit analysis, marketplace expertise leadership, technology automation.

Wbs Dictionary Item Table Sample Of Ppt
This is a wbs dictionary item table sample of ppt. This is a four stage process. The stages in this process are milestones, estimates, cost, time, project, work package, wbs element, description, acceptance criteria.
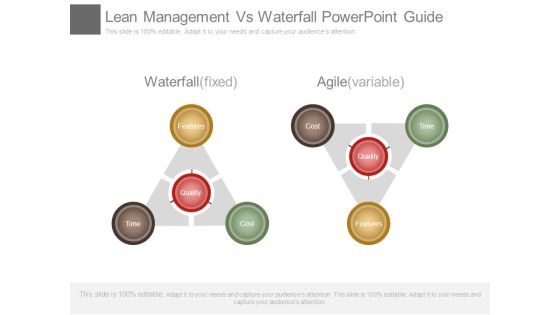
Lean Management Vs Waterfall Powerpoint Guide
This is a lean management vs waterfall powerpoint guide. This is a two stage process. The stages in this process are waterfall fixed, features, quality, time, cost, agile variable.

Process Improvement Benefits Example Ppt Examples Professional
This is a process improvement benefits example ppt examples professional. This is a six stage process. The stages in this process are improved schedule, increased roi, increased productivity, improved quality, decreased cost of quality improved cycle time.

Project Management Key Skills Ppt Powerpoint Images
This is a project management key skills ppt powerpoint images. This is a nine stage process. The stages in this process are scope, time, cost, quality, integration, procurement, hr, risk, communications.

Concepts Of Quality Management Diagram Powerpoint Images
This is a concepts of quality management diagram powerpoint images. This is a six stage process. The stages in this process are concepts of iso quality management, customer satisfaction, prevention over inspection, continuous improvement, management responsibility, cost of quality.
