AI PPT Maker
Templates
PPT Bundles
Design Services
Business PPTs
Business Plan
Management
Strategy
Introduction PPT
Roadmap
Self Introduction
Timelines
Process
Marketing
Agenda
Technology
Medical
Startup Business Plan
Cyber Security
Dashboards
SWOT
Proposals
Education
Pitch Deck
Digital Marketing
KPIs
Project Management
Product Management
Artificial Intelligence
Target Market
Communication
Supply Chain
Google Slides
Research Services
 One Pagers
All Categories
-
Home
- Customer Favorites
- Marketing Metrics
Marketing Metrics

Business Framework Portfolio Risk 1 PowerPoint Presentation
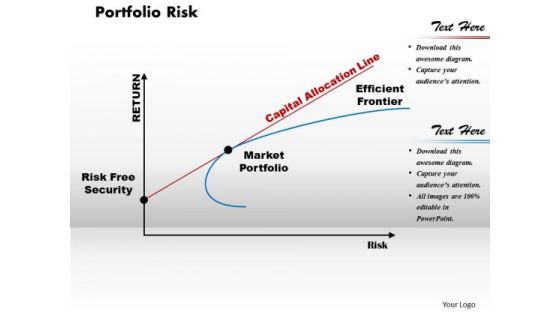
This business framework image slide displays portfolio risk stock variance calculator PowerPoint template. Use this image slide, in your presentations to depict portfolio risk measures like number of stocks and returns. This image slide will enhance the quality of your presentations.
Business Framework Portfolio Risk PowerPoint Presentation
This business framework image slide displays portfolio return and risk calculator graph PowerPoint template. Use this image slide, in your presentations to depict portfolio risk measures like number of stocks and there returns. This image slide will enhance the quality of your presentations.

Ppc Management Techniques Diagram Powerpoint Ideas
This is a ppc management techniques diagram powerpoint ideas. This is a seven stage process. The stages in this process are measuring keyword intent, diverse strategy, quality score best practices, conversion and monetization, visibility across multiple platforms, outside the box testing, deep review of analytics data, ppc success.
Successful Customer Centric Strategies Ppt Powerpoint Layout
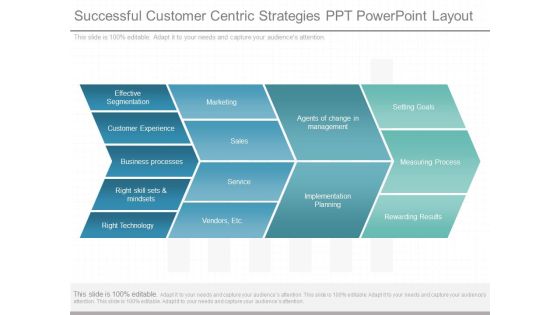
This is a successful customer centric strategies ppt powerpoint layout. This is a four stage process. The stages in this process are effective segmentation, customer experience, business processes, right skill sets and mindsets, right technology, sales, service, vendors, etc, agents of change in management, implementation planning, setting goals, measuring process, rewarding results.

Appropriate Assessment Process Presentation Design
This is a appropriate assessment process presentation design. This is a four stage process. The stages in this process are clearly define and identify the learning outcomes, select appropriate assessment measures and assess the learning outcomes, analyze the results of the outcomes assessed, adjust or improve programs following the results of the results of the laming outcomes assessed.
Global Quality System Layout Presentation Pictures
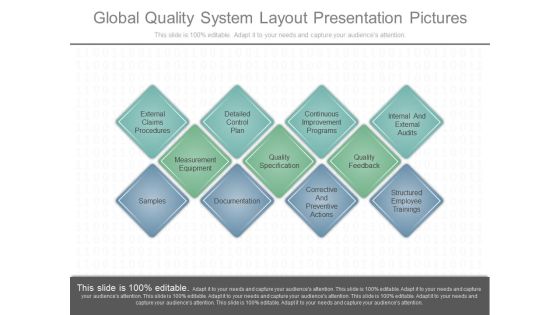
This is a global quality system layout presentation pictures. This is a eleven stage process. The stages in this process are external claims procedures, detailed control plan, continuous improvement programs, internal and external audits, measurement equipment, quality specification, quality feedback, samples, documentation, corrective and preventive actions, structured employee trainings.
Industrial Relations And Human Resource Management Example Ppt Design
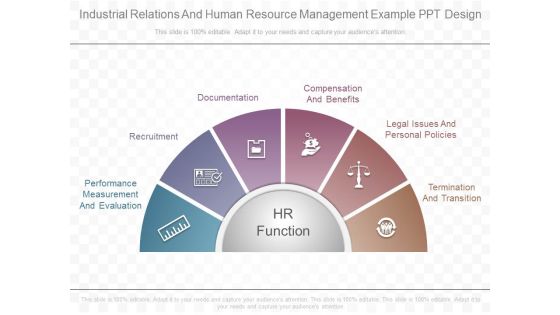
This is a industrial relations and human resource management example ppt design. This is a six stage process. The stages in this process are performance measurement and evaluation, recruitment, documentation, compensation and benefits, legal issues and personal policies, termination and transition, hr function.
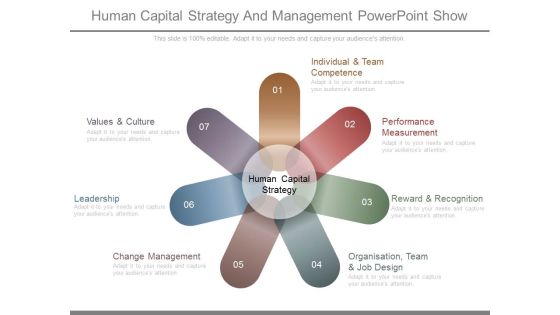
Human Capital Strategy And Management Powerpoint Show
This is a human capital strategy and management powerpoint show. This is a seven stage process. The stages in this process are individual and team competence, performance measurement, reward and recognition, organisation, team and job design, change management, leadership, values and culture, human capital strategy.
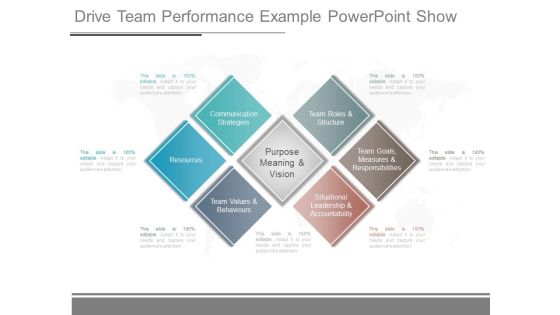
Drive Team Performance Example Powerpoint Show
This is a drive team performance example powerpoint show. This is a six stage process. The stages in this process are communication strategies, resources, team values and behaviours, purpose meaning and vision, team roles and structure, team goals, measures and responsibilities, situational leadership and accountability.

Business Cultural Change Roadmap Diagram Presentation Ideas
This is a business cultural change roadmap diagram presentation ideas. This is a seven stage process. The stages in this process are leadership purpose vision and value, organizational strategy, departmental implementation, organizational artefacts, leadership coaching programs, individual and team coaching, roi, measurement criteria, review and feedback.

Business Strategy Development And Implementation Ppt Powerpoint Guide
This is a business strategy development and implementation ppt powerpoint guide. This is a four stage process. The stages in this process are execution and ongoing monitoring, business vision and measurement goals, review of vision and goals needs and objectives, business mission.

Perspective Performance Indicator Ppt Powerpoint Slide Designs
This is a perspective performance indicator ppt powerpoint slide designs. This is a seven stage process. The stages in this process are performance indicator, perspective, unit, description formula, data source, measurement instrument, method of test how, frequency when, decision criteria, data collector who, owner, baseline, target, process diagram or drawings.
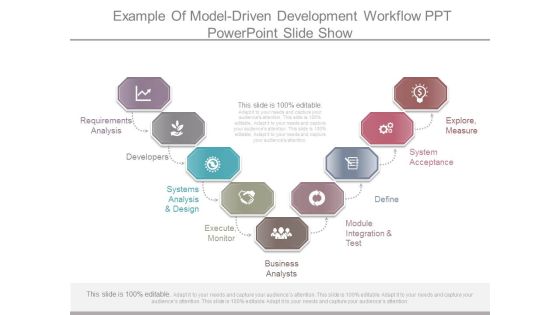
Example Of Model Driven Development Workflow Ppt Powerpoint Slide Show
This is a example of model driven development workflow ppt powerpoint slide show. This is a nine stage process. The stages in this process are requirements analysis, developers, systems analysis and design, execute, monitor, business analysts, module integration and test, define, system acceptance, explore, measure.

Processes For System Development Life Cycle With Product Design Ppt
This is a processes for system development life cycle with product design ppt. This is a eight stage process. The stages in this process are problem, measure needs and set target, explore design, optimize the design choices, development architecture, validate design, execute design, iterate design, concept, planning, development, design, requirements, operation and maintains, integration, implementation, system development life cycle, product design process.
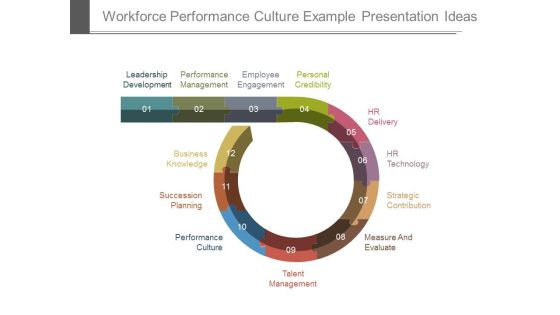
Workforce Performance Culture Example Presentation Ideas
This is a workforce performance culture example presentation ideas. This is a twelve stage process. The stages in this process are leadership development, performance management, employee engagement, personal credibility, hr delivery, hr technology, strategic contribution, measure and evaluate, talent management, performance culture, succession planning, business knowledge.

Improve Social Networking Skills Diagram Ppt Presentation Idea
This is a improve social networking skills diagram ppt presentation idea. This is a six stage process. The stages in this process are social media intelligence, develop positioning, remember basics, build presence, integrate across firm, web management, content creation, define strategy, measure results, develop relations, create content, optimize content, scheduling and management, strategy and reporting, social media research.

Example Of Data Policy And Governance Framework Ppt Example Ppt Presentation
This is a example of data policy and governance framework ppt example ppt presentation. This is a six stage process. The stages in this process are it objectives and technology initiatives, business objectives and value, data governance, identify data, procure acquire data, transform data, measure and monitor data, store data, deliver data and manage change.

Agile Information Governance Process Ppt Powerpoint Layout
This is a agile information governance process ppt powerpoint layout. This is a six stage process. The stages in this process are define business problem, obtain executive sponsors, align teams, understand data risk and value, implement project, measure results, plan, act, assess.

Sales Compensation Plan Template Good Ppt Example
This is a sales compensation plan template good ppt example. This is a eight stage process. The stages in this process are review strategic goals, assess current plan, assemble advisors, formulate new plan, plan implementation, evaluate and measure, managing profit and performance execution, managing profit and performance review and evaluation.

Allowance Execution Model Diagram Powerpoint Slide Presentation Sample
This is a allowance execution model diagram powerpoint slide presentation sample. This is a eight stage process. The stages in this process are determine results, procurement process, impact measurement process, clarify result definitions, value programs based on results, audit and legislative oversight process, identify programs, budget execution process.

Roster Management Diagram Template Powerpoint Slide Deck Template
This is a roster management diagram template powerpoint slide deck template. This is a eight stage process. The stages in this process are schedule model development, level of accuracy, units of measure, schedule model maintenance, control thresholds, performance management rules, reporting format, process description.
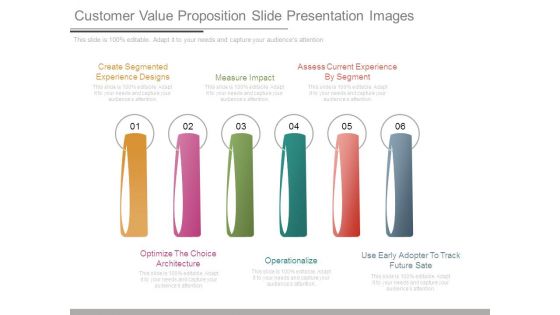
Customer Value Proposition Slide Presentation Images
This is a customer value proposition slide presentation images. This is a six stage process. The stages in this process are create segmented experience designs, measure impact, assess current experience by segment, optimize the choice architecture, operationalize, use early adopter to track future sate.
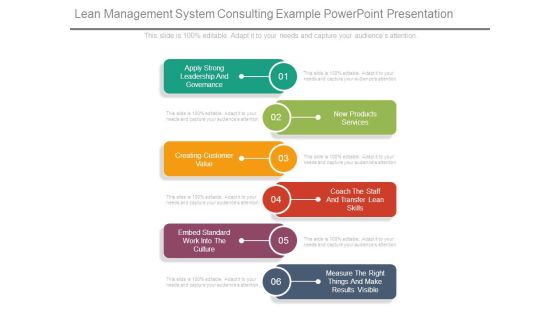
Lean Management System Consulting Example Powerpoint Presentation
This is a lean management system consulting example powerpoint presentation. This is a six stage process. The stages in this process are apply strong leadership and governance, new products services, creating customer value, coach the staff and transfer lean skills, embed standard work into the culture, measure the right things and make results visible.
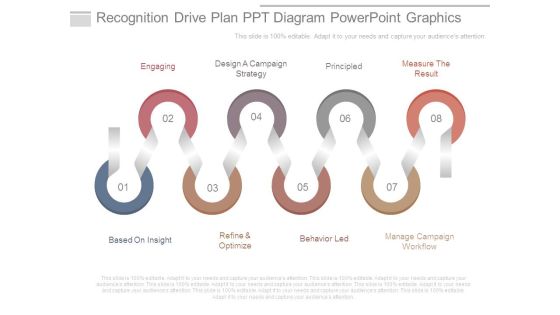
Recognition Drive Plan Ppt Diagram Powerpoint Graphics
This is a recognition drive plan ppt diagram powerpoint graphics. This is a eight stage process. The stages in this process are engaging, design a campaign strategy, principled, measure the result, based on insight, refine and optimize, behavior led, manage campaign workflow.

Improve Social Networking Skills Diagram Ppt Sample Presentations
This is a improve social networking skills diagram ppt sample presentations. This is a eight stage process. The stages in this process are optimize content, define strategy, strategy and reporting, content creation, social media research, measure results, create content, build presence.

Dmaic Improvement Process Powerpoint Templates Download
This is a dmaic improvement process powerpoint templates download. This is a five stage process. The stages in this process are toll gate review, define the opportunities, measure the performance, analyse the performance, improve the performance, control the performance, activities to be executed at each phase, relational tools techniques acquired, expected deliverables at each phase.
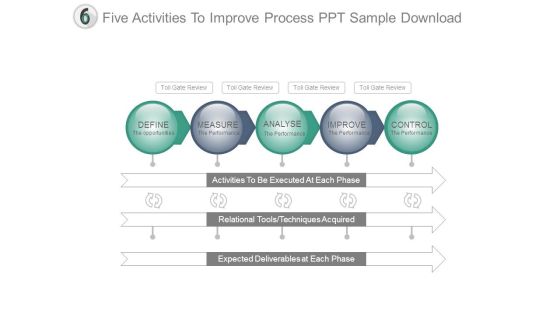
Five Activities To Improve Process Ppt Sample Download
This is a five activities to improve process ppt sample download. This is a five stage process. The stages in this process are activities to be executed at each phase, relational tools techniques acquired, expected deliverables at each phase, define, measure, analyse, improve, control.
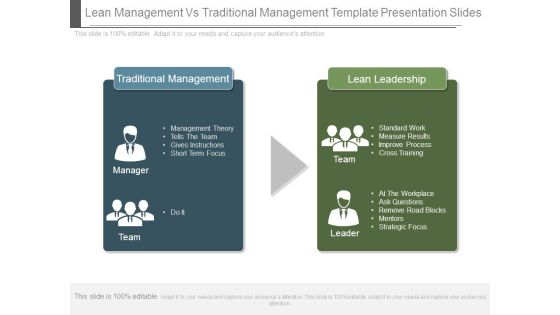
Lean Management Vs Traditional Management Template Presentation Slides
This is a lean management vs traditional management template presentation slides. This is a two stage process. The stages in this process are traditional management, management theory tells the team gives instructions short term focus, manager, do it, team, lean leadership, standard work measure results improve process cross training, at the workplace ask questions remove road blocks mentors strategic focus, team, leader.
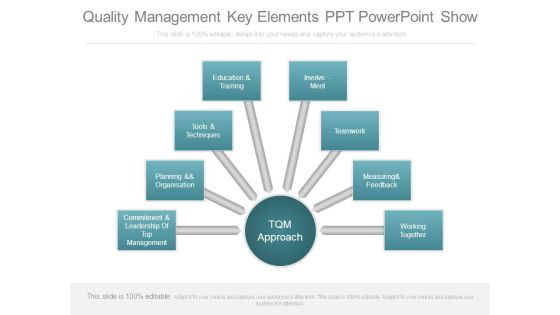
Quality Management Key Elements Ppt Powerpoint Show
This is a quality management key elements ppt powerpoint show. This is a eight stage process. The stages in this process are tqm approach, commitment and leadership of top management, planning and organisation, tools and techniques, education and training, involvement, teamwork, measuring and feedback, working together.
Working Capital Computation Icons Slide Growth Social Ppt PowerPoint Presentation Infographics Themes
Presenting this set of slides with name working capital computation icons slide growth social ppt powerpoint presentation infographics themes. The topics discussed in these slides are growth, measure, technology, business, management. This is a completely editable PowerPoint presentation and is available for immediate download. Download now and impress your audience.
Net Working Capital Analysis Icons Slide Technology Finance Ppt PowerPoint Presentation Diagram Images
Presenting this set of slides with name net working capital analysis icons slide technology finance ppt powerpoint presentation diagram images. The topics discussed in these slides are growth, measure, technology, business, management. This is a completely editable PowerPoint presentation and is available for immediate download. Download now and impress your audience.

Usa Ppt Background Linear Arrow 10 State PowerPoint Project Diagram 5 Image
USA PPT Background linear arrow 10 state powerpoint project diagram 5 Image-Use this diagram to emphasize the process of your corporate growth. Highlight your ideas broad- based on strong fundamentals and illustrate how they step by step achieve the set growth factor.-USA PPT Background linear arrow 10 state powerpoint project diagram 5 Image-Arrow, Background, Collection, Completed, Concept, Confirmation, Design, Flow, Graph, Graphic, Illustration, Indication, Indicator, Information, Instruction, Interface, Internet, Layout, Measurement, Order, Phase, Pointer, Process, Progress, Reflection, Scale, Shape, Sign
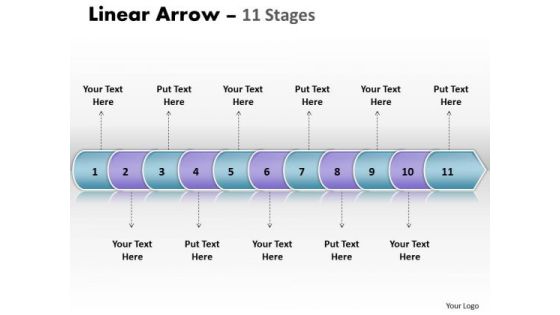
Usa Ppt Linear Arrow 11 Phase Diagram Business Management PowerPoint Image
USA PPT linear arrow 11 phase diagram business management powerpoint Image-This Linear Diagram is simple but nice enough to illustrate your thoughts and experiences to your staff. Explain in detail you assessment of the need for care to ensure continued smooth progress.-USA PPT linear arrow 11 phase diagram business management powerpoint Image-Arrow, Background, Collection, Completed, Concept, Confirmation, Design, Flow, Graph, Graphic, Illustration, Indication, Indicator, Information, Instruction, Interface, Internet, Layout, Measurement, Order, Phase, Pointer, Process, Progress, Reflection, Scale, Shape, Sign
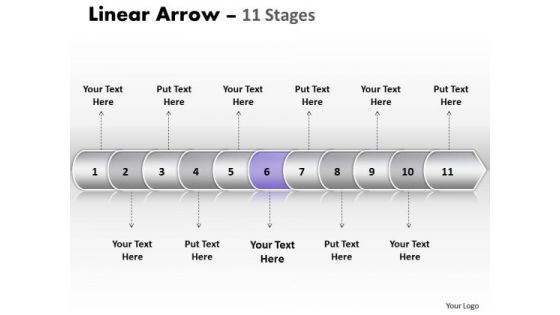
Usa Ppt Template Linear Arrow 11 Phase Diagram Time Management PowerPoint 7 Design
USA PPT template linear arrow 11 phase diagram time management powerpoint 7 design-This diagram is capable of conveying the important characteristics more plainly than what words are capable of doing. Feel the buzz as they comprehend your plan to get the entire act together.-USA PPT template linear arrow 11 phase diagram time management powerpoint 7 design-Arrow, Background, Collection, Completed, Concept, Confirmation, Design, Flow, Graph, Graphic, Illustration, Indication, Indicator, Information, Instruction, Interface, Internet, Layout, Measurement, Order, Phase, Pointer, Process, Progress, Reflection, Scale, Shape, Sign
Quality Improvement Methodologies Ppt Background Graphics
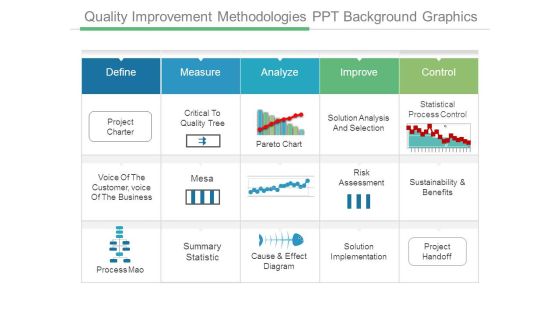
This is a quality improvement methodologies ppt background graphics. This is a five stage process. The stages in this process are define, measure, analyze, improve, control, project charter, critical to quality tree, pareto chart, solution analysis and selection, statistical process control, voice of the customer, voice of the business, mesa, risk assessment, sustainability and benefits, process mao, summary statistic, cause and effect diagram, solution implementation, project handoff.

Continuous Improvement Cycle Powerpoint Show
This is a continuous improvement cycle powerpoint show. This is a five stage process. The stages in this process are define, measure, analyze, improve, control, project charter, critical to quality tree, pareto chart, solution analysis and selection, statistical process control, voice of the customer voice of the business, mesa, risk assessment, sustainability and benefits, process mao, summary statistic, cause and effect diagram, solution implementation, project handoff.

Pdca Infographic Template Powerpoint Slide Backgrounds
This is a pdca infographic template powerpoint slide backgrounds. This is a five stage process. The stages in this process are define, measure, analyze, improve, control, project charter, critical to quality tree, pareto chart, solution analysis and selection, statistical process control, voice of the customer voice of the business, mesa, risk assessment, sustainability and benefits, process mao, summary statistic, cause and effect diagram, solution implementation, project handoff.

Ppt Fourth Stage Description Using PowerPoint Graphics Arrows Templates
PPT fourth stage description using powerpoint graphics arrows Templates-A management technique that scrutinizes the processes that a company goes through to perform certain tasks. The intention is to create a more efficient way of working, thereby saving time and money. This image represents the concept of Defining five different points of view on the same topic using Arrows. Deliver amazing presentations to mesmerize your audience using this Diagram.-PPT fourth stage description using powerpoint graphics arrows Templates-arrow, background, banner, bar, blank, box, bubble, business, colorful, communication, cubes, curve, decorative, design, glowing, graphic, icon, label, message, number, pattern, product, sale, shape, shiny, sign, sticker, symbol, tag, template, text, title, vector, web

Usa Ppt Background Linear Arrow 10 State PowerPoint Project Diagram 6 Image
USA PPT Background linear arrow 10 state powerpoint project diagram 6 Image-Use this diagram to display your ideas and highlight their ability to accelerate the growth of your company and you. Impress upon the audience how your strategy will carry all to the top of the corporate heap.-USA PPT Background linear arrow 10 state powerpoint project diagram 6 Image-Arrow, Background, Collection, Completed, Concept, Confirmation, Design, Flow, Graph, Graphic, Illustration, Indication, Indicator, Information, Instruction, Interface, Internet, Layout, Measurement, Order, Phase, Pointer, Process, Progress, Reflection, Scale, Shape, Sign

Usa Ppt Template Linear Arrow 11 Phase Diagram Time Management PowerPoint 6 Design
USA PPT template linear arrow 11 phase diagram time management powerpoint 6 design-This linear arrow chart makes information accessible throughout the organization with a collective, visible view of critical data from different perspectives and providing the tools to upcoming business scenarios and plan for change.-USA PPT template linear arrow 11 phase diagram time management powerpoint 6 design-Arrow, Background, Collection, Completed, Concept, Confirmation, Design, Flow, Graph, Graphic, Illustration, Indication, Indicator, Information, Instruction, Interface, Internet, Layout, Measurement, Order, Phase, Pointer, Process, Progress, Reflection, Scale, Shape, Sign
Six Standard Deviations Example Ppt Examples Slides
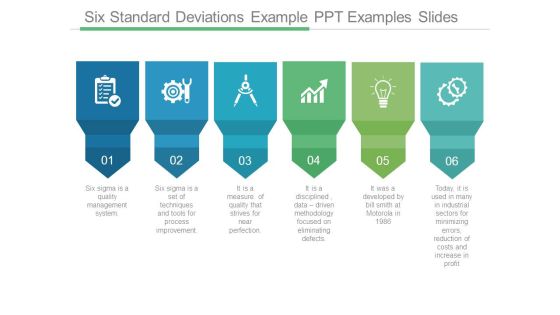
This is a six standard deviations example ppt examples slides. This is a six stage process. The stages in this process are six sigma is a quality management system, six sigma is a set of techniques and tools for process improvement, it is a measure of quality that strives for near perfection, it is a disciplined data driven methodology focused on eliminating defects, it was a developed by bill smith at motorola in 1986, today it is used in many in industrial sectors for minimizing errors reduction of costs and increase in profit.
Process Of Six Sigma Powerpoint Slide Deck Samples
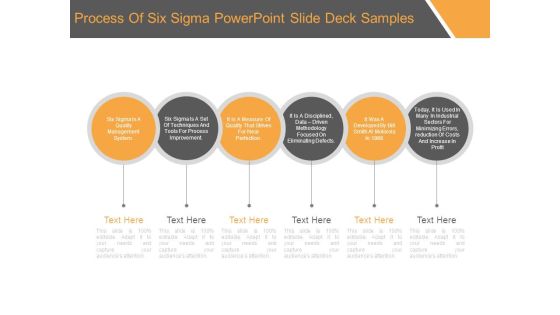
This is a process of six sigma powerpoint slide deck samples. This is a six stage process. The stages in this process are six sigma is a quality management system, six sigma is a set of techniques and tools for process improvement, it is a measure of quality that strives for near perfection, it is a disciplined, data driven methodology focused on eliminating defects, it was a developed by bill smith at motorola in 1986, today, it is used in many in industrial sectors for minimizing errors, reduction of costs and increase in profit.
Six Sigma Infographic Layout Presentation Visuals
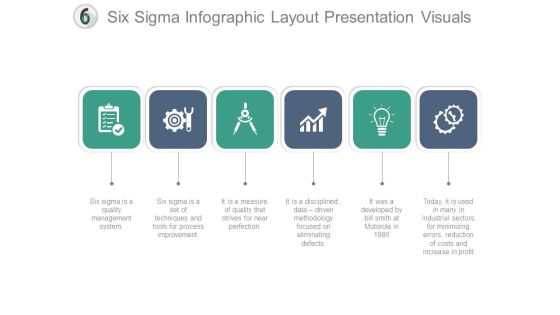
This is a six sigma infographic layout presentation visuals. This is a six stage process. The stages in this process are six sigma is a quality management system, six sigma is a set of techniques and tools for process improvement, it is a measure of quality that strives for near perfection, it is a disciplined, data driven methodology focused on eliminating defects, it was a developed by bill smith at motorola in 1986, today, it is used in many in industrial sectors for minimizing errors, reduction of costs and increase in profit.

Dashboard Showcasing Portfolio Fund Investment Analysis Portfolio Investment Analysis Designs PDF
This slide represents metric dashboard for investment analysis for portfolio management. It covers portfolio value, cost ratio, dividend, allocation etc.Slidegeeks is one of the best resources for PowerPoint templates. You can download easily and regulate Dashboard Showcasing Portfolio Fund Investment Analysis Portfolio Investment Analysis Designs PDF for your personal presentations from our wonderful collection. A few clicks is all it takes to discover and get the most relevant and appropriate templates. Use our Templates to add a unique zing and appeal to your presentation and meetings. All the slides are easy to edit and you can use them even for advertisement purposes.
E Commerce Operations In B2b B2b Sales Performance Tracking Dashboard Icons PDF
This slide represents metric dashboard to track sales performance on e-commerce website. It cover performance indicators such as sales breakdown, order breakdown, recurring sales etc. Slidegeeks is one of the best resources for PowerPoint templates. You can download easily and regulate E Commerce Operations In B2b B2b Sales Performance Tracking Dashboard Icons PDF for your personal presentations from our wonderful collection. A few clicks is all it takes to discover and get the most relevant and appropriate templates. Use our Templates to add a unique zing and appeal to your presentation and meetings. All the slides are easy to edit and you can use them even for advertisement purposes.

Agricultural Business Company Profile Commodity Production Introduction PDF
This slide highlights the commodity and product branding which includes wheat, cotton, soya beans, corn, canola, and fertilizers with metric tone per year and processing and production location.Presenting Agricultural Business Company Profile Commodity Production Introduction PDF to provide visual cues and insights. Share and navigate important information on five stages that need your due attention. This template can be used to pitch topics like Commodity Production In addtion, this PPT design contains high resolution images, graphics, etc, that are easily editable and available for immediate download.

Food And Agro Company Outline Commodity Production Ppt Portfolio Shapes PDF
This slide highlights the commodity and product branding which includes wheat, cotton, soya beans, corn, canola, and fertilizers with metric tone per year and processing and production location. Presenting Food And Agro Company Outline Commodity Production Ppt Portfolio Shapes PDF to provide visual cues and insights. Share and navigate important information on five stages that need your due attention. This template can be used to pitch topics like Wheat, Cotton, Soya Beans, Corn, Fertilizers. In addtion, this PPT design contains high resolution images, graphics, etc, that are easily editable and available for immediate download.

Commodity Production Global Food Products Company Profile Demonstration PDF
This slide highlights the commodity and product branding which includes wheat, cotton, soya beans, corn, canola, and fertilizers with metric tone per year and processing and production location.Welcome to our selection of the Commodity Production Global Food Products Company Profile Demonstration PDF. These are designed to help you showcase your creativity and bring your sphere to life. Planning and Innovation are essential for any business that is just starting out. This collection contains the designs that you need for your everyday presentations. All of our PowerPoints are 100precent editable, so you can customize them to suit your needs. This multi-purpose template can be used in various situations. Grab these presentation templates today.

Business To Business Digital Channel Management B2B Sales Performance Tracking Dashboard Template PDF
This slide represents metric dashboard to track sales performance on e-commerce website. It cover performance indicators such as sales breakdown, order breakdown, recurring sales etc. Take your projects to the next level with our ultimate collection of Business To Business Digital Channel Management B2B Sales Performance Tracking Dashboard Template PDF. Slidegeeks has designed a range of layouts that are perfect for representing task or activity duration, keeping track of all your deadlines at a glance. Tailor these designs to your exact needs and give them a truly corporate look with your own brand colors they will make your projects stand out from the rest.

The Fishbone Analysis Tool Table Of Contents Ppt Styles Background Designs PDF
Presenting the fishbone analysis tool table of contents ppt styles background designs pdf to provide visual cues and insights. Share and navigate important information on seven stages that need your due attention. This template can be used to pitch topics like measurement system, sources variation, effect analysis, machine, environment, table contents. In addtion, this PPT design contains high-resolution images, graphics, etc, that are easily editable and available for immediate download.

Engineering Team Target Chart Powerpoint Show
This is a engineering team target chart powerpoint show. This is a four stage process. The stages in this process are areas of focus, result, metric, area.

Strategic Product Management And Positioning Model Professional PDF
This slide illustrates strategic framework for market positioning and management of a brand. It includes establishing brand positioning, implementing marketing programs, evaluating brand performance etc. Presenting Strategic Product Management And Positioning Model Professional PDF to dispense important information. This template comprises four stages. It also presents valuable insights into the topics including Implementing Marketing Programs, Evaluating Brand Performance, Sustaining Brand Equity. This is a completely customizable PowerPoint theme that can be put to use immediately. So, download it and address the topic impactfully.

Business Website Role In Branding Ppt Powerpoint Ideas
This is a business website role in branding ppt powerpoint ideas. This is a five stage process. The stages in this process are content development, marketing strategies, analysis and adjustment, track and measure, implementation, social media marketing.

Disciplinary Action Strategy Diagram Ppt Slide Templates
This is a disciplinary action strategy diagram ppt slide templates. This is a four stage process. The stages in this process are cap complete and testing resume, equipment needed, green tree failed metric, develop corrective action plan.
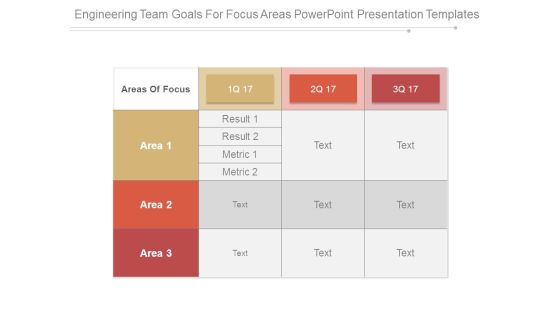
Engineering Team Goals For Focus Areas Powerpoint Presentation Templates
This is a engineering team goals for focus areas powerpoint presentation templates. This is a three stage process. The stages in this process are areas of focus, area, result, metric.
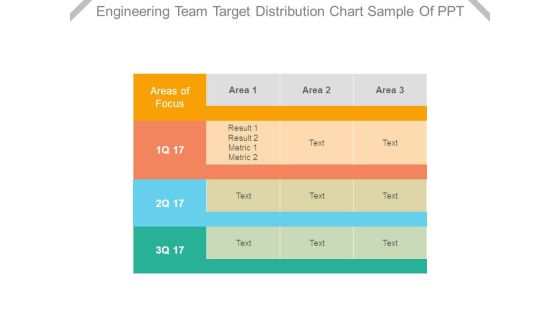
Engineering Team Target Distribution Chart Sample Of Ppt
This is a engineering team target distribution chart sample of ppt. This is a three stage process. The stages in this process are areas of focus, area, result, metric.
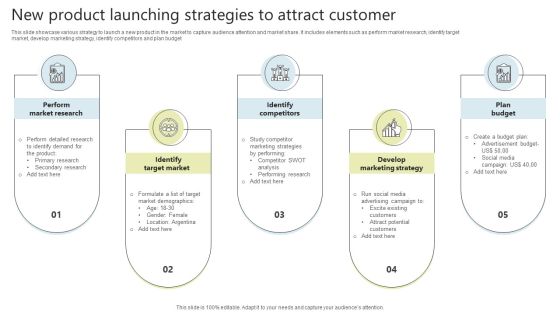
New Product Launching Strategies To Attract Customer Inspiration PDF
This slide showcase various strategy to launch a new product in the market to capture audience attention and market share. It includes elements such as perform market research, identify target market, develop marketing strategy, identify competitors and plan budget. Presenting New Product Launching Strategies To Attract Customer Inspiration PDF to dispense important information. This template comprises five stages. It also presents valuable insights into the topics including Perform Market Research, Identify Target Market, Identify Competitors . This is a completely customizable PowerPoint theme that can be put to use immediately. So, download it and address the topic impactfully.

Cyber Security For Your Organization Impact Analysis Implementing Cybersecurity Framework Ppt Model Background PDF
Presenting this set of slides with name cyber security for your organization impact analysis implementing cybersecurity framework ppt model background pdf. This is a one stage process. The stages in this process are csf metric, controls met, trend, target, current, state, performance . This is a completely editable PowerPoint presentation and is available for immediate download. Download now and impress your audience.

Strategies To Mitigate Cyber Security Risks Impact Analysis Implementing Cybersecurity Framework Mockup PDF
Presenting this set of slides with name strategies to mitigate cyber security risks impact analysis implementing cybersecurity framework mockup pdf. This is a one stage process. The stages in this process are controls met, csf metric, recover, respond, detect, protect, identify. This is a completely editable PowerPoint presentation and is available for immediate download. Download now and impress your audience.

Crm To Measure The Effectiveness Of Communication Diagram Design
This is a crm to measure the effectiveness of communication diagram design. This is a nine stage process. The stages in this process are customer satisfaction, customer return rate, reducing costs, measure roi of marketing, effective marketing campaigns, customer service, customer intelligence, sales force effectiveness, effective staff.
