Marketing Calendar
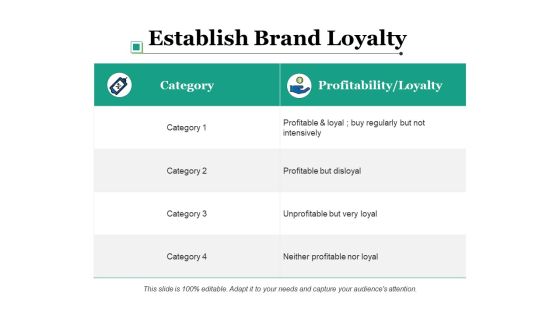
Establish Brand Loyalty Ppt PowerPoint Presentation Pictures Example
This is a establish brand loyalty ppt powerpoint presentation pictures example. This is a two stage process. The stages in this process are establish brand loyalty, business, planning, marketing, management.

Projects And Assignments Bar Graph Ppt Sample Download
This is a projects and assignments bar graph ppt sample download. This is a five stage process. The stages in this process are business, process, marketing, strategy, graph chart, management.
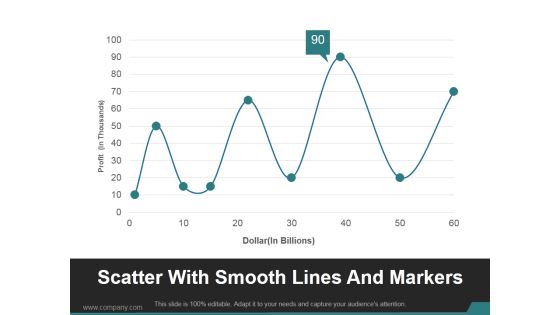
Scatter With Smooth Lines And Markers Ppt PowerPoint Presentation Show
This is a scatter with smooth lines and markers ppt powerpoint presentation show. This is a nine stage process. The stages in this process are business, marketing, line chart, profit, management.

Stacked Line With Markers Ppt PowerPoint Presentation Sample
This is a stacked line with markers ppt powerpoint presentation sample. This is a one stage process. The stages in this process are business, marketing, growth, management, line chart.

Crm Dashboard This Year Sales Vs Last Year Sales Ppt PowerPoint Presentation Professional Display
This is a crm dashboard this year sales vs last year sales ppt powerpoint presentation professional display. This is a two stage process. The stages in this process are area chart, growth, management, marketing, business, strategy.
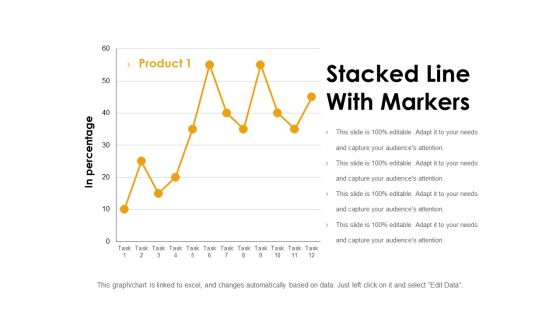
Stacked Line With Markers Ppt PowerPoint Presentation Inspiration Graphics Pictures
This is a stacked line with markers ppt powerpoint presentation inspiration graphics pictures. This is a one stage process. The stages in this process are in percentage, growth, business, marketing, chart.
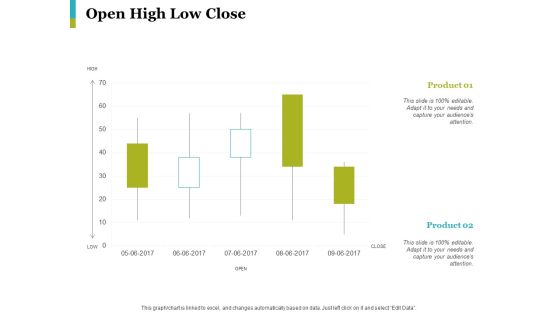
Open High Low Close Ppt PowerPoint Presentation Styles Graphics Example
This is a open high low close ppt powerpoint presentation styles graphics example.This is a two stage process. The stages in this process are product, percentage, chart, management, marketing.
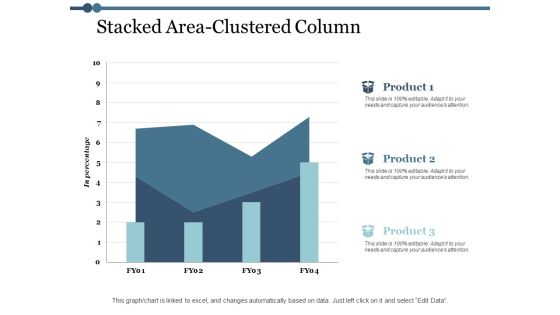
Stacked Area Clustered Column Ppt PowerPoint Presentation Model Topics
This is a stacked area clustered column ppt powerpoint presentation model topics. This is a three stage process. The stages in this process are area chart, finance, marketing, management, investment.

Pie Business Analysis Ppt Powerpoint Presentation Model Graphics
This is a pie business analysis ppt powerpoint presentation model graphics. This is a four stage process. The stages in this process are pie chart, percentage, marketing, business, analysis.

Brand Tracking Info Graphics Ppt PowerPoint Presentation Portfolio Sample
This is a brand tracking info graphics ppt powerpoint presentation portfolio sample. This is a four stage process. The stages in this process are business, marketing, finance, strategy, planning.

Brand Personality Ppt PowerPoint Presentation Complete Deck With Slides
This is a brand personality ppt powerpoint presentation complete deck with slides. This is a one stage process. The stages in this process are brand personality, business, marketing, planning, strategy.

Trade Branding Ppt PowerPoint Presentation Complete Deck With Slides
This is a trade branding ppt powerpoint presentation complete deck with slides. This is a one stage process. The stages in this process are trade branding, business, planning, marketing, management.

5 Level Bar Graph For Analysis With Icons Ppt PowerPoint Presentation Shapes
This is a 5 level bar graph for analysis with icons ppt powerpoint presentation shapes. This is a five stage process. The stages in this process are business, strategy, marketing, icons, growth, management.
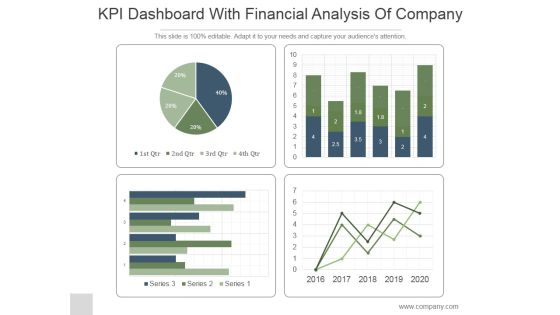
KPI Dashboard With Financial Analysis Of Company Ppt PowerPoint Presentation Backgrounds
This is a kpi dashboard with financial analysis of company ppt powerpoint presentation backgrounds. This is a four stage process. The stages in this process are business, strategy, marketing, line graph, finance.
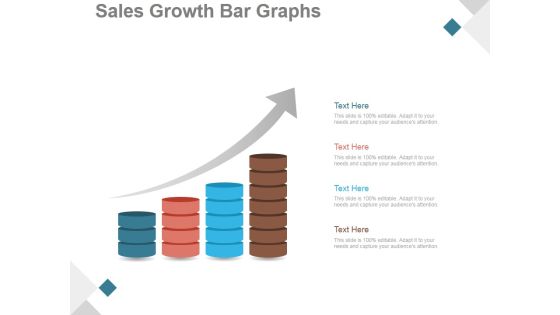
Sales Growth Bar Graphs Ppt PowerPoint Presentation Images
This is a sales growth bar graphs ppt powerpoint presentation images. This is a four stage process. The stages in this process are business, strategy, marketing, growth, bar graph, sales management.

Bar Graph For Descriptive Analysis Ppt PowerPoint Presentation Shapes
This is a bar graph for descriptive analysis ppt powerpoint presentation shapes. This is a five stage process. The stages in this process are icons, business, marketing, management, process.

Client Referrals Ppt PowerPoint Presentation Example 2015
This is a client referrals ppt powerpoint presentation example 2015. This is a three stage process. The stages in this process are business, marketing, management, bar graph, line bar.
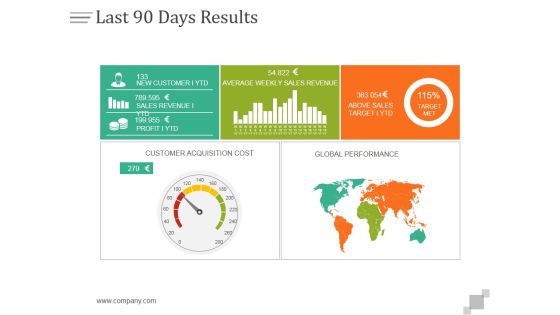
Last 90 Days Results Ppt PowerPoint Presentation Layouts
This is a last 90 days results ppt powerpoint presentation layouts. This is a five stage process. The stages in this process are business, finance, marketing, strategy, analysis, success.

Gross Margin Improvement Ppt PowerPoint Presentation Guidelines
This is a gross margin improvement ppt powerpoint presentation guidelines. This is a two stage process. The stages in this process are business, bar graph, investment, marketing, strategy, success.
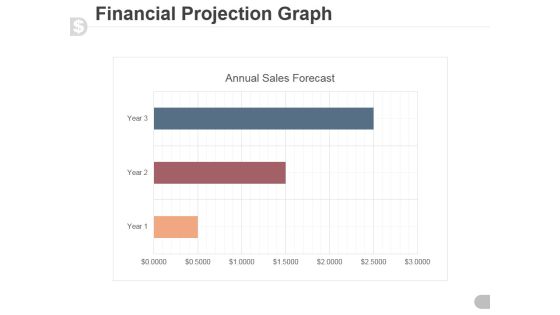
Financial Projection Graph Template 2 Ppt PowerPoint Presentation Samples
This is a financial projection graph template 2 ppt powerpoint presentation samples. This is a three stage process. The stages in this process are annual sales forecast, timeline, marketing, graph, management.
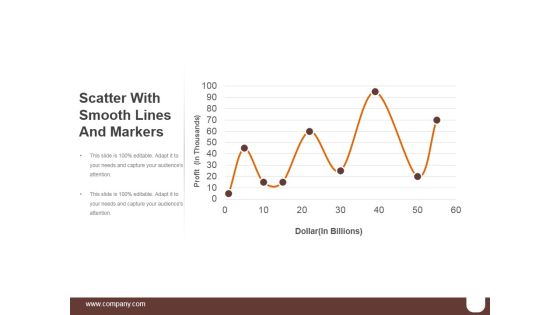
Scatter With Smooth Lines And Markers Ppt PowerPoint Presentation Ideas
This is a scatter with smooth lines and markers ppt powerpoint presentation ideas. This is a seven stage process. The stages in this process are business, marketing, percentage, success, finance.

Data Collection Scatter Diagram Ppt PowerPoint Presentation Good
This is a data collection scatter diagram ppt powerpoint presentation good. This is a three stage process. The stages in this process are product, business, marketing, finance, data collection.
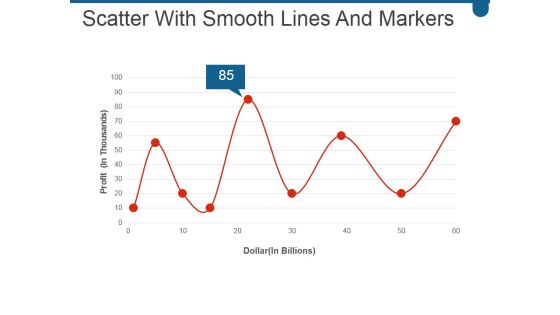
Scatter With Smooth Lines And Markers Ppt PowerPoint Presentation Professional Visual Aids
This is a scatter with smooth lines and markers ppt powerpoint presentation professional visual aids. This is a nine stage process. The stages in this process are business, marketing, success, growth, line.

Bar Graph Ppt PowerPoint Presentation Gallery Infographic Template
This is a bar graph ppt powerpoint presentation gallery infographic template. This is a five stage process. The stages in this process are business, marketing, analysis, strategy, bar graph.

Revenue Split By Product Segment Ppt PowerPoint Presentation Ideas Graphics
This is a revenue split by product segment ppt powerpoint presentation ideas graphics. This is a four stage process. The stages in this process are business, marketing, bar graph, success.

Organic Visits And Backlinks Ppt PowerPoint Presentation Inspiration Example Introduction
This is a Organic Visits And Backlinks Ppt PowerPoint Presentation Inspiration Example Introduction. This is a two stage process. The stages in this process are Business, Marketing, Finance, Success, Growth.
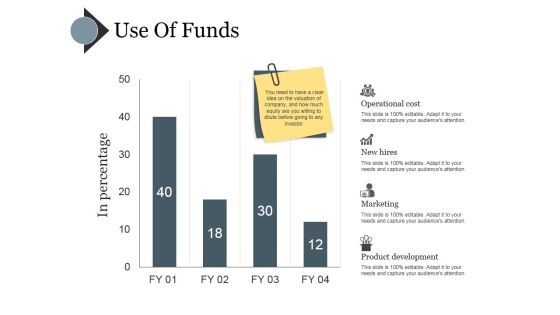
Use Of Funds Ppt PowerPoint Presentation Portfolio Clipart
This is a use of funds ppt powerpoint presentation portfolio clipart. This is a four stage process. The stages in this process are operational cost, new hires, marketing, product development.

Stacked Line With Marker Ppt PowerPoint Presentation Infographics Images
This is a stacked line with marker ppt powerpoint presentation infographics images. This is a twelve stage process. The stages in this process are business, marketing, strategy, finance, success.

Competitors Analysis Template Ppt PowerPoint Presentation Infographic Template Rules
This is a competitors analysis template ppt powerpoint presentation infographic template rules. This is a four stage process. The stages in this process are net profit margin, finance, marketing, bar, success.

Competitors Analysis Ppt PowerPoint Presentation Inspiration Layout Ideas
This is a competitors analysis ppt powerpoint presentation inspiration layout ideas. This is a four stage process. The stages in this process are cost of goods sold, bar, finance, business, marketing, success.

Revenue Split By Product Segment Template 1 Ppt PowerPoint Presentation Summary Example
This is a revenue split by product segment template 1 ppt powerpoint presentation summary example. This is a four stage process. The stages in this process are bar, business, marketing, finance, analysis.
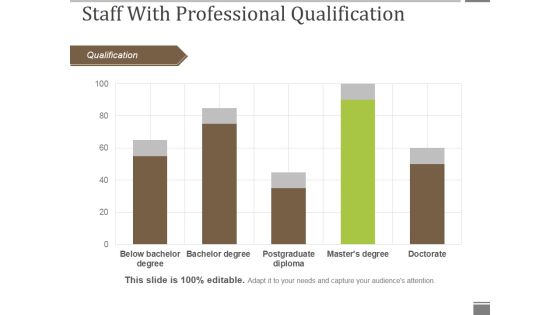
Staff With Professional Qualification Ppt PowerPoint Presentation Gallery Graphics Pictures
This is a staff with professional qualification ppt powerpoint presentation gallery graphics pictures. This is a five stage process. The stages in this process are qualification, bar graph, business, marketing, success.

Workforce Diversity By Age Group Ppt PowerPoint Presentation Visual Aids Gallery
This is a workforce diversity by age group ppt powerpoint presentation visual aids gallery. This is a three stage process. The stages in this process are by age group, bar graph, business, marketing, presentation.
Workforce Diversity By Region Ppt PowerPoint Presentation Icon Graphics Pictures
This is a workforce diversity by region ppt powerpoint presentation icon graphics pictures. This is a four stage process. The stages in this process are by region, bar graph, business, presentation, marketing.

Current Staff Profile Years Of Experience Ppt PowerPoint Presentation File Graphics Tutorials
This is a current staff profile years of experience ppt powerpoint presentation file graphics tutorials. This is a four stage process. The stages in this process are business, marketing, strategy, finance, bar.
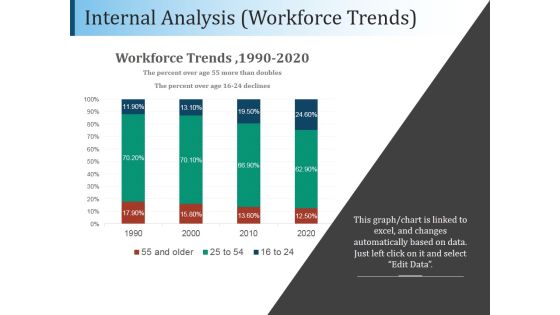
Internal Analysis Workforce Trends Ppt PowerPoint Presentation Example
This is a internal analysis workforce trends ppt powerpoint presentation example. This is a four stage process. The stages in this process are workforce trends, business, marketing, bar, finance.
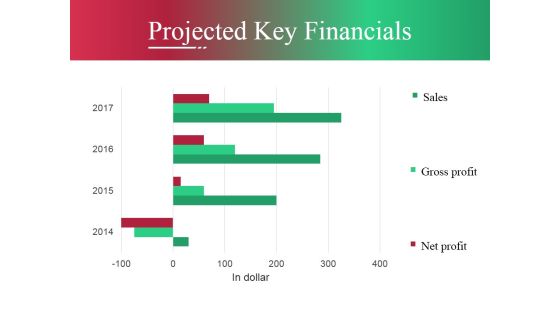
Projected Key Financials Ppt PowerPoint Presentation Pictures Master Slide
This is a projected key financials ppt powerpoint presentation pictures master slide. This is a three stage process. The stages in this process are business, marketing, line, graph, success.

Bar Graph Template 1 Ppt PowerPoint Presentation Slides Format Ideas
This is a bar graph template 1 ppt powerpoint presentation slides format ideas. This is a three stage process. The stages in this process are product, years, bar graph, business, marketing.

Stacked Column Ppt PowerPoint Presentation Professional Template
This is a stacked column ppt powerpoint presentation professional template. This is a nine stage process. The stages in this process are product, profit million dollars, business, marketing, graph.

Stacked Line With Marker Ppt PowerPoint Presentation Professional Pictures
This is a stacked line with marker ppt powerpoint presentation professional pictures. This is a twelve stage process. The stages in this process are product, profit in thousands, business, graph, marketing.
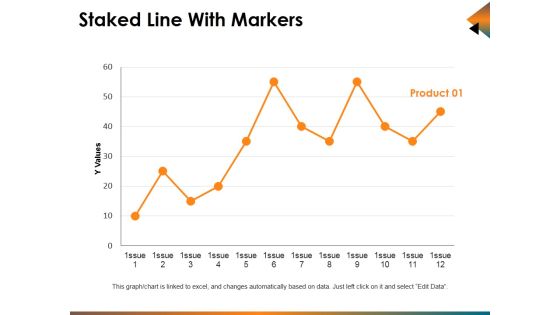
Staked Line With Markers Ppt PowerPoint Presentation Infographics Show
This is a staked line with markers ppt powerpoint presentation infographics show. This is a one stage process. The stages in this process are business, marketing, finance, line, analysis.

Stacked Bar Ppt PowerPoint Presentation Infographic Template Infographic Template
This is a stacked bar ppt powerpoint presentation infographic template infographic template. This is a four stage process. The stages in this process are business, marketing, finance, slide bar, graph.
Stacked Line With Markers Ppt PowerPoint Presentation Icon Format
This is a stacked line with markers ppt powerpoint presentation icon format. This is a three stage process. The stages in this process are business, marketing, finance, line, graph.

Customer Acquisition Cost By Channel Template 1 Ppt PowerPoint Presentation Portfolio Mockup
This is a customer acquisition cost by channel template 1 ppt powerpoint presentation portfolio mockup. This is a five stage process. The stages in this process are finance, business, graph, online, marketing.
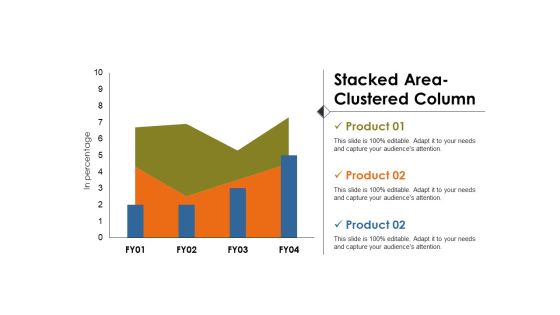
Stacked Area Clustered Column Ppt PowerPoint Presentation Summary Gallery
This is a stacked area clustered column ppt powerpoint presentation summary gallery. This is a three stage process. The stages in this process are in percentage, business, marketing, growth, strategy.
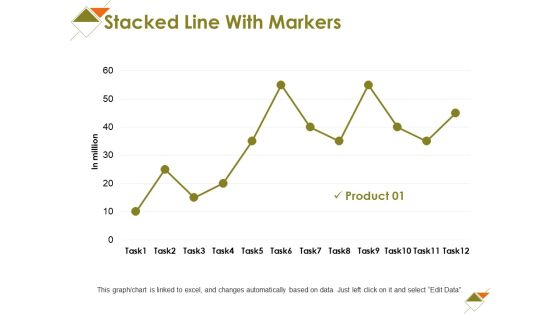
Stacked Line With Markers Ppt PowerPoint Presentation Model Graphic Images
This is a stacked line with markers ppt powerpoint presentation model graphic images. This is a one stage process. The stages in this process are business, marketing, graph, strategy, in millions.

Competitor Revenue And Profit Template Ppt PowerPoint Presentation Model Design Inspiration
This is a competitor revenue and profit template ppt powerpoint presentation model design inspiration. This is a five stage process. The stages in this process are business, marketing, graph, success, growth.

Competitor Revenue And Profit Template 1 Ppt PowerPoint Presentation Professional Example File
This is a competitor revenue and profit template 1 ppt powerpoint presentation professional example file. This is a five stage process. The stages in this process are business, finance, marketing, strategy, analysis, growth.
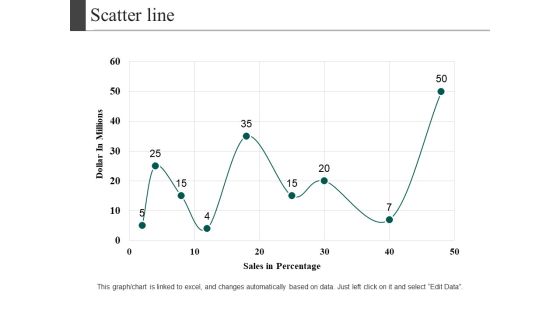
Scatter Line Ppt PowerPoint Presentation Visual Aids Diagrams
This is a scatter line ppt powerpoint presentation visual aids diagrams. This is a one stage process. The stages in this process are dollar in millions, sales in percentage, growth, business, marketing.
Sales Performance Of Competitors Ppt PowerPoint Presentation Show Icon
This is a sales performance of competitors ppt powerpoint presentation show icon. This is a three stage process. The stages in this process are own business, competitor, year, business, marketing.

Inventory Ratios Template 1 Ppt PowerPoint Presentation Gallery Master Slide
This is a inventory ratios template 1 ppt powerpoint presentation gallery master slide. This is a two stage process. The stages in this process are finance, marketing, analysis, business, investment, inventory ratios.
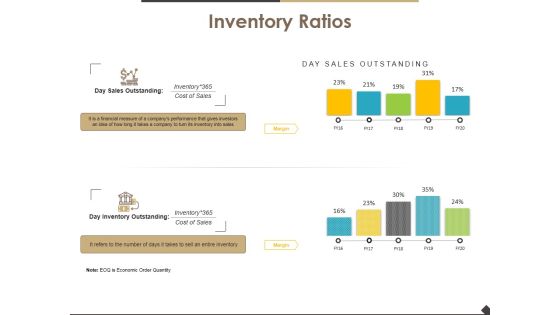
Inventory Ratios Template 2 Ppt PowerPoint Presentation Slide
This is a inventory ratios template 2 ppt powerpoint presentation slide. This is a two stage process. The stages in this process are finance, marketing, analysis, business, investment, inventory ratios.

Operating Efficiency Ratios Template 1 Ppt PowerPoint Presentation Layouts Introduction
This is a operating efficiency ratios template 1 ppt powerpoint presentation layouts introduction. This is a two stage process. The stages in this process are operating efficiency ratios, finance, marketing, strategy, business.
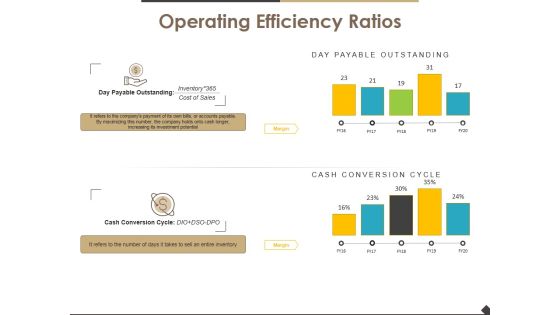
Operating Efficiency Ratios Template 2 Ppt PowerPoint Presentation Infographic Template Guide
This is a operating efficiency ratios template 2 ppt powerpoint presentation infographic template guide. This is a two stage process. The stages in this process are operating efficiency ratios, finance, marketing, strategy, business.

Activity Ratios Template 2 Ppt PowerPoint Presentation Show Slides
This is a activity ratios template 2 ppt powerpoint presentation show slides. This is a two stage process. The stages in this process are business, management, analysis, finance, marketing.
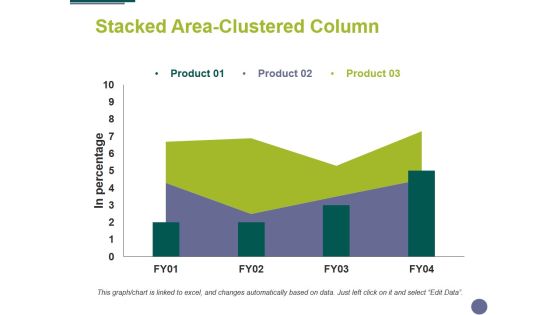
Stacked Area Clustered Column Ppt PowerPoint Presentation Ideas Objects
This is a stacked area clustered column ppt powerpoint presentation ideas objects. This is a three stage process. The stages in this process are finance, marketing, analysis, business, strategy.

Activity Ratios Template 1 Ppt PowerPoint Presentation Icon File Formats
This is a activity ratios template 1 ppt powerpoint presentation icon file formats. This is a two stage process. The stages in this process are finance, analysis, compere, business, marketing.

Activity Ratios Template 2 Ppt PowerPoint Presentation Model Design Inspiration
This is a activity ratios template 2 ppt powerpoint presentation model design inspiration. This is a two stage process. The stages in this process are finance, analysis, compere, business, marketing.

Capital Expenditure Details Fy 18 Ppt PowerPoint Presentation Diagram Images
This is a capital expenditure details fy 18 ppt powerpoint presentation diagram images. This is a six stage process. The stages in this process are business, finance, analysis, strategy, marketing.

Capex Summary Template 2 Ppt PowerPoint Presentation Inspiration Samples
This is a capex summary template 2 ppt powerpoint presentation inspiration samples. This is a four stage process. The stages in this process are finance, marketing, business, analysis, strategy.


 Continue with Email
 Sign up for an account
 Home
Home


