Marketing Calendar
What If Modelling Hexagon Chart Powerpoint Slide Graphics
This is a what if modelling hexagon chart powerpoint slide graphics. This is a three stage process. The stages in this process are what if modelling.

Corporate Over View Three Steps Chart Ppt Icon
This is a corporate over view three steps chart ppt icon. This is a three stage process. The stages in this process are value, vision, mission.

Vision And Mission Triangle Chart Ppt Background Graphics
This is a vision and mission triangle chart ppt background graphics. This is a three stage process. The stages in this process are mission, value, vision.
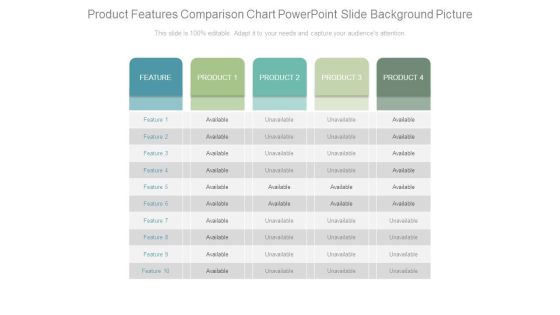
Product Features Comparison Chart Powerpoint Slide Background Picture
This is a product features comparison chart powerpoint slide background picture. This is a four stage process. The stages in this process are feature, product, available, unavailable.
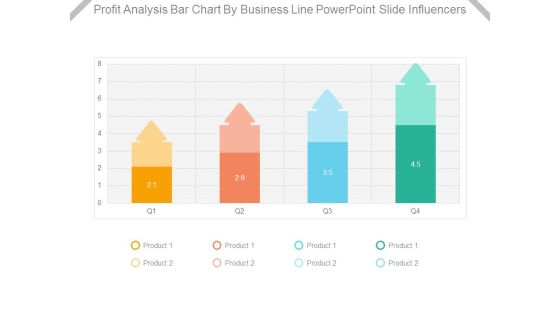
Profit Analysis Bar Chart By Business Line Powerpoint Slide Influencers
This is a profit analysis bar chart by business line powerpoint slide influencers. This is a four stage process. The stages in this process are product.

Vision And Mission Statement Chart Ppt PowerPoint Presentation Deck
This is a vision and mission statement chart ppt powerpoint presentation deck. This is a three stage process. The stages in this process are mission, vision, value.
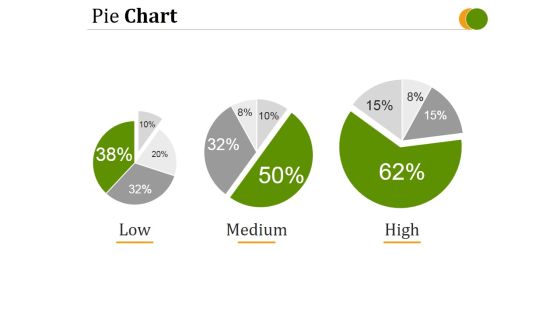
Pie Chart Template 1 Ppt PowerPoint Presentation Deck
This is a pie chart template 1 ppt powerpoint presentation deck. This is a three stage process. The stages in this process are low, medium, high.
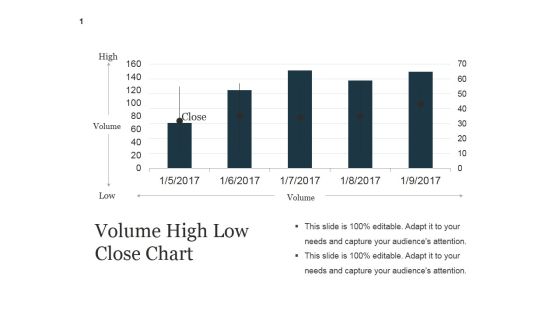
Volume High Low Close Chart Ppt PowerPoint Presentation Guide
This is a volume high low close chart ppt powerpoint presentation guide. This is a five stage process. The stages in this process are high, volume, close, low.
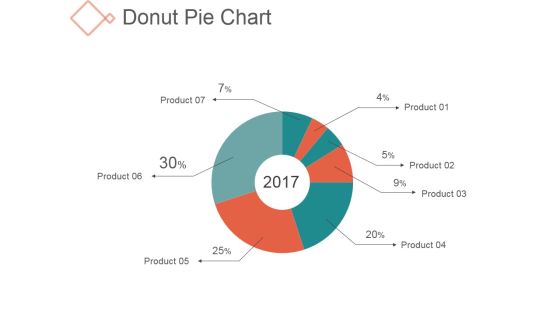
Donut Pie Chart Ppt PowerPoint Presentation Background Images
This is a donut pie chart ppt powerpoint presentation background images. This is a seven stage process. The stages in this process are management, business, finance, percentage.

Line Chart Ppt PowerPoint Presentation Model Example File
This is a line chart ppt powerpoint presentation model example file. This is a two stage process. The stages in this process are product, graph, growth, management.
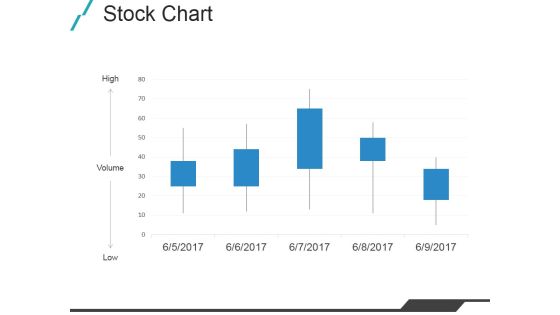
Stock Chart Ppt PowerPoint Presentation Outline Slide Portrait
This is a stock chart ppt powerpoint presentation outline slide portrait. This is a five stage process. The stages in this process are high, volume, low, business.

Stock Chart Ppt PowerPoint Presentation Infographic Template Clipart Images
This is a stock chart ppt powerpoint presentation infographic template clipart images. This is a five stage process. The stages in this process are high, volume, low, close.

Scatter Chart Ppt PowerPoint Presentation Portfolio Design Inspiration
This is a scatter chart ppt powerpoint presentation portfolio design inspiration. This is a twelve stage process. The stages in this process are graph, growth, success, business.

Bar Chart Ppt PowerPoint Presentation Styles Graphics Example
This is a bar chart ppt powerpoint presentation styles graphics example. This is a nine stage process. The stages in this process are graph, growth, success, business, finance.

Column Chart Ppt PowerPoint Presentation Portfolio Graphics Template
This is a column chart ppt powerpoint presentation portfolio graphics template. This is a six stage process. The stages in this process are product, finance, growth, success, business.

Combo Chart Ppt PowerPoint Presentation Professional Graphics Example
This is a combo chart ppt powerpoint presentation professional graphics example. This is a eight stage process. The stages in this process are product, finance, growth, success, business.

Combo Chart Ppt Powerpoint Presentation Infographic Template File Formats
This is a combo chart ppt powerpoint presentation infographic template file formats. This is a four stage process. The stages in this process are product, growth, management, business.

Stock Chart Ppt PowerPoint Presentation Summary Background Designs
This is a stock chart ppt powerpoint presentation summary background designs. This is a five stage process. The stages in this process are high, volume, low.

Stock Chart Ppt PowerPoint Presentation Summary Graphics Pictures
This is a stock chart ppt powerpoint presentation summary graphics pictures. This is a five stage process. The stages in this process are high, volume, low, close, finance.

Column Chart Ppt PowerPoint Presentation Infographic Template Layouts
This is a column chart ppt powerpoint presentation infographic template layouts. This is a nine stage process. The stages in this process are product, growth, success, business, graph.
Stock Chart Ppt PowerPoint Presentation Icon Graphic Images
This is a stock chart ppt powerpoint presentation icon graphic images. This is a five stage process. The stages in this process are high, volume, low, close.
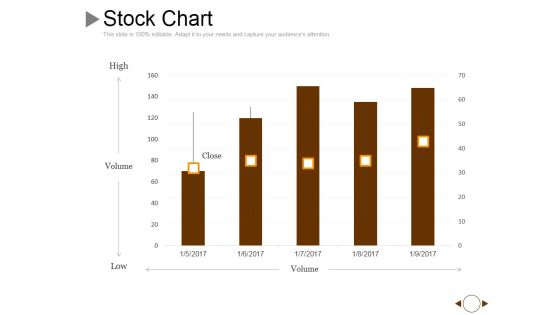
Stock Chart Ppt PowerPoint Presentation Gallery Graphics Example
This is a stock chart ppt powerpoint presentation gallery graphics example. This is a five stage process. The stages in this process are volume, high, low, close.
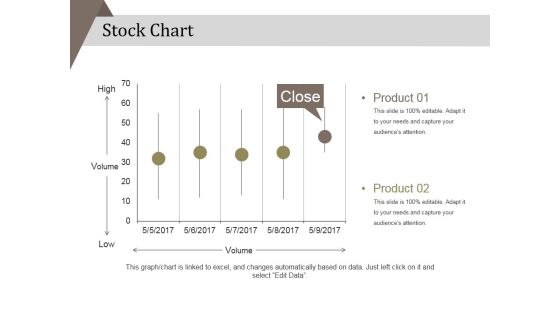
Stock Chart Ppt PowerPoint Presentation Portfolio Background Designs
This is a stock chart ppt powerpoint presentation portfolio background designs. This is a five stage process. The stages in this process are product, high, low .

Donut Pie Chart Ppt PowerPoint Presentation Outline Graphics Example
This is a donut pie chart ppt powerpoint presentation outline graphics example. This is a five stage process. The stages in this process are percentage, finance, donut, business.

Line Chart Ppt PowerPoint Presentation Visual Aids Inspiration
This is a line chart ppt powerpoint presentation visual aids inspiration. This is a two stage process. The stages in this process are product, profit, growth, decline, success.

Column Chart Ppt PowerPoint Presentation Inspiration Design Ideas
This is a column chart ppt powerpoint presentation inspiration design ideas. This is a nine stage process. The stages in this process are product, growth, success, graph, business.

High Low Close Chart Ppt PowerPoint Presentation Infographics Templates
This is a high low close chart ppt powerpoint presentation infographics templates. This is a nine stage process. The stages in this process are high, volume, low, close.

Donut Pie Chart Ppt PowerPoint Presentation Show Topics
This is a donut pie chart ppt powerpoint presentation show topics. This is a three stage process. The stages in this process are percentage, finance, donut, business.
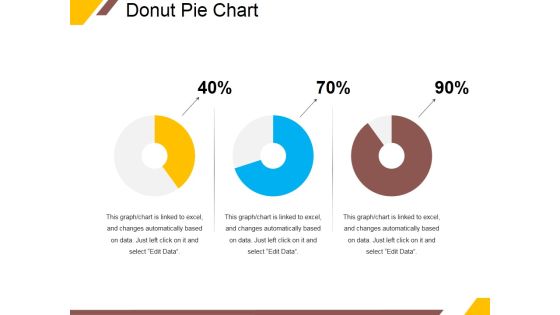
Donut Pie Chart Ppt PowerPoint Presentation Ideas Portrait
This is a donut pie chart ppt powerpoint presentation ideas portrait. This is a three stage process. The stages in this process are percentage, finance, donut, business.

Continuous Growth Curve Chart Ppt PowerPoint Presentation Inspiration Slideshow
This is a continuous growth curve chart ppt powerpoint presentation inspiration slideshow. This is a six stage process. The stages in this process are circular, continuity, continuum.

Eight Stages Sequential Function Chart Ppt PowerPoint Presentation Slides Graphics
This is a eight stages sequential function chart ppt powerpoint presentation slides graphics. This is a eight stage process. The stages in this process are circular, continuity, continuum.
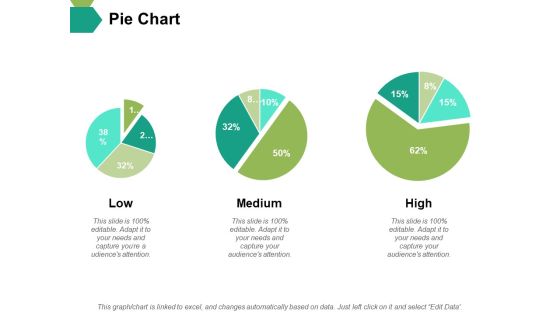
Pie Chart Ppt PowerPoint Presentation Slides Master Slide
This is a pie chart ppt powerpoint presentation slides master slide. This is a three stage process. The stages in this process are pie, process, percentage, finance, business.
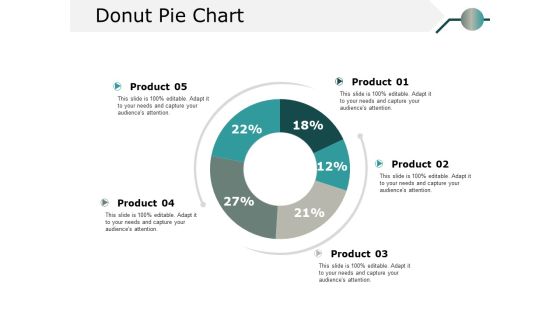
Donut Pie Chart Ppt PowerPoint Presentation Model Information
This is a donut pie chart ppt powerpoint presentation model information. This is a five stage process. The stages in this process are percentage, product, business.

Donut Pie Chart Ppt PowerPoint Presentation Model Outline
This is a donut pie chart ppt powerpoint presentation model outline. This is a four stage process. The stages in this process are percentage, product, business.
Direct Sales Lead Ppt Powerpoint Presentation Diagram Graph Charts Cpb
This is a direct sales lead ppt powerpoint presentation diagram graph charts cpb. This is a two stage process. The stages in this process are direct sales lead.
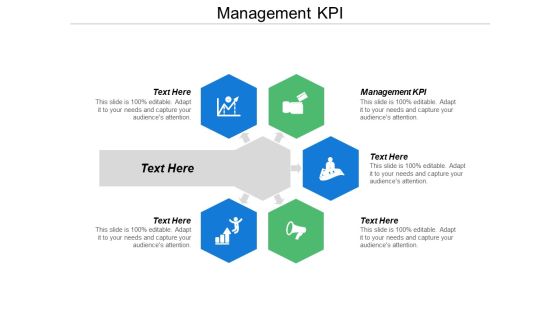
Management Kpi Ppt Powerpoint Presentation Diagram Graph Charts Cpb
This is a management kpi ppt powerpoint presentation diagram graph charts cpb. This is a five stage process. The stages in this process are management kpi.
Project Management Gantt Chart Graph Ppt PowerPoint Presentation Styles Icon
This is a project management gantt chart graph ppt powerpoint presentation styles icon. This is a four stage process. The stages in this process are four.

Data Protection Flow Chart For Business Safety Ppt PowerPoint Presentation Icon Example File PDF
Persuade your audience using this data protection flow chart for business safety ppt powerpoint presentation icon example file pdf. This PPT design covers one stages, thus making it a great tool to use. It also caters to a variety of topics including access network, traffic mirroring, access. Download this PPT design now to present a convincing pitch that not only emphasizes the topic but also showcases your presentation skills.

Project Flow Chart Ppt PowerPoint Presentation Show Backgrounds Cpb
Presenting this set of slides with name project flow chart ppt powerpoint presentation show backgrounds cpb. This is a seven stage process. The stages in this process are project flow chart. This is a completely editable PowerPoint presentation and is available for immediate download. Download now and impress your audience.
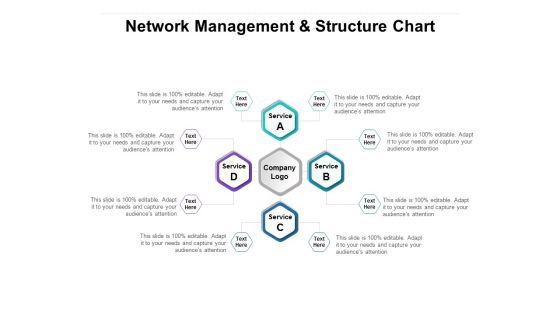
Network Management And Structure Chart Ppt PowerPoint Presentation Inspiration Templates
Presenting this set of slides with name network management and structure chart ppt powerpoint presentation inspiration templates. This is a four stage process. The stages in this process are network management, structure chart. This is a completely editable PowerPoint presentation and is available for immediate download. Download now and impress your audience.

Employee Termination Process Flow Chart Ppt PowerPoint Presentation Graphics Cpb
Presenting this set of slides with name employee termination process flow chart ppt powerpoint presentation graphics cpb. This is a six stage process. The stages in this process are employee termination process flow chart. This is a completely editable PowerPoint presentation and is available for immediate download. Download now and impress your audience.

Chart Showing Quarterly Business Growth Ppt PowerPoint Presentation Show Objects
Presenting this set of slides with name chart showing quarterly business growth ppt powerpoint presentation show objects. This is a four stage process. The stages in this process are chart showing quarterly business growth. This is a completely editable PowerPoint presentation and is available for immediate download. Download now and impress your audience.

Portfolio Comparison Chart Template Ppt PowerPoint Presentation Styles Templates PDF
Presenting this set of slides with name portfolio comparison chart template ppt powerpoint presentation styles templates pdf. This is a three stage process. The stages in this process are business portfolio, portfolio comparison, chart template. This is a completely editable PowerPoint presentation and is available for immediate download. Download now and impress your audience.
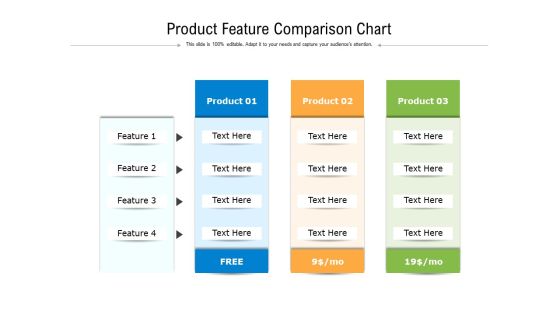
Product Feature Comparison Chart Ppt PowerPoint Presentation Styles Format PDF
Presenting this set of slides with name product feature comparison chart ppt powerpoint presentation styles format pdf. This is a three stage process. The stages in this process are product feature comparison chart. This is a completely editable PowerPoint presentation and is available for immediate download. Download now and impress your audience.
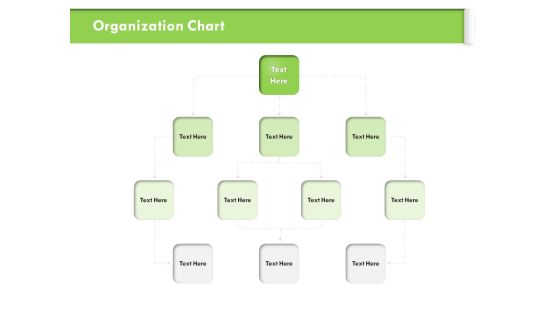
Understanding Organizational Structures Organization Chart Ppt Pictures Microsoft PDF
Presenting this set of slides with name understanding organizational structures organization chart ppt pictures microsoft pdf. This is a four stage process. The stages in this process are organization chart. This is a completely editable PowerPoint presentation and is available for immediate download. Download now and impress your audience.
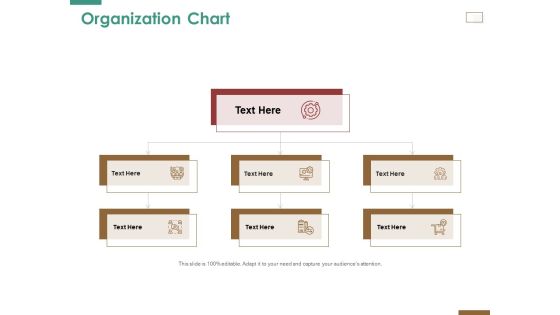
Successful Strategy Implementation Process Organization Organization Chart Microsoft PDF
Presenting this set of slides with name successful strategy implementation process organization organization chart microsoft pdf. This is a three stage process. The stages in this process are organization chart. This is a completely editable PowerPoint presentation and is available for immediate download. Download now and impress your audience.

Business Broken Process Flow Chart Ppt PowerPoint Presentation Information PDF
Presenting this set of slides with name business broken process flow chart ppt powerpoint presentation information pdf. This is a one stage process. The stage in this process is business broken process flow chart. This is a completely editable PowerPoint presentation and is available for immediate download. Download now and impress your audience.
Test Driven Workflow Chart Ppt PowerPoint Presentation File Icon PDF
Presenting this set of slides with name test driven workflow chart ppt powerpoint presentation file icon pdf. This is a one stage process. The stage in this process is test driven workflow chart. This is a completely editable PowerPoint presentation and is available for immediate download. Download now and impress your audience.
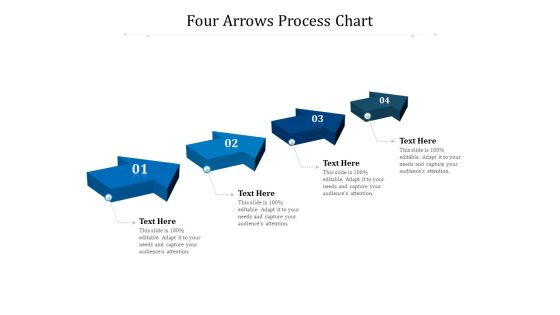
Four Arrows Process Chart Ppt PowerPoint Presentation File Shapes PDF
Presenting this set of slides with name four arrows process chart ppt powerpoint presentation file shapes pdf. This is a four stage process. The stages in this process are four arrows process chart. This is a completely editable PowerPoint presentation and is available for immediate download. Download now and impress your audience.

Employee Bonus Circular Chart Ppt PowerPoint Presentation Gallery Styles PDF
Presenting this set of slides with name employee bonus circular chart ppt powerpoint presentation gallery styles pdf. This is a six stage process. The stages in this process are employee bonus circular chart. This is a completely editable PowerPoint presentation and is available for immediate download. Download now and impress your audience.

Unconventional Monetary Policy Organization Chart Ppt Outline Graphic Images PDF
This is a unconventional monetary policy organization chart ppt outline graphic images pdf template with various stages. Focus and dispense information on four stages using this creative set, that comes with editable features. It contains large content boxes to add your information on topics like organization chart. You can also showcase facts, figures, and other relevant content using this PPT layout. Grab it now.

Business Strategies Management Board Organization Chart Ppt Outline Deck PDF
Presenting business strategies management board organization chart ppt outline deck pdf to provide visual cues and insights. Share and navigate important information on three stages that need your due attention. This template can be used to pitch topics like management board organization chart. In addtion, this PPT design contains high resolution images, graphics, etc, that are easily editable and available for immediate download.
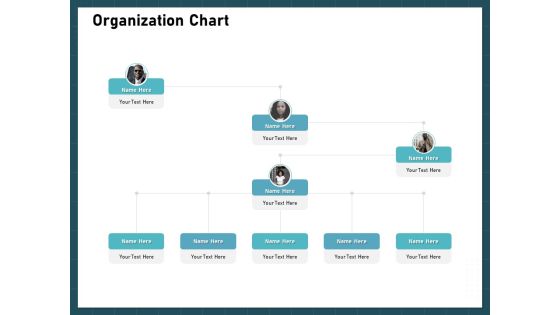
Strategies To Win Customers From Competitors Organization Chart Microsoft PDF
This is a strategies to win customers from competitors organization chart microsoft pdf template with various stages. Focus and dispense information on four stages using this creative set, that comes with editable features. It contains large content boxes to add your information on topics like organization chart. You can also showcase facts, figures, and other relevant content using this PPT layout. Grab it now.
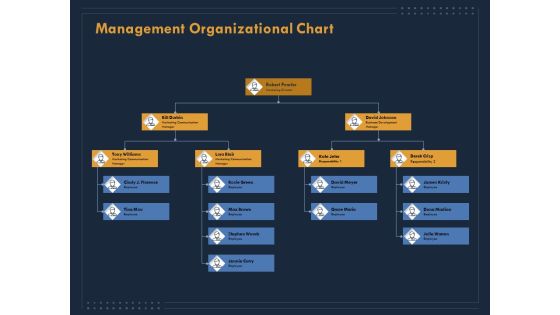
Enterprise Review Management Organizational Chart Ppt Styles Guide PDF
This is a enterprise review management organizational chart ppt styles guide pdf template with various stages. Focus and dispense information on six stages using this creative set, that comes with editable features. It contains large content boxes to add your information on topics like management organizational chart. You can also showcase facts, figures, and other relevant content using this PPT layout. Grab it now.
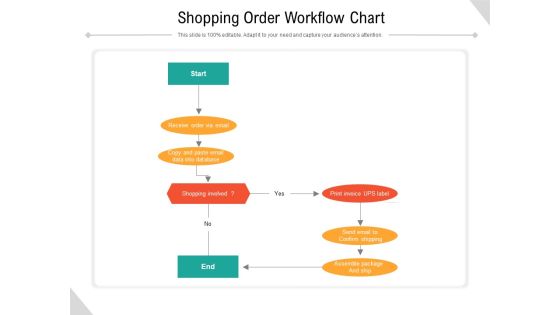
Shopping Order Workflow Chart Ppt PowerPoint Presentation File Designs PDF
Presenting shopping order workflow chart ppt powerpoint presentation file designs pdf to dispense important information. This template comprises one stages. It also presents valuable insights into the topics including shopping order workflow chart. This is a completely customizable PowerPoint theme that can be put to use immediately. So, download it and address the topic impactfully.
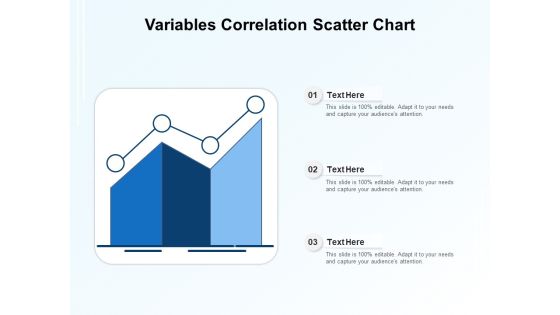
Variables Correlation Scatter Chart Ppt PowerPoint Presentation Model Smartart PDF
Presenting variables correlation scatter chart ppt powerpoint presentation model smartart pdf to dispense important information. This template comprises three stages. It also presents valuable insights into the topics including variables correlation scatter chart. This is a completely customizable PowerPoint theme that can be put to use immediately. So, download it and address the topic impactfully.
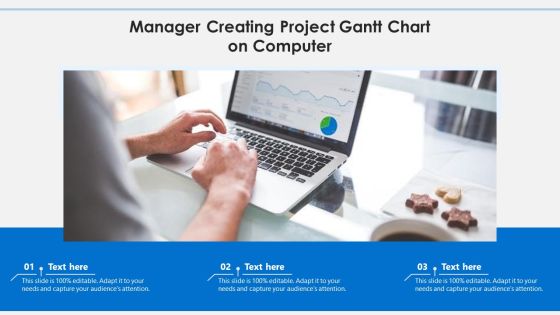
Manager Creating Project Gantt Chart On Computer Guidelines PDF
Presenting manager creating project gantt chart on computer guidelines pdf to dispense important information. This template comprises three stages. It also presents valuable insights into the topics including manager creating project gantt chart on computer. This is a completely customizable PowerPoint theme that can be put to use immediately. So, download it and address the topic impactfully.

Concentric Sphere Chart Slide For Comparison Ppt Portfolio Inspiration PDF
Presenting concentric sphere chart slide for comparison ppt portfolio inspiration pdf to dispense important information. This template comprises four stages. It also presents valuable insights into the topics including concentric sphere chart slide for comparison. This is a completely customizable PowerPoint theme that can be put to use immediately. So, download it and address the topic impactfully.

Business Objective Presentation Chart Of Provenance Data Download PDF
Presenting business objective presentation chart of provenance data download pdf to dispense important information. This template comprises five stages. It also presents valuable insights into the topics including business objective presentation chart of provenance data. This is a completely customizable PowerPoint theme that can be put to use immediately. So, download it and address the topic impactfully.

Statistical Data Analysis Chart Of Collected Data Formats PDF
Presenting statistical data analysis chart of collected data formats pdf to dispense important information. This template comprises four stages. It also presents valuable insights into the topics including statistical data analysis chart of collected data. This is a completely customizable PowerPoint theme that can be put to use immediately. So, download it and address the topic impactfully.

Bar Chart Icon For Financial Ratios Comparison Elements PDF
Presenting bar chart icon for financial ratios comparison elements pdf to dispense important information. This template comprises four stages. It also presents valuable insights into the topics including bar chart icon for financial ratios comparison. This is a completely customizable PowerPoint theme that can be put to use immediately. So, download it and address the topic impactfully.

Chart Comparison Icon For Financial Ratios Template PDF
Persuade your audience using this chart comparison icon for financial ratios template pdf. This PPT design covers three stages, thus making it a great tool to use. It also caters to a variety of topics including chart comparison icon for financial ratios. Download this PPT design now to present a convincing pitch that not only emphasizes the topic but also showcases your presentation skills.

Chart Icon For Price To Earning Financial Ratios Professional PDF
Presenting chart icon for price to earning financial ratios professional pdf to dispense important information. This template comprises four stages. It also presents valuable insights into the topics including chart icon for price to earning financial ratios. This is a completely customizable PowerPoint theme that can be put to use immediately. So, download it and address the topic impactfully.
Price Catalogue Chart Icon Of Product Comparison Slides PDF
Presenting price catalogue chart icon of product comparison slides pdf to dispense important information. This template comprises three stages. It also presents valuable insights into the topics including price catalogue chart icon of product comparison. This is a completely customizable PowerPoint theme that can be put to use immediately. So, download it and address the topic impactfully.
Team Capacity Improvement Plan Outline Ppt Styles Slide PDF
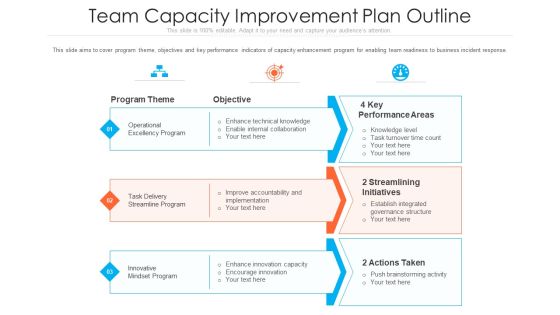
This slide aims to cover program theme, objectives and key performance indicators of capacity enhancement program for enabling team readiness to business incident response. Presenting team capacity improvement plan outline ppt styles slide pdf to provide visual cues and insights. Share and navigate important information on three stages that need your due attention. This template can be used to pitch topics like performance areas, innovative, implementation. In addtion, this PPT design contains high resolution images, graphics, etc, that are easily editable and available for immediate download.
Steps To Build A Journey Map Ppt PowerPoint Presentation Show Good
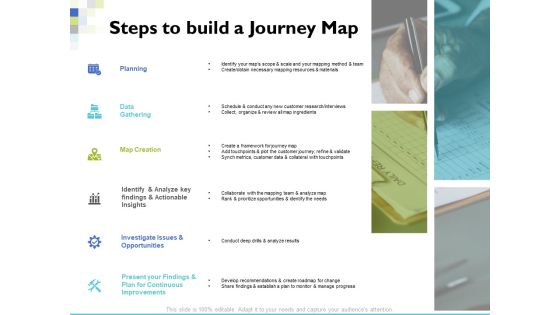
Presenting this set of slides with name steps to build a journey map ppt powerpoint presentation show good. This is a six stage process. The stages in this process are planning, data gathering, map creation, identify and analyze key findings, actionable insights, investigate issues, opportunities, present your findings and plan for continuous improvements. This is a completely editable PowerPoint presentation and is available for immediate download. Download now and impress your audience.

Stock Photo Corporate Business Strategy 50 Percentage Pie Chart Images
Extract admiration from the audience. Create a forceful impact with our stock photo corporate business strategy 50 percentage pie chart images. Force doors open with our finance. The audience will decide to let your thoughts enter.

Business Diagram Consultant Client Work Effort Matrix Chart Presentation Template
This business diagram displays two directional multistage triangles. This slide contains the concept of work effort. This business slide depicts the work efforts matrix chart for client work efforts. Use this diagram to build exclusive presentation for your viewers.

Business Diagram Sales Conversion Funnel Chart Presentation Template
This power point template slide has been crafted with graphic of funnel chart. This PPT diagram contains the concept of sales conversion. Use this PPT diagram for business and sales related presentations.
Four Stopwatches In Pie Chart Style Powerpoint Slides
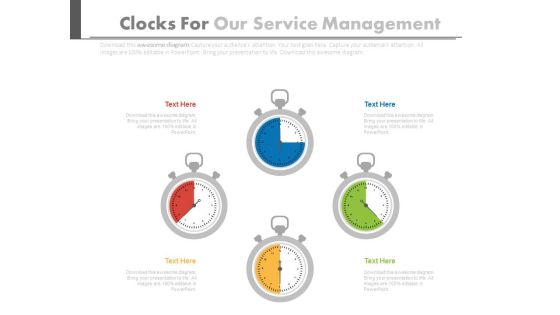
This PPT slide has been designed with graphics of four stop watches in pie chart style. You may sue this PowerPoint template for time management. This dashboard slide may useful for multilevel status report creation and approval process.
Pie Chart Dashboard Style For Percentage Analysis Powerpoint Slides
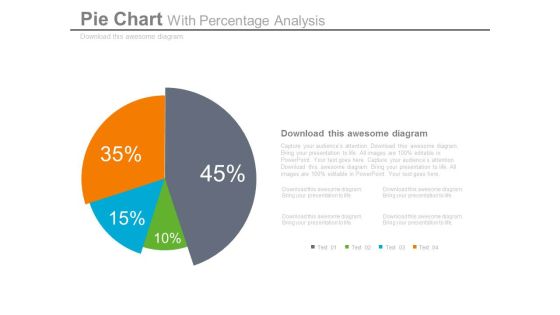
This dashboard PPT template contains graphics of pie chart. This dashboard PowerPoint template helps to display percentage analysis in a visual manner. Download this PPT slide for quick decision-making.
Pie Chart With Icons For Business Analysis Powerpoint Slides
This dashboard template contains graphics of pie chart with icons. This dashboard PowerPoint template helps to display business analysis in a visual manner. Download this template to make impressive presentations.
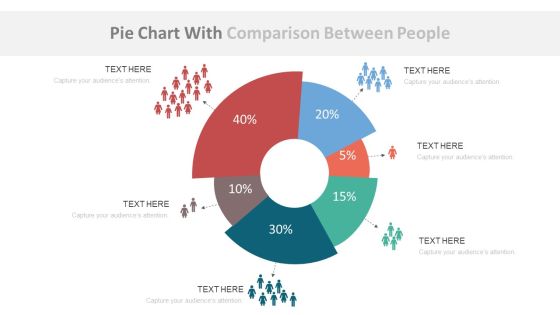
Pie Chart With Population Ratio Analysis Powerpoint Slides
This dashboard template contains graphics of pie chart with icons. This dashboard PowerPoint template helps to display population ratio analysis in a visual manner. Download this template to make impressive presentations.

Gears With Arrows Activity Flow Chart Powerpoint Template
This PowerPoint slide contains gears arrow business design. This professional slide may be used as activity flow chart. Use this template to highlight the key issues of your presentation.
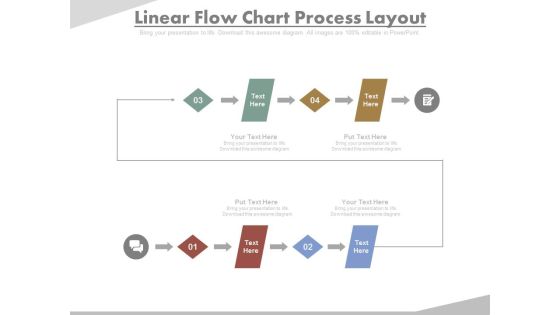
Four Steps In Linear Flow Chart Powerpoint Slides
This PowerPoint template contains design of four steps flow chart. You may download this slide to display workflow and processes. You can easily customize this template to make it more unique as per your need.
Five Staged Process Chart And Icons Powerpoint Template
Develop competitive advantage with our above template which contains a five staged process chart with icons. This diagram provides an effective way of displaying business information. You can edit text, color, shade and style as per you need.

Circular Arrow Chart With Business Icons Powerpoint Slides
Graphics of circular arrow chart with icons have been displayed in this business slide. This business diagram helps to exhibit strategy analysis and management. Use this PowerPoint template to visually support your content.
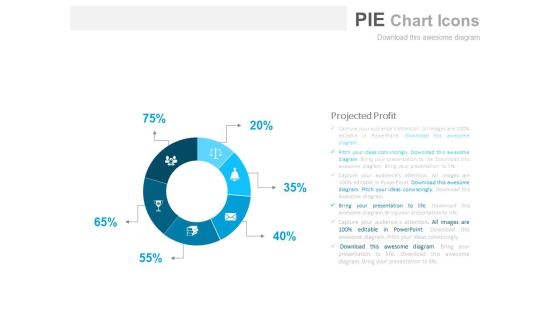
Pie Chart For Projected Profit Report Powerpoint Slides
This PowerPoint template has been designed with diagram of pie chart. This PPT slide can be used to prepare presentations for projected profit report. You can download finance PowerPoint template to prepare awesome presentations.
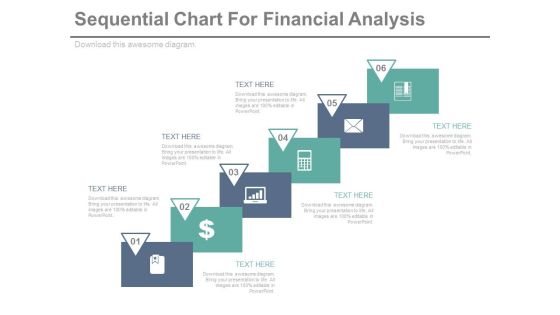
Sequential Steps Chart For Data Analysis Powerpoint Slides
This PowerPoint template has been designed sequential steps chart with icons. This PPT slide can be used to display corporate level financial strategy. You can download finance PowerPoint template to prepare awesome presentations.
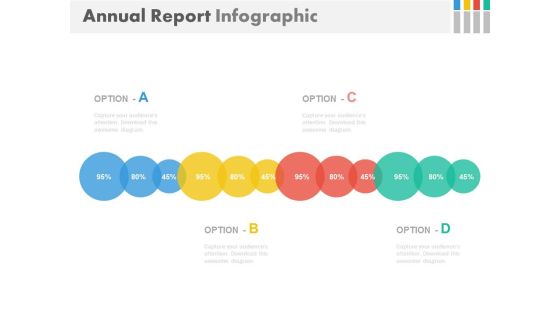
Linear Chart For Annual Business Report Powerpoint Slides
This PowerPoint template contains graphics of linear circle chart. You may download this PPT slide design to display annual business report. You can easily customize this template to make it more unique as per your need.

Two Table Charts For Business Data Powerpoint Slides
This PowerPoint template contains two tables chart. You may download this PPT slide to display statistical analysis. You can easily customize this template to make it more unique as per your need.
Linear Diamond Chart With Icons For Financial Progress Powerpoint Template
This PowerPoint template has been designed with linear diamond chart with icons. This diagram helps to exhibit financial progress. Present your views using this innovative slide and be assured of leaving a lasting impression.
Five Circles Linear Chart With Icons Powerpoint Slides
Visually support your presentation with our above template containing five circles linear chart with icons. This diagram slide may be used for comparing contrasting different business objects. Etch your views in the brains of your audience with this diagram slide.
Pie Chart With Seven Business Icons Powerpoint Templates
Our compelling template consists with a design of pie chart with seven business icons. This slide has been professionally designed to exhibit financial ratio analysis. This template offers an excellent background to build impressive presentation.

Circle Arrow Chart For Corporate Level Strategies Powerpoint Template
Our above business slide has been designed with circle arrow chart. This slide is suitable to present corporate level strategy. Use this business diagram to present your work in a more smart and precise manner.
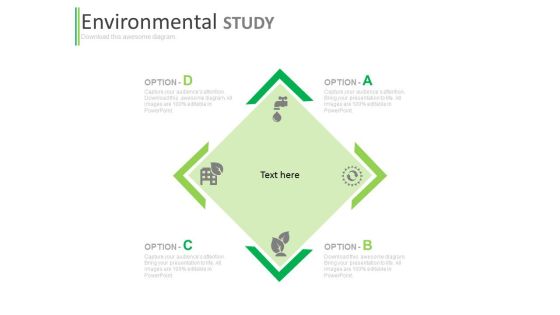
Four Options Chart For Environmental Study Powerpoint Template
Our above PPT slide contains graphics of four options chart. This PowerPoint template may be used for environmental study projects. Use this diagram to impart more clarity to subject and to create more sound impact on viewers.
Six Steps Business Chart With Icons Powerpoint Template
This PPT slide contains six steps business chart with icons. Download this diagram to display information in visual manner. Visual effect of this diagram helps in maintaining the flow of the discussion and provides more clarity to the subject.
Six Steps Spiral Chart With Business Icons Powerpoint Template
This PPT slide has been designed with graphics of six steps spiral chart with icons. This PowerPoint template is suitable to display business strategies and ideas. This professional slide helps in making an instant impact on viewers.
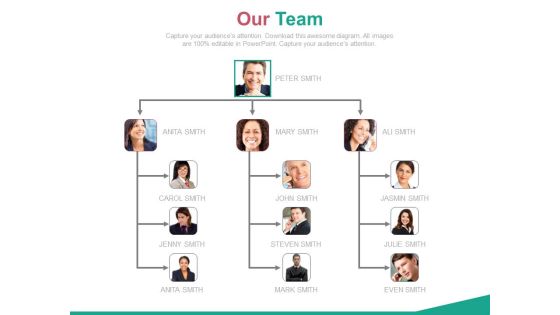
Organizational Chart For Business Intelligence Team Powerpoint Slides
Our above PowerPoint template displays an organizational chart with team pictures. This PPT slide may be used to display working of business intelligence team. You may download this PPT slide to present topics like team strategy and success.

Pie Charts For Percentage Value Analysis Powerpoint Slides
Our above PPT slide displays graphics of Pie charts. This PowerPoint template may be used to display percentage value analysis. Download this template to leave permanent impression on your audience.
Five Circles Sequential Chart With Icons Powerpoint Slides
This PowerPoint template contains sequential chart of five circles with icons. You may download this PPT slide to depict corporate vision, mission and strategy analysis. Add this slide to your presentation and impress your superiors.
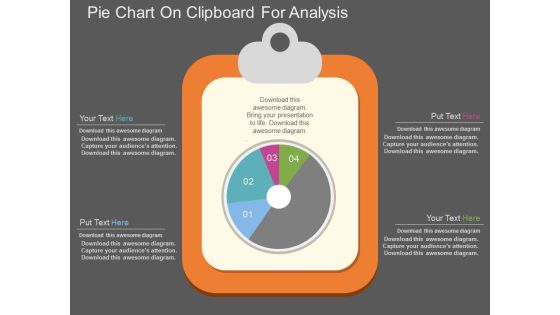
Pie Chart On Clipboard For Analysis Powerpoint Template
This PowerPoint template has been designed with graphics of pie chart on clipboard. Download this PPT slide for business and financial analysis. You may also use this professional template to depict statistical analysis.
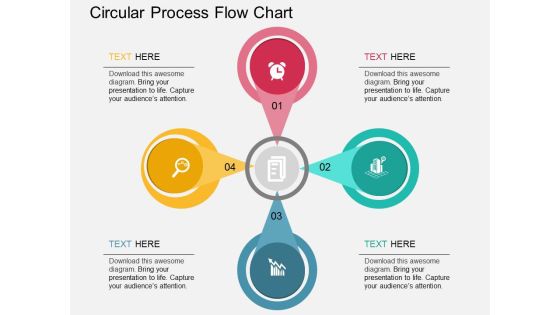
Four Staged Circular Process Flow Chart Powerpoint Template
This PowerPoint slide has been designed with graphics of four staged circular process flow chart. This diagram is designed to display four steps of option pricing. This professional slide helps in making an instant impact on viewers.
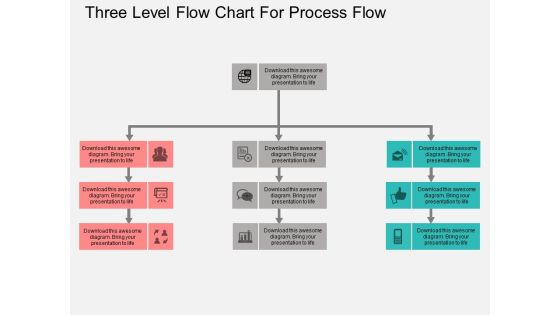
Three Level Flow Chart For Process Flow Powerpoint Template
Visually support your presentation with our above template of three level flow chart. This slide has been professionally designed to display business process flow. This template offers an excellent background to build impressive presentation.
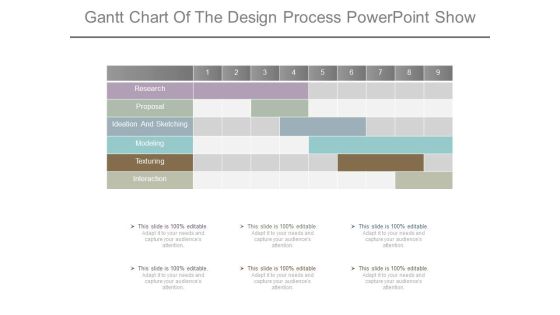
Gantt Chart Of The Design Process Powerpoint Show
This is a gantt chart of the design process powerpoint show. This is a one stage process. The stages in this process are research, proposal, ideation and sketching, modeling, texturing, interaction.

Bid Management Team Organization Chart Powerpoint Slide Ideas
This is a bid management team organization chart powerpoint slide ideas. This is a four stage process. The stages in this process are bid team, key bid team, bid manager, proof reader, support.

Approve Leads Flow Chart Powerpoint Slide Presentation Tips
This is a approve leads flow chart powerpoint slide presentation tips. This is a seven stage process. The stages in this process are awareness, interest, decision, action, permission, engagement, call to action.
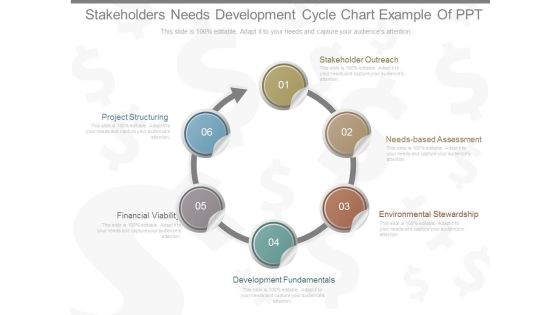
Stakeholders Needs Development Cycle Chart Example Of Ppt
This is a stakeholders needs development cycle chart example of ppt. This is a six stage process. The stages in this process are stakeholder outreach, needs based assessment, environmental stewardship,, development fundamentals, financial viability, project structuring.
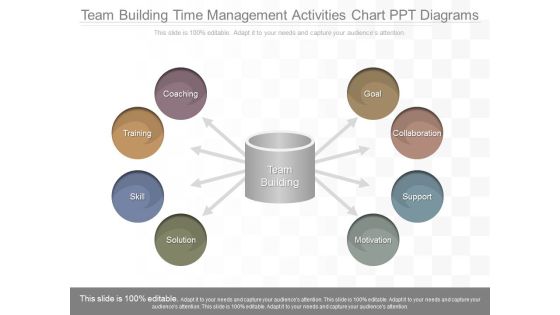
Team Building Time Management Activities Chart Ppt Diagrams
This is a team building time management activities chart ppt diagrams. This is a eight stage process. The stages in this process are goal, collaboration, support, motivation, solution, skill, training, coaching.

Corporate Structure And Organization Chart Development Ppt Powerpoint Guide
This is a corporate structure and organization chart development ppt powerpoint guide. This is a six stage process. The stages in this process are relationship, structure, purpose, mechanisms, rewards, leadership.

Economic Cooperation And Development Chart Powerpoint Slide Themes
This is a economic cooperation and development chart powerpoint slide themes. This is a five stage process. The stages in this process are partnership, participation, consultation, communication, identify, stakeholders.

Transformation Of Decision Making Process Chart Ppt Slides
This is a transformation of decision making process chart ppt slides. This is a six stage process. The stages in this process are problem classification, boundary conditions, building to action, problem definition, what is right, feedback.
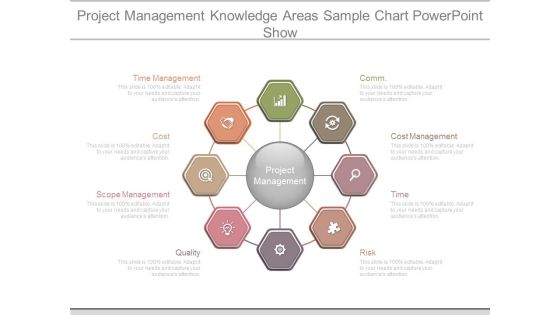
Project Management Knowledge Areas Sample Chart Powerpoint Show
This is a project management knowledge areas sample chart powerpoint show. This is a eight stage process. The stages in this process are comm, cost management, time, risk, quality, scope management, cost, time management, project management.

Flow Chart Of Rapid Prototyping Diagram Ppt Samples
This is a flow chart of rapid prototyping diagram ppt samples. This is a three stage process. The stages in this process are build prototype, prototype, refine and iterate.

Decision Support And Knowledge Based Systems Chart Powerpoint Images
This is a decision support and knowledge based systems chart powerpoint images. This is a eight stage process. The stages in this process are situation, operational management, tactical management, options, state problem, analyse, strategic management, action.
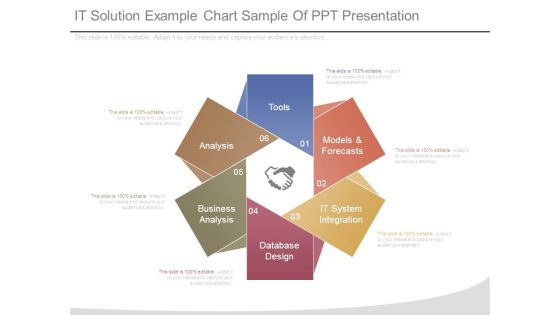
It Solution Example Chart Sample Of Ppt Presentation
This is a it solution example chart sample of ppt presentation. This is a six stage process. The stages in this process are tools, models and forecasts, it system integration, database design, business analysis, analysis.

Conversion Rate Optimization Flow Chart Diagram Powerpoint Slide
This is a conversion rate optimization flow chart diagram powerpoint slide. This is a four stage process. The stages in this process are measure, gather insights, from hypothesis, test, conversion rate optimization.

Enterprise Value Timing Factors Chart Ppt Examples Professional
This is a enterprise value timing factors chart ppt examples professional. This is a four stage process. The stages in this process are industry dynamics, company performance, organic growth, strategic acquisitions.
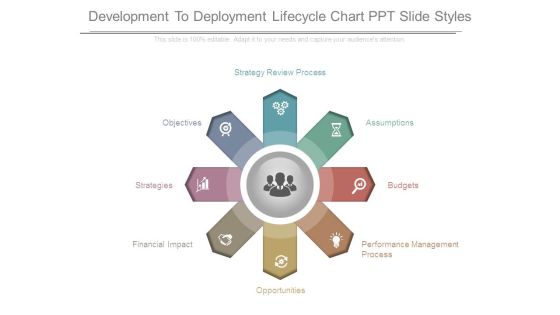
Development To Deployment Lifecycle Chart Ppt Slide Styles
This is a development to deployment lifecycle chart ppt slide styles. This is a eight stage process. The stages in this process are performance management process, opportunities, financial impact, strategies, objectives, strategy review process, assumptions, budgets.

Small Business Structure Chart Example Powerpoint Slide Background Image
This is a small business structure chart example powerpoint slide background image. This is a six stage process. The stages in this process are financial manager, sales, distributions, finance, operations, general manager.
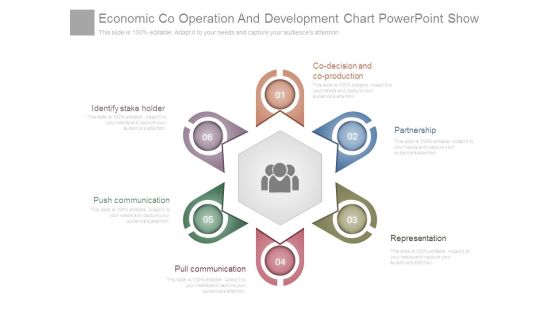
Economic Co Operation And Development Chart Powerpoint Show
This is a economic co operation and development chart powerpoint show. This is a six stage process. The stages in this process are co decision and co production, partnership, representation, pull communication, push communication, identify stake holder.
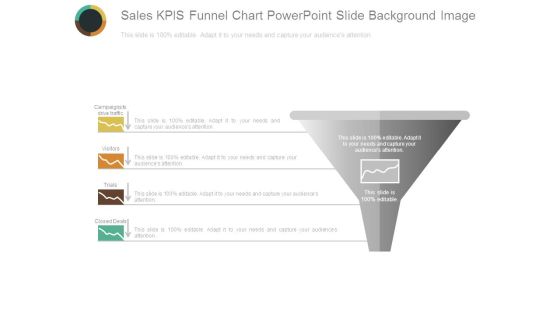
Sales Kpis Funnel Chart Powerpoint Slide Background Image
This is a sales kpis funnel chart powerpoint slide background image. This is a one stage process. The stages in this process are campaigns to drive traffic, visitors, trials, closed deals, sales.

And R Chart For Six Sigma Powerpoint Slide Background Designs
This is a and r chart for six sigma powerpoint slide background designs. This is a two stage process. The stages in this process are subtitle, option, lcl, ucl.

Kano Analysis Line Chart Powerpoint Slide Design Ideas
This is a kano analysis line chart powerpoint slide design ideas. This is a three stage process. The stages in this process are customer needs in the kano model, exciter, performance, basic, implementation level.

Portfolio Management Process Arrow Chart Powerpoint Slide Background Designs
This is a portfolio management process arrow chart powerpoint slide background designs. This is a five stage process. The stages in this process are define, analyze, measure, improve, control.
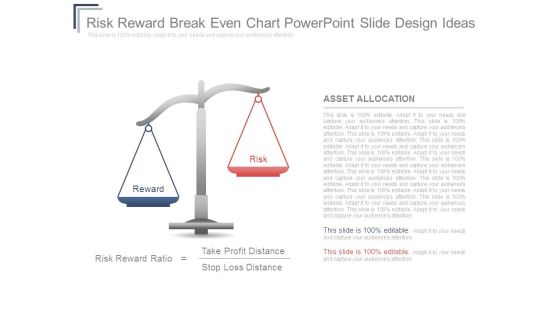
Risk Reward Breakeven Chart Powerpoint Slide Design Ideas
This is a risk reward breakeven chart powerpoint slide design ideas. This is a two stage process. The stages in this process are reward, risk, asset allocation, risk reward ratio, take profit distance, stop loss distance.
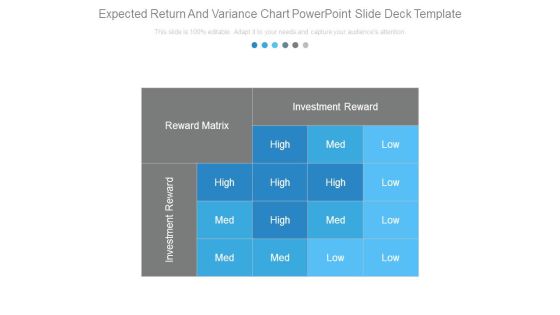
Expected Return And Variance Chart Powerpoint Slide Deck Template
This is a expected return and variance chart powerpoint slide deck template. This is a one stage process. The stages in this process are investment reward, reward matrix, high, med, low.

Investment Management Process Steps Arrow Chart Powerpoint Slide Backgrounds
This is a investment management process steps arrow chart powerpoint slide backgrounds. This is a five stage process. The stages in this process are define, analyze, control, measure, improve.

Corporate Strategy Hierarchy Chart Powerpoint Slide Presentation Tips
This is a corporate strategy hierarchy chart powerpoint slide presentation tips. This is a four stage process. The stages in this process are corporate strategy, business strategy, functional area strategies, operating strategies.

Curve Chart For Product Life Cycle Presentation Outline
This is a curve chart for product life cycle presentation outline. This is a five stage process. The stages in this process are sales over time, product extension, introduction, growth, maturity, decline, time.


 Continue with Email

 Home
Home


