Marketing Calendar

Combo Chart Ppt PowerPoint Presentation Summary Graphic Images
This is a combo chart ppt powerpoint presentation summary graphic images. This is a three stage process. The stages in this process are combo chart, product, growth, marketing, business.
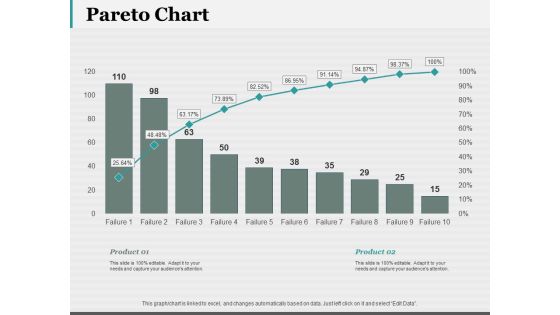
Pareto Chart Ppt PowerPoint Presentation Visual Aids Pictures
This is a pareto chart ppt powerpoint presentation visual aids pictures. This is a two stage process. The stages in this process are pareto chart, finance, marketing, strategy, business.

Bubble Chart Analysis Ppt PowerPoint Presentation Gallery Introduction
This is a bubble chart analysis ppt powerpoint presentation gallery introduction. This is a two stage process. The stages in this process are bubble chart, finance, marketing, strategy, business.

Combo Chart Process Ppt PowerPoint Presentation Model Clipart
This is a combo chart process ppt powerpoint presentation model clipart. This is a two stage process. The stages in this process are combo chart, finance, marketing, strategy, business.

donut pie chart investment ppt powerpoint presentation show guide
This is a donut pie chart investment ppt powerpoint presentation show guide. This is a four stage process. The stages in this process are donut pie chart, finance, marketing, business, analysis.

Area Chart Finance Ppt Powerpoint Presentation Slides Picture
This is a area chart finance ppt powerpoint presentation slides picture. This is a three stage process. The stages in this process are area chart, finance, marketing, management, investment.

Area Chart Finance Ppt Powerpoint Presentation Inspiration Example
This is a area chart finance ppt powerpoint presentation inspiration example. This is a three stage process. The stages in this process are area chart, finance, marketing, management, investment.

Area Chart Investment Ppt PowerPoint Presentation Gallery Example Introduction
This is a area chart investment ppt powerpoint presentation gallery example introduction. This is a three stage process. The stages in this process are area chart, finance, marketing, management, investment.

Area Chart Product Percentage Ppt PowerPoint Presentation Infographic Template Slide
This is a area chart product percentage ppt powerpoint presentation infographic template slide. This is a four stage process. The stages in this process are area chart, finance, marketing, management, investment.
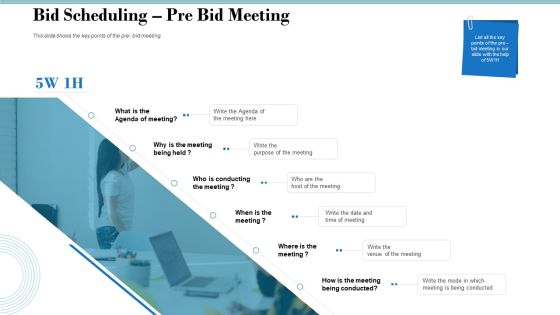
Tender Assessment Bid Scheduling Pre Bid Meeting Ppt Professional Samples PDF
This slide shows the key points of the pre bid meeting. This is a tender assessment bid scheduling pre bid meeting ppt professional samples pdf template with various stages. Focus and dispense information on six stages using this creative set, that comes with editable features. It contains large content boxes to add your information on topics like agenda of meeting, conducting the meeting, venue of the meeting. You can also showcase facts, figures, and other relevant content using this PPT layout. Grab it now.
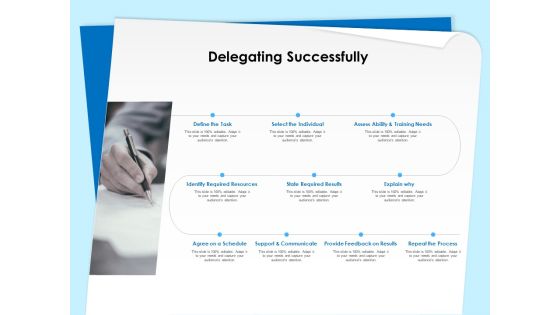
Executive Leadership Programs Delegating Successfully Ppt Outline Samples PDF
Presenting this set of slides with name executive leadership programs delegating successfully ppt outline samples pdf. This is a one stage process. The stages in this process are define task, select individual, assess ability and training needs, identify required resources, state required results, explain, agree schedule, support and communicate, provide feedback results, repeat process. This is a completely editable PowerPoint presentation and is available for immediate download. Download now and impress your audience.
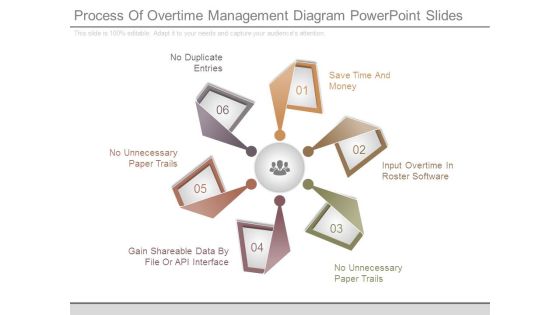
Process Of Overtime Management Diagram Powerpoint Slides
This is a process of overtime management diagram powerpoint slides. This is a six stage process. The stages in this process are no duplicate entries, no unnecessary paper trails, gain shareable data by file or api interface, save time and money, input overtime in roster software, no unnecessary paper trails.

Arrow Action Plan Ppt Slides
This is a arrow action plan ppt slides. This is a five stage process. The stages in this process are arrows, business, marketing, targets, success.
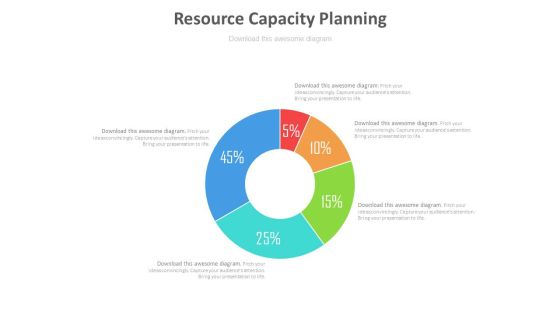
Resource Capacity Planning Ppt Slides
This is a resource capacity planning ppt slides. This is a five stage process. The stages in this process are business, finance, marketing.

Innovative Planning Diagram Ppt Infographics
This is a innovative planning diagram ppt infographics. This is a five stage process. The stages in this process are strategic, operations, marketing, financial, external impact.

Alternatives Planning Process Powerpoint Layout
This is a alternatives planning process powerpoint layout. This is a three stage process. The stages in this process are arrows, business, process, marketing, strategy.

Strategic Communication Plan Powerpoint Templates
This is a strategic communication plan powerpoint templates. This is a six stage process. The stages in this process are business, marketing, hexagon, process.

Company Future Planning Ppt Inspiration
This is a company future planning ppt inspiration. This is a five stage process. The stages in this process are target, business, marketing, arrows.

Filled Radar Ppt PowerPoint Presentation Layouts Graphics
This is a filled radar ppt powerpoint presentation layouts graphics. This is a two stage process. The stages in this process are business, marketing, product, radar chart, strategy.
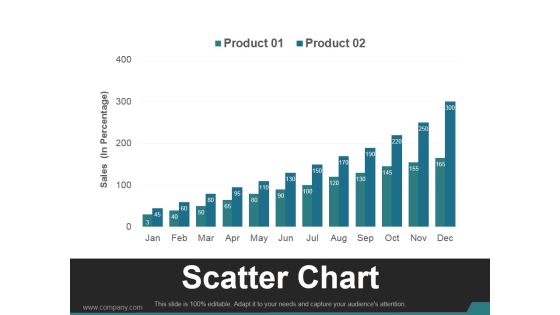
Scatter Chart Template 1 Ppt PowerPoint Presentation Visual Aids
This is a scatter chart template 1 ppt powerpoint presentation visual aids. This is a twelve stage process. The stages in this process are business, marketing, growth, finance, management.

Column Chart Ppt PowerPoint Presentation Show Background Images
This is a column chart ppt powerpoint presentation show background images. This is a nine stage process. The stages in this process are business, strategy, marketing, analysis, growth strategy.

Our Charts And Graphs Ppt PowerPoint Presentation File Visuals
This is a our charts and graphs ppt powerpoint presentation file visuals. This is a one stage process. The stages in this process are business, strategy, marketing, analysis, finance.

High Low Close Chart Ppt PowerPoint Presentation Layouts Guide
This is a high low close chart ppt powerpoint presentation layouts guide. This is a ten stage process. The stages in this process are high, volume, low, business, marketing, finance.
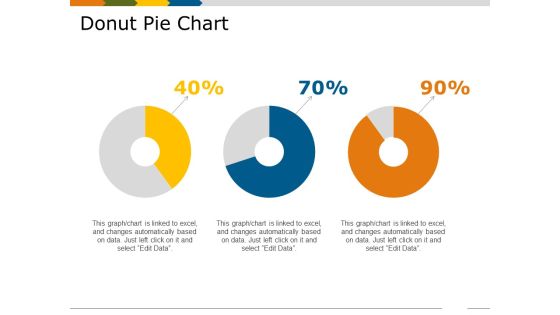
Donut Pie Chart Template 2 Ppt PowerPoint Presentation Show Skills
This is a donut pie chart template 2 ppt powerpoint presentation show skills. This is a three stage process. The stages in this process are percentage, business, marketing, process, finance.

High Low Close Chart Ppt PowerPoint Presentation Ideas Brochure
This is a high low close chart ppt powerpoint presentation ideas brochure. This is a three stage process. The stages in this process are in percentage, product, business, marketing, finance.
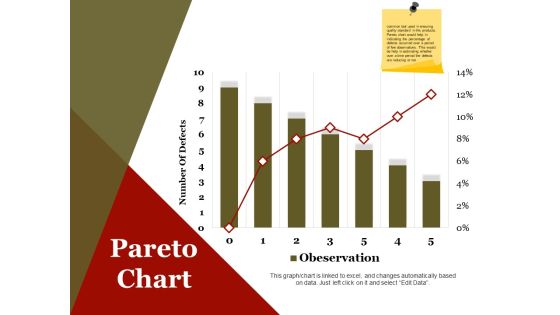
Pareto Chart Ppt PowerPoint Presentation Infographics Design Inspiration
This is a pareto chart ppt powerpoint presentation infographics design inspiration. This is a seven stage process. The stages in this process are number of defects, business, marketing, finance.
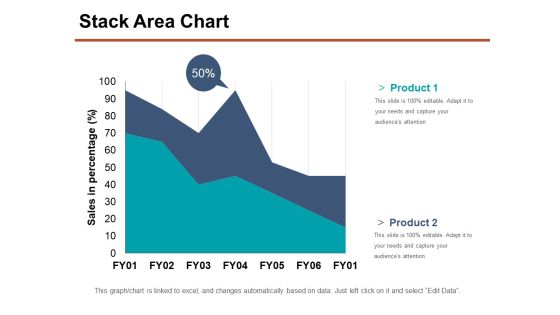
Stack Area Chart Ppt PowerPoint Presentation Show Samples
This is a stack area chart ppt powerpoint presentation show samples. This is a two stage process. The stages in this process are product, sales in percentage, business, marketing, percentage.

High Low Close Chart Ppt PowerPoint Presentation Layouts Objects
This is a high low close chart ppt powerpoint presentation layouts objects. This is a five stage process. The stages in this process are high, volume, low, business, marketing.
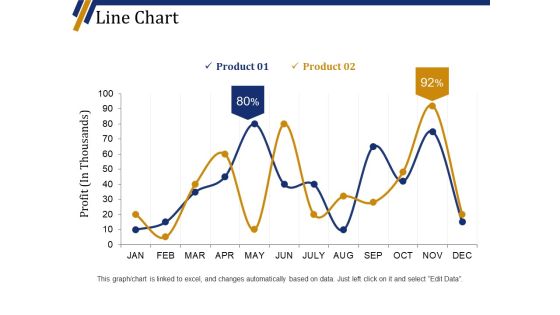
Line Chart Ppt PowerPoint Presentation Portfolio Background Designs
This is a line chart ppt powerpoint presentation portfolio background designs. This is a two stage process. The stages in this process are product, business, finance, marketing, profit in thousands.

Pareto Chart Ppt PowerPoint Presentation File Infographic Template
This is a pareto chart ppt powerpoint presentation file infographic template. This is a six stage process. The stages in this process are number of defects, business, marketing, graph.
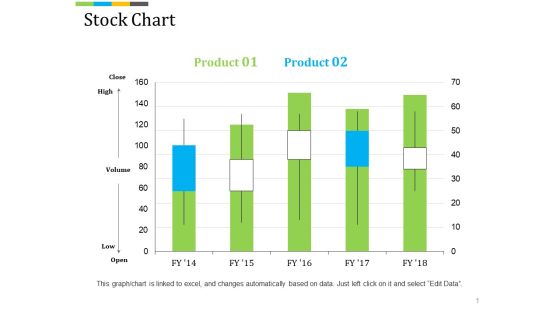
Stock Chart Ppt PowerPoint Presentation Professional Background Image
This is a stock chart ppt powerpoint presentation professional background image. This is a five stage process. The stages in this process are high, volume, low, finance, business, marketing.

Column Chart Ppt PowerPoint Presentation Show Master Slide
This is a column chart ppt powerpoint presentation show master slide. This is a six stage process. The stages in this process are financial, years, business, marketing, finance, graph.
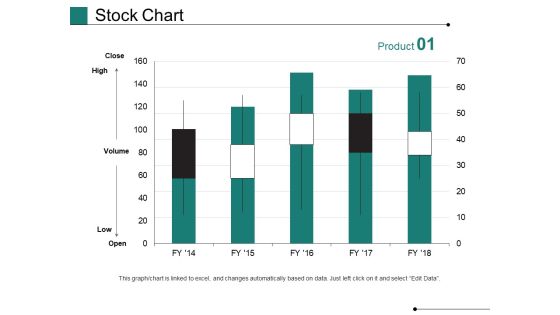
Stock Chart Ppt PowerPoint Presentation Pictures Graphics Design
This is a stock chart ppt powerpoint presentation pictures graphics design. This is a five stage process. The stages in this process are high, volume, low, business, marketing, graph.

Volume High Low Close Chart Ppt PowerPoint Presentation Slides Styles
This is a volume high low close chart ppt powerpoint presentation slides styles. This is a two stage process. The stages in this process are high, volume, low, business, marketing.
Scatter Chart Template 2 Ppt PowerPoint Presentation Slides Icons
This is a scatter chart template 2 ppt powerpoint presentation slides icons. This is a two stage process. The stages in this process are business, marketing, graph, in percentage, finance.
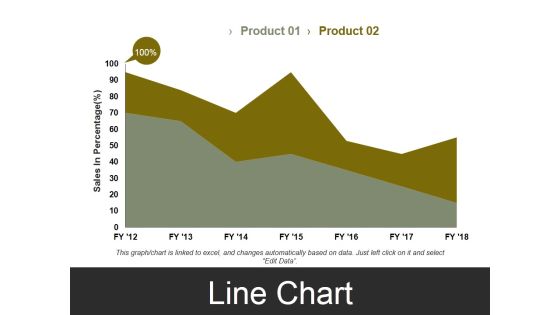
Line Chart Template 3 Ppt PowerPoint Presentation Styles Visual Aids
This is a line chart template 3 ppt powerpoint presentation styles visual aids. This is a two stage process. The stages in this process are sales in percentage, business, marketing, finance, graph.

Clustered Column Chart Ppt PowerPoint Presentation Show Slideshow
This is a clustered column chart ppt powerpoint presentation show slideshow. This is a six stage process. The stages in this process are financial year in, sales in percentage, business, marketing, finance.
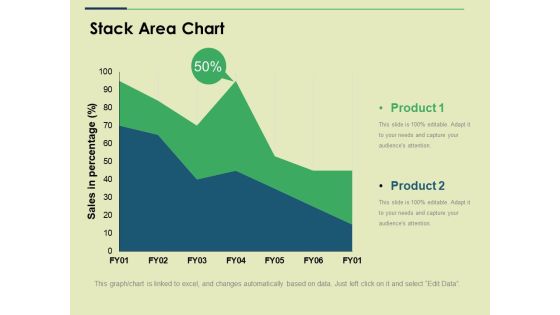
Stack Area Chart Ppt PowerPoint Presentation Show Slide
This is a stack area chart ppt powerpoint presentation show slide. This is a two stage process. The stages in this process are sales in percentage, business, marketing, strategy, graph.
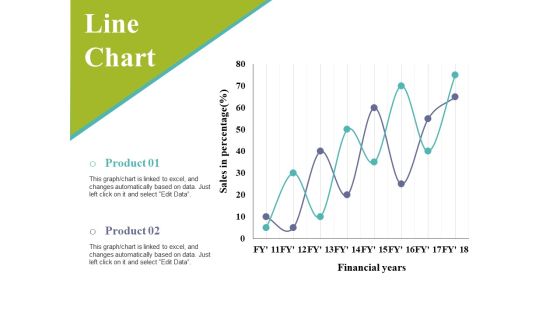
Line Chart Ppt PowerPoint Presentation Infographic Template Slides
This is a line chart ppt powerpoint presentation infographic template slides. This is a two stage process. The stages in this process are sales in percentage, financial years, business, marketing, graph.

Bar Chart Ppt PowerPoint Presentation Visual Aids Diagrams
This is a bar chart ppt powerpoint presentation visual aids diagrams. This is a two stage process. The stages in this process are business, marketing, financial years, sales in percentage, graph.

Bar Chart Ppt PowerPoint Presentation Inspiration Background Image
This is a bar chart ppt powerpoint presentation inspiration background image. This is a two stage process. The stages in this process are business, marketing, strategy, finance, in years, in percentage.

Scatter Bubble Chart Ppt PowerPoint Presentation Gallery Show
This is a scatter bubble chart ppt powerpoint presentation gallery show. This is a two stage process. The stages in this process are profit, in percentage, finance, marketing, business.

Area Chart Ppt PowerPoint Presentation Portfolio Graphics Design
This is a area chart ppt powerpoint presentation portfolio graphics design. This is a two stage process. The stages in this process are business, marketing, in percentage, graph, finance.
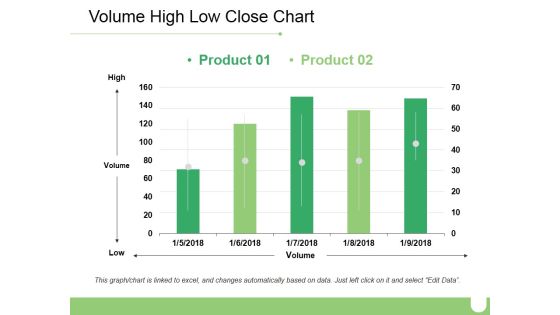
Volume High Low Close Chart Ppt PowerPoint Presentation Inspiration Brochure
This is a volume high low close chart ppt powerpoint presentation inspiration brochure. This is a two stage process. The stages in this process are business, high, volume, low, marketing.

Column Chart Ppt PowerPoint Presentation Infographic Template Icon
This is a column chart ppt powerpoint presentation infographic template icon. This is a two stage process. The stages in this process are business, marketing, sales in percentage, financial year, graph.

Column Chart Ppt PowerPoint Presentation Layouts Graphic Images
This is a column chart ppt powerpoint presentation layouts graphic images. This is a two stage process. The stages in this process are business, finance, years, graph, expenditure in, marketing.

Column Chart Ppt PowerPoint Presentation Outline Design Ideas
This is a column chart ppt powerpoint presentation outline design ideas. This is a two stage process. The stages in this process are business, years, expenditure in, marketing, finance.

Area Chart Ppt PowerPoint Presentation Outline Graphics Pictures
This is a area chart ppt powerpoint presentation outline graphics pictures. This is a two stage process. The stages in this process are financial year, in percentage, business, marketing, finance.

Combo Chart Ppt PowerPoint Presentation Summary Background Images
This is a combo chart ppt powerpoint presentation summary background images. This is a two stage process. The stages in this process are business, marketing, financial year, in percentage, graph.

Area Chart Ppt PowerPoint Presentation Layouts Graphic Images
This is a area chart ppt powerpoint presentation layouts graphic images. This is a three stage process. The stages in this process are business, in years, marketing, in percentage, finance, graph.

Pareto Chart Template 1 Ppt PowerPoint Presentation File Ideas
This is a pareto chart template 1 ppt powerpoint presentation file ideas. This is a eight stage process. The stages in this process are business, finance, marketing, strategy, analysis.
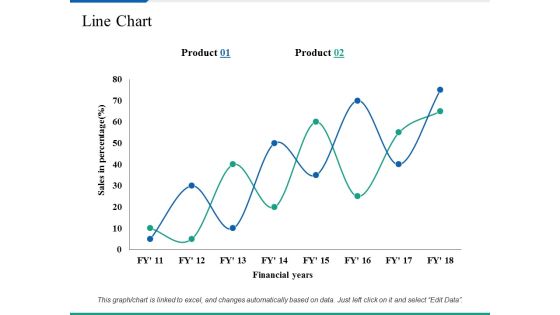
Line Chart Ppt PowerPoint Presentation Summary Clipart Images
This is a line chart ppt powerpoint presentation summary clipart images. This is a two stage process. The stages in this process are business, marketing, sales in percentage, financial years, strategy.

Area Chart Growth Strategy Ppt PowerPoint Presentation Infographics Themes
This is a area chart growth strategy ppt powerpoint presentation infographics themes. This is a two stage process. The stages in this process are finance, marketing, management, investment, analysis.

Combo Chart Finance Ppt PowerPoint Presentation Infographic Template Microsoft
This is a combo chart finance ppt powerpoint presentation infographic template microsoft. This is a three stage process. The stages in this process are finance, marketing, management, investment, analysis.

Control Charts Template 1 Ppt PowerPoint Presentation Show Graphics Design
This is a control charts template 1 ppt powerpoint presentation show graphics design. This is a one stage process. The stages in this process are business, finance, marketing, strategy, analysis.

Control Charts Template 2 Ppt PowerPoint Presentation Slides Designs
This is a control charts template 2 ppt powerpoint presentation slides designs. This is a one stage process. The stages in this process are business, finance, marketing, strategy, analysis.
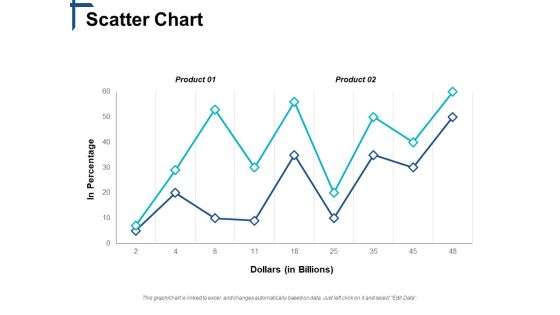
Scatter Chart Competitive Differentiation Ppt PowerPoint Presentation Show Slides
This is a scatter chart competitive differentiation ppt powerpoint presentation show slides. This is a two stage process. The stages in this process are business, management, marketing, strategy, sales.

Donut Pie Chart Ppt PowerPoint Presentation Infographic Template Slides
This is a donut pie chart ppt powerpoint presentation infographic template slides. This is a three stage process. The stages in this process are percentage, product, business, management, marketing.

Area Chart Finance Ppt Powerpoint Presentation Infographic Template Clipart Images
This is a area chart finance ppt powerpoint presentation infographic template clipart images. This is a two stage process. The stages in this process are area bar, finance, marketing, management, analysis.
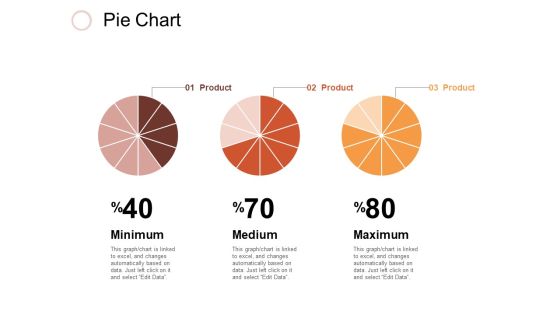
Pie Chart Investment Ppt PowerPoint Presentation Inspiration Design Inspiration
This is a pie chart investment ppt powerpoint presentation inspiration design inspiration. This is a three stage process. The stages in this process are business, management, marketing, percentage, product.


 Continue with Email

 Home
Home


