AI PPT Maker
Templates
PPT Bundles
Design Services
Business PPTs
Business Plan
Management
Strategy
Introduction PPT
Roadmap
Self Introduction
Timelines
Process
Marketing
Agenda
Technology
Medical
Startup Business Plan
Cyber Security
Dashboards
SWOT
Proposals
Education
Pitch Deck
Digital Marketing
KPIs
Project Management
Product Management
Artificial Intelligence
Target Market
Communication
Supply Chain
Google Slides
Research Services
 One Pagers
All Categories
-
Home
- Customer Favorites
- Marketing Budget
Marketing Budget
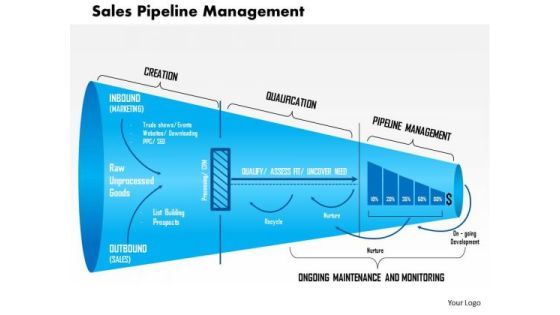
Business Framework Sales Pipeline Management PowerPoint Presentation 1
You can download this sales pipeline diagram for sales and business presentations. This pipeline diagrams to represent sales process steps. Use this professional and customized business diagram for PowerPoint.

Business Framework Sales Pipeline Tool PowerPoint Presentation
This sales pipeline tool diagram can be used to prepare a business presentation or sales strategy presentation. This pipeline diagrams to represent sales pipeline tools. Use this professional and customized business diagram for PowerPoint.

Business Framework Sales Planning Tools PowerPoint Presentation
This sales planning tool diagram can be used to prepare a business presentation or sales strategy presentation. This diagrams represent sales planning tools. Use this professional and customized business diagram for PowerPoint.
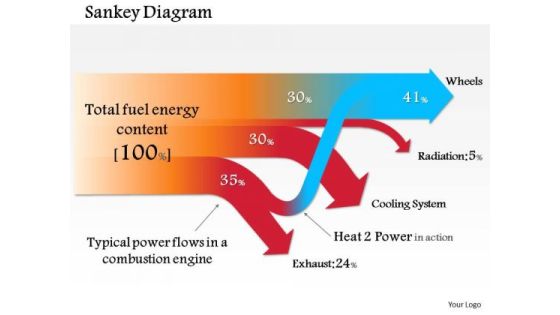
Business Framework Sankey Diagram 1 PowerPoint Presentation
Sankey diagram represent different types of flows in a business for example to show communication flows or any other process flow of information and then help to visualize the contributions to an overall flow.

Business Framework Sankey Diagram PowerPoint Presentation
Sankey diagram represent different types of flows in a business for example to show communication flows or any other process flow of information and then help to visualize the contributions to an overall flow.

Business Framework Scientific Management Model PowerPoint Presentation
Our above diagram represents model of scientific management. This circular diagram displays concepts of scientific management. Use this professional and customized business diagram for PowerPoint.

Business Framework Scientific Management PowerPoint Presentation
Our above diagram represents model of scientific management. This circular diagram displays concepts of scientific management. Use this professional and customized business diagram for PowerPoint.
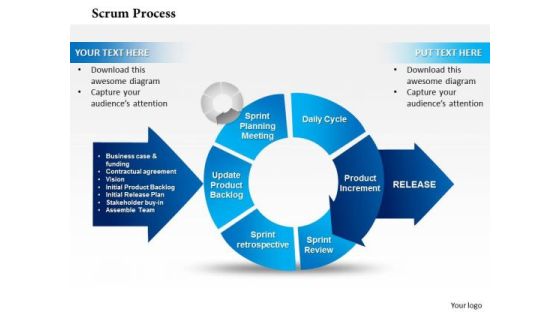
Business Framework Scrum PowerPoint Presentation
Scrum is a process framework that focuses on close customer collaboration, incremental delivery, disciplined change management, and rapid development and deployment. This diagram enables the users to create their own display of the required processes in an easy way.
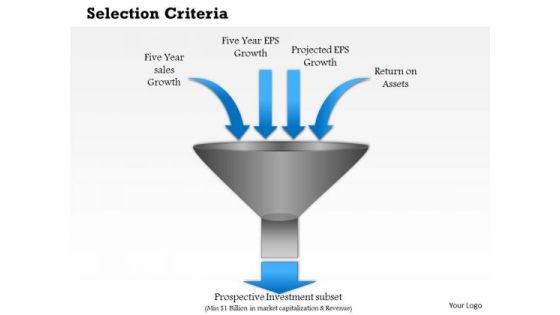
Business Framework Selection Criteria PowerPoint Presentation
This funnel diagram represents selection criteria and sales growth. You can use this funnel diagram in business and sales related presentations. Use this professional and customized business diagram for PowerPoint.

Business Framework Seo Value Proposition 4 Layers PowerPoint Presentation
Download this business diagram to give presentations on search engine optimization. Above diagram displays SEO value proposition with 4 layers. Use this professional and customized business diagram for PowerPoint.
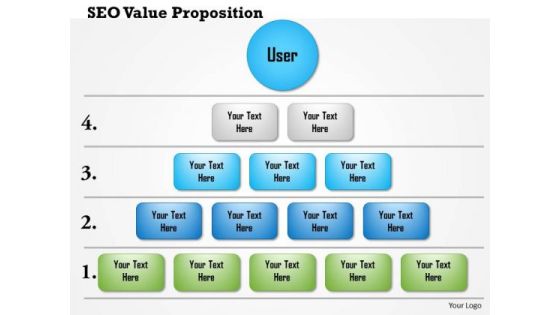
Business Framework Seo Value Proposition 5 Layers PowerPoint Presentation
Download this business diagram to give presentations on search engine optimization. Above diagram displays SEO value proposition with 5 layers. Use this professional and customized business diagram for PowerPoint.
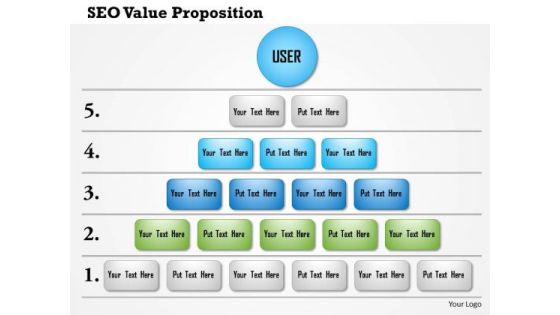
Business Framework Seo Value Proposition 6 Layers PowerPoint Presentation
Download this business diagram to give presentations on search engine optimization. Above diagram displays SEO value proposition with 6 layers. Use this professional and customized business diagram for PowerPoint.
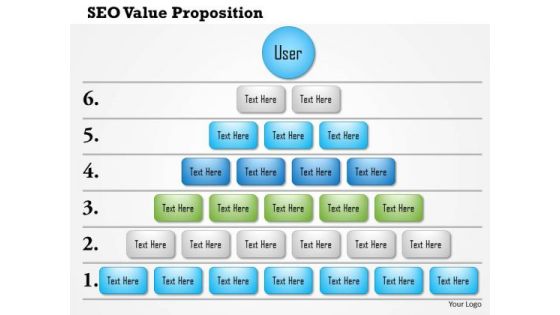
Business Framework Seo Value Proposition 7 Layers PowerPoint Presentation
Download this business diagram to give presentations on search engine optimization. Above diagram displays SEO value proposition with 7 layers. Use this professional and customized business diagram for PowerPoint.
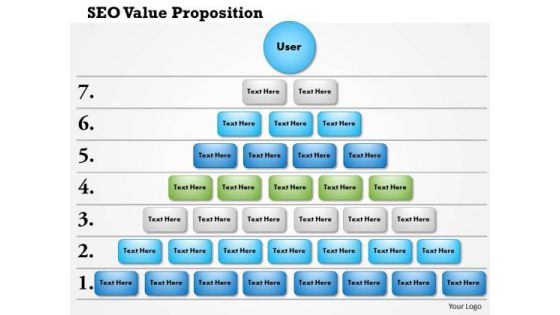
Business Framework Seo Value Proposition 8 Layers PowerPoint Presentation
Download this business diagram to give presentations on search engine optimization. Above diagram displays SEO value proposition with 8 layers. Use this professional and customized business diagram for PowerPoint.
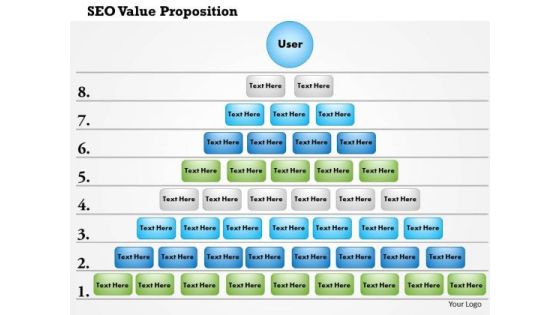
Business Framework Seo Value Proposition 9 Layers PowerPoint Presentation
Download this business diagram to give presentations on search engine optimization. Above diagram displays SEO value proposition with 9 layers. Use this professional and customized business diagram for PowerPoint.
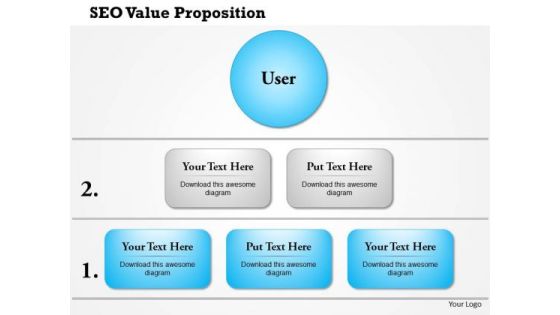
Business Framework Seo Value Proposition PowerPoint Presentation
Download this business diagram to give presentations on search engine optimization. Above diagram displays SEO value proposition. Use this professional and customized business diagram for PowerPoint.
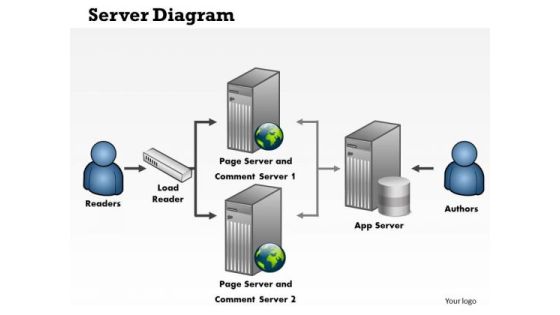
Business Framework Server Diagram PowerPoint Presentation
This business diagram displays framework of servers. Use this professional diagram in technology and network related topics. Make interactive presentations with this slide.
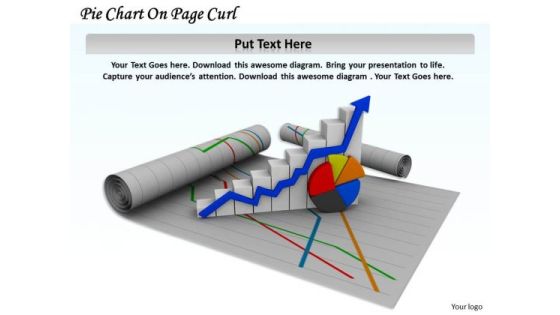
Stock Photo Pie Chart On Page Curl Arrow PowerPoint Slide
This image slide displays pie chart and growth bar graph on page curl. Use this image slide, in your presentations to express views on progress, growth and achievements. This image slide may also be used to depict strategic business planning. Make professional presentations using this image slide.

Stock Photo Pie Chart On Page Curl PowerPoint Slide
This image slide displays pie chart and growth bar graph on page curl on blue shaded background. Use this image slide, in your presentations to express views on progress, growth and achievements. This image slide may also be used to depict strategic business planning. Make professional presentations using this image slide.
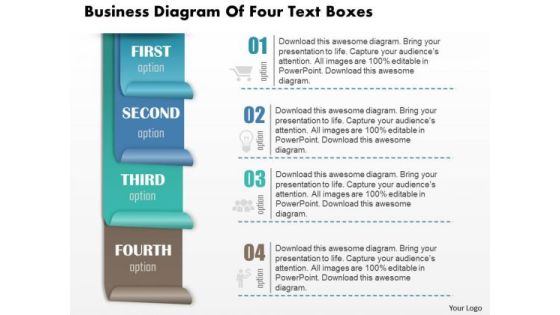
Business Diagram Of Four Text Boxes Presentation Template
We present you the image slide of business consulting diagram of four colorful text boxes. This image slide depicts processes. Use this PowerPoint template, in your presentations to express views on planning, management, achievements, targets etc. This image slide will make your presentations colorful.

Business Diagram Percentage Pie Chart On Computer Tablet Presentation Template
This image slide displays business consulting diagram of percentage pie chart on computer tablet. This image has been made with 3d colorful graphic of pie chart on black tablet. Use this PowerPoint template, in your presentations to express various views like growth, achievements, success in business. This image slide will make your presentations outshine.

Business Diagram Pie Chart Showing Percentages Presentation Template
This image slide displays business consulting diagram of pie chart showing percentage. Pie Charts can be used to display a wide variety of information. When data is represented in the form of a pie chart the human eye finds it very easy to compare the data and quickly draw conclusions. In short they are a great visual aid and will add a touch of professionalism to any presentation which requires the display of data.
Business Diagram Rectangle Showing Four Steps With Icons Presentation Template
This image slide displays 3d colorful graphic of rectangle showing four steps. This image slide has been made with 3d graphic of rectangle with envelope shape on all sides with symbols in center. Use this PowerPoint template, in your presentations to express views on growth, target, management and planning in any business. All text and graphic are editable in this image slide. This image slide will make your presentations colorful.
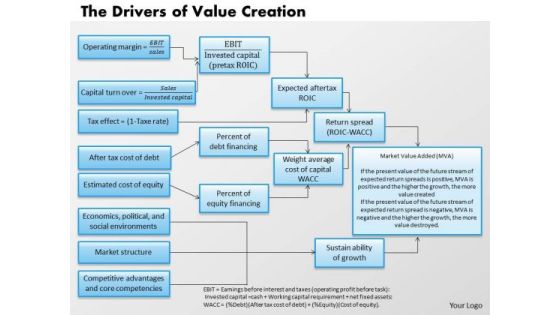
Business Framework The Drivers Of Value Creation PowerPoint Presentation
Above diagram provides framework for the drivers of value creation. It contains flow-chart depicting formula and steps for value creation. Use this professional and customized business diagram for PowerPoint presentations.

Business Diagram Business Step Process Diagram PowerPoint Ppt Presentation
This slide has been designed with business step process diagram. Use this diagram to displays steps of business process. Make amazing presentations with this diagram.

Stock Photo Smartphone Shopping Cart Credit Card PowerPoint Slide
This image slide is designed with graphics of smart phone with credit card. This image depicts shopping through mobile apps. You may use this layout to display your content in an interesting, eye-catching manner.

Business Diagram Business Man With Debt Info Graphic Presentation Template
This template has graphics of 3d man falling down with heavy debt stone. This professional diagram signifies the concept of loss, struggle, and debt burden etc. Download this awesome diagram to capture your audiences attention.

Business Diagram Arrangement Of Business Steps And Text Boxes Presentation Template
This image slide displays business consulting diagram of arrangement of business steps and textboxes. In this slide, there is graphic of alphabetic colorful textboxes with different icons in steps. This image slide depicts planning. Use this PowerPoint template, in your presentations to express growth, teamwork and planning in business. This image slide will make your presentations attractive.
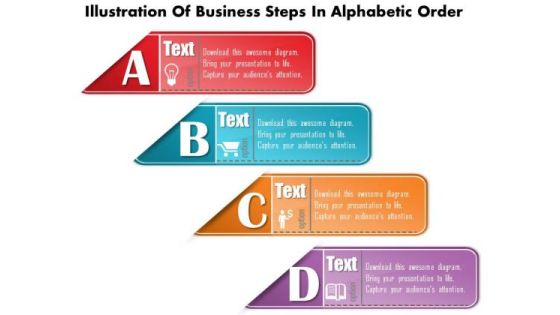
Business Diagram Illustration Of Business Steps In Alphabetic Order Presentation Template
This image slide displays business consulting diagram illustration of business steps in alphabetic order. This image slide depicts stepwise process. Use this PowerPoint template, in your presentations to express views on various business activities. This image slide will make your presentations colorful.

Business Diagram 3d Graphic Colored Bar Graph For Business Result Analysis Presentation Template
This Power Point template has been designed with graphic of 3d graphic and colored bar graph. Use this slide to represent six steps of any business process. Use this diagram for your business presentations and get exclusive comments on your efforts.

Business Diagram Bar Graph For Result Display On Mobile Presentation Template
This Power Point template has been designed with graphic of bar graph on mobile phone. This business diagram can be used to make business reports. Download this Power Point slide to build quality presentation for your viewers.
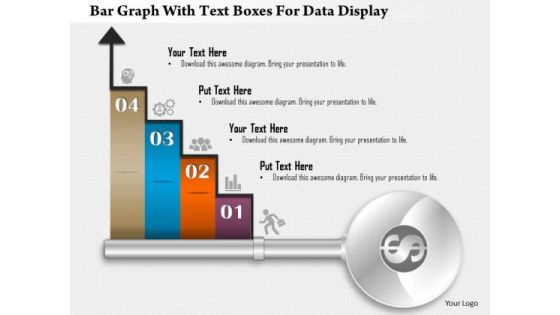
Business Diagram Bar Graph With Text Boxes For Data Display Presentation Template
Our above business diagram displays bar graph. It contains four steps on bar graph with icons. Use this diagram to display four stages of business growth. Download this Power Point slide to build quality presentation for your viewers.
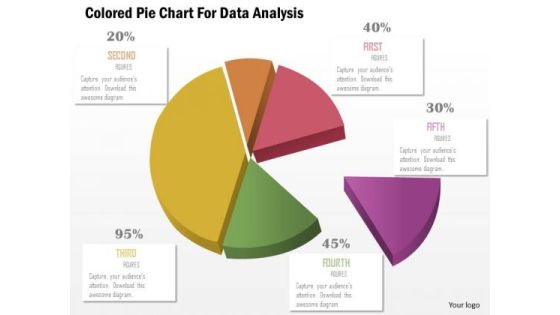
Business Diagram Colored Pie Chart For Data Analysis Presentation Template
This business slide displays pie chart. This diagram is a data visualization tool that gives you a simple way to present statistical information. This slide helps your audience examine and interpret the data you present.
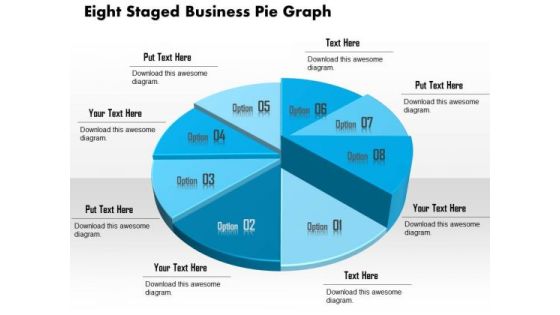
Business Diagram Eight Staged Business Pie Graph Presentation Template
This business slide displays eight staged pie chart. This diagram is a data visualization tool that gives you a simple way to present statistical information. This slide helps your audience examine and interpret the data you present.
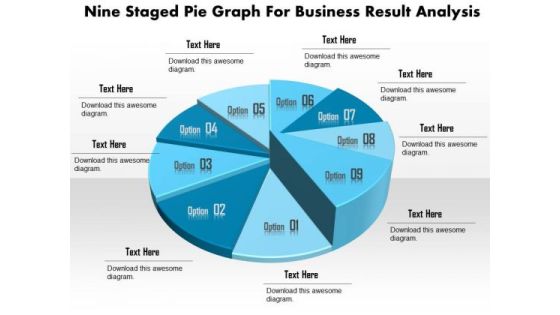
Business Diagram Nine Staged Pie Graph For Business Result Analysis Presentation Template
This business slide displays nine staged pie chart. This diagram is a data visualization tool that gives you a simple way to present statistical information. This slide helps your audience examine and interpret the data you present.

Stock Photo Dollars Covered With Lock And Chain PowerPoint Slide
This Power Point image template has been designed with graphic of dollar and chain. In this image dollar is covered with chain which shows the concept of safety. Use this image template financial security related presentations.
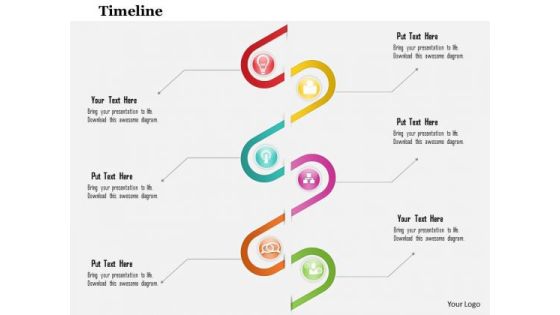
Business Diagram Six Staged Spiral Diagram For Data Flow Presentation Template
This business slide depicts six staged spiral diagram. This diagram provides an effective way of displaying information you can edit text, color, shade and style as per you need. Present your views using this innovative slide and be assured of leaving a lasting impression.
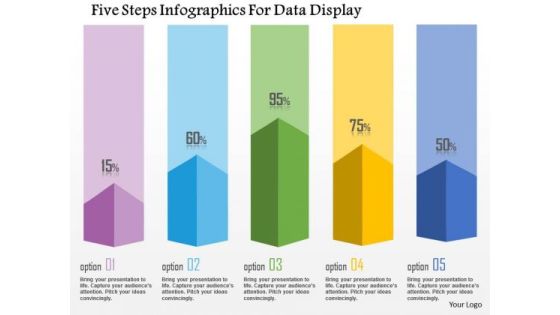
Business Diagram Five Steps Infographics For Data Display Presentation Template
This business diagram has been designed with graphic of five staged info graphics. This diagram can be used to display statistical information. Use this bar graph for your business and sales related presentations.
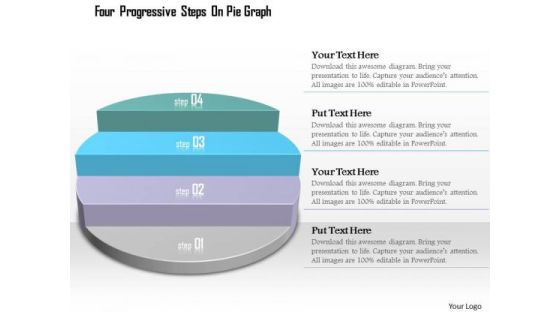
Business Diagram Four Progressive Steps On Pie Graph Presentation Template
This diagram displays progressive steps on pie chart. It contains graphic of pie graph with four steps. Use this diagram, in your presentations to express views on process, steps, stages, progress, targets, goals, success and achievements. Give professional appearance to your presentations using this business slide.

Business Diagram Compass With Multiple Business Plan Presentation Template
This power point template has been designed with graphic of compass. This PPT contains the concept of making business plans. Use this PPT for business and management related presentations.
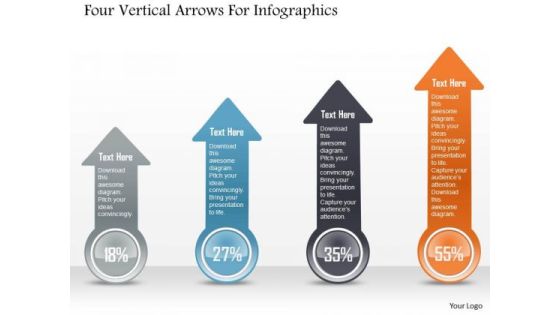
Business Diagram Four Vertical Arrows For Infographics PowerPoint Template
Four vertical arrows are used to craft this power point template. This PPT slide contains the concept of information representation. Display your information in any presentation with this professional PPT slide.
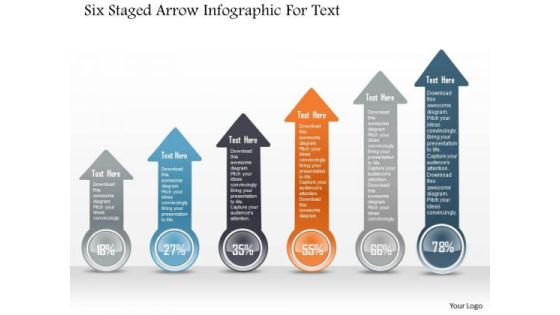
Business Diagram Six Staged Arrow Infographic For Text PowerPoint Template
Six staged colored arrow info graphics diagram has been used to craft this power point template. This PPT contains the concept of business process flow and information representation. Display any process flow in your presentation with this professional PPT slide.
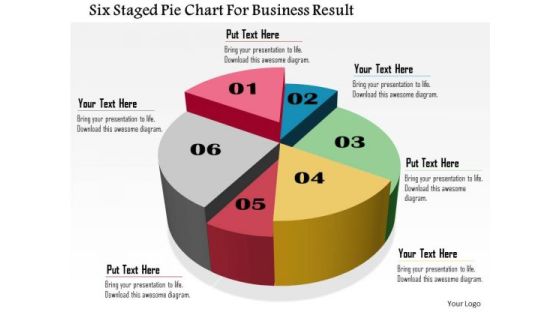
Business Daigram Six Staged Pie Chart For Business Result Presentation Templets
Six staged pie chart is used to design this business slide. Download this diagram to make business and financial reports. Use our above diagram to express information in a visual way.

Business Diagram Pencils For 4 Financial Statements Presentation Template
Emphatically define your message with this slide which contains a graphic of pencils. Above image may be used to display four financial statements. Use this slide to build exclusive presentations for your viewers.
Business Diagram Pie Chart With Icons For Financial Analysis Presentation Template
This professional business diagram slide has been designed with pie chart and icons. It contains concept of financial analysis. Use this slide to build exclusive presentations for your viewers.
Business Diagram Steps With Icons For Success Presentation Template
This business slide displays icons on stairs. Use this diagram slide, in your presentations to depict growth and progress steps. Make your presentations outshine using this professional slide.
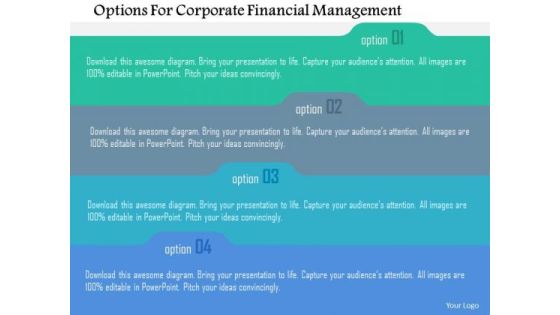
Business Diagram Options For Corporate Financial Management Presentation Template
This diagram contains list of four options. Download this diagram slide to display corporate financial management. This diagram provides an effective way of displaying information you can edit text, color, shade and style as per you need.

Business Diagram Six Options In Pyramid Presentation Template
Sales process can be explained with this pyramid diagram. This diagram contains the graphic of pyramid chart with six options. This diagram provides an effective way of displaying information.

Stock Photo Bar Graph With Growth Arrow PowerPoint Slide
This creative image displays design of Bar Graph with Growth Arrow. This image has been designed to depict business on an Upward Trend. Create an impact with this quality image and make professional presentations.
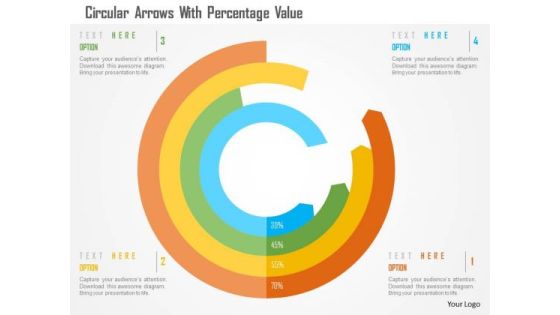
Business Diagram Circular Arrows With Percentage Value Presentation Template
This business slide has been designed with circular arrows. You may download this diagram to display percentage growth data. This template is innovatively designed to highlight your worthy views
Business Diagram Cloud Icon For Data Storage Presentation Template
Concept of cloud computing and data storage has been defined in this power point template. This business diagram contains the graphic of clouds. Use this diagram for business and technology related presentations.

Business Diagram Folders For Financial Review Presentation Template
This business diagram has been designed with graphics of colored folders. You may download this slide for financial review. Use this slide to create an impact on your viewers.
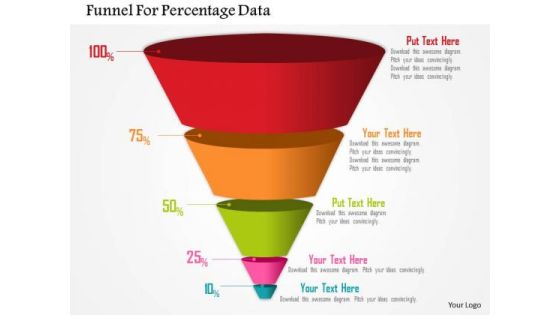
Business Diagram Funnel For Percentage Data Presentation Template
Four staged funnel diagram has been used to design this power point template. This diagram contains the concept of filtration. Present your views and ideas with this impressive image.
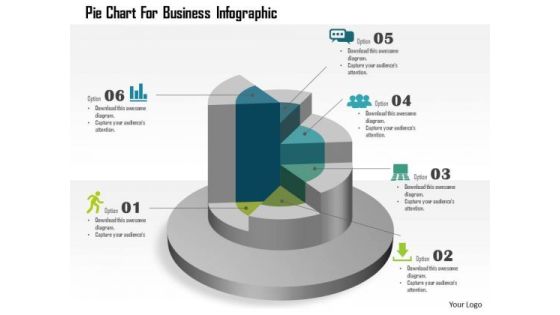
Business Diagram Pie Chart For Business Infographic Presentation Template
This template displays pie chart business infographic. You may download this business slide for result analysis. Amplify your thoughts via this appropriate business template.
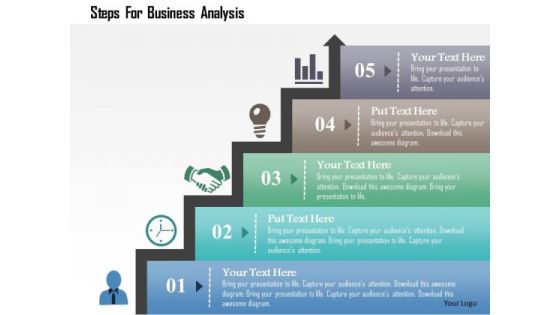
Business Diagram Steps For Business Analysis Presentation Template
Concept of time management has been defined in this power point template diagram. This diagram contains the graphic of bar graph. Amplify your thoughts via this appropriate business template.

Business Diagram Pencil Graph For Statistics Presentation Template
The above template contains graphics of pencil graph. This diagram may be used to display statistical information. This diagram slide will
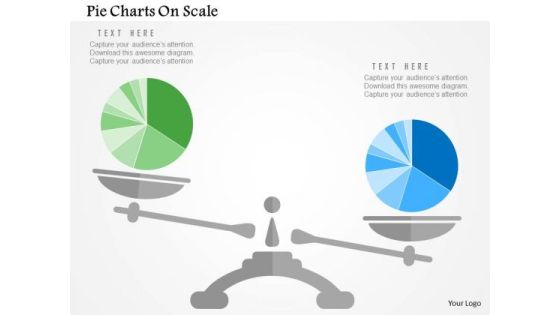
Business Diagram Pie Charts On Scale Presentation Template
Our above slide display graphics of pie chart on a scale. Download this diagram slide to display competitive analysis of business. Adjust the above diagram in your business presentations to visually support your content.

Business Diagram Bar Graph For Growth And Progress Presentation Template
This business slide has been designed with graphics of bar chart. You may download this diagram to display concepts like growth, progress and success in business. Download this diagram slide to make impressive presentations.

Business Diagram Bars For Profit Percentages Presentation Template
Download this exclusive business diagram to present profit in percentage ratio. This slide contains the graphic of bars. This diagram can be useful for business presentations.
Business Diagram Icons Around Pie Chart Presentation Template
Strategy and planning can be displayed with this business diagram. This slide contains the graphic of icons around pie chart Use this editable slide to build quality presentation for your viewers.
Circles With Icons For Communication PowerPoint Template
The above template displays a diagram of circles with icons. This diagram has been professionally designed to emphasize on concept of competitive strategy. Grab centre stage with this slide. Capture the attention of your audience.
Business Diagram Icons And Charts For Business Growth Presentation Template
Our above slide contains graphics of business charts and icons. It helps to display business reports and analysis. Use this diagram to impart more clarity to data and to create more sound impact on viewers.

Business Diagram Matrix Chart For Financial Review Presentation Template
Our above business diagram has been designed with graphics of matrix chart. This slide is suitable to present financial review. Use this business diagram to present your work in a more smart and precise manner.
Icons For Cloud Computing PowerPoint Template
Develop competitive advantage with our above template which contains a diagram of cloud network. This diagram may used to depict concepts like cloud computing and technology. This slide provides an effective way of displaying information.
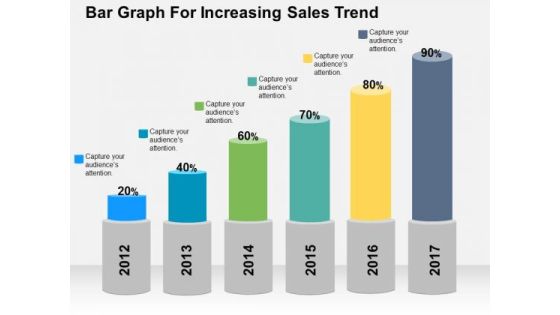
Bar Graph For Increasing Sales Trend PowerPoint Template
Deliver amazing presentations with our above template showing bar graph with percentage values. You may download this slide to depict increase in sales trends. Capture the attention of your audience using this diagram.
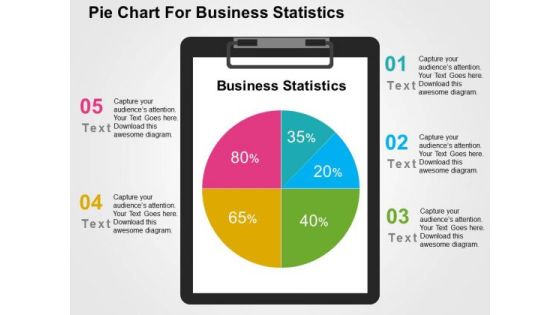
Pie Chart For Business Statistics PowerPoint Template
Visually support your presentation with our above template showing pie chart. This slide has been professionally designed to present business statistics. This template offers an excellent background to build impressive presentation.
Business Man Draws Financial Data For Analysis PowerPoint Templates
This PowerPoint slide has a theme for financial data analysis. This image has been designed to display concept of financial planning and analysis. Deliver amazing presentations to mesmerize your audience using this image
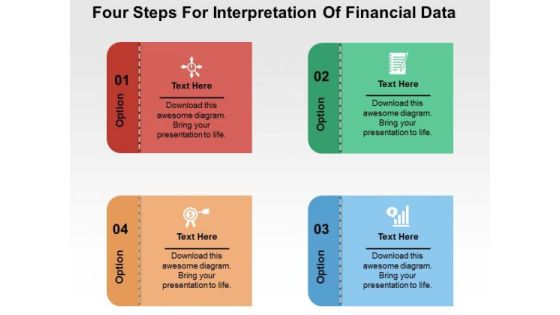
Four Steps For Interpretation Of Financial Data PowerPoint Templates
Our PPT above slide displays graphics of four text boxes with icons. This template may be used to depict interpretation of financial data. You can present your opinions using this impressive slide.

Scorecard For Companys Performance And Financial Condition PowerPoint Templates
Use this PPT slide to display companies performance financial planning. This slide contains graphics of circular scorecard. Trigger the imagination of your audience with this professional diagram.

Bars Displaying Percentage Growth PowerPoint Templates
Our above PPT slide contains bar graph displaying percentage growth. This diagram of bar graph helps to depict statistical information. Use this diagram to impart more clarity to data and to create more sound impact on viewers.
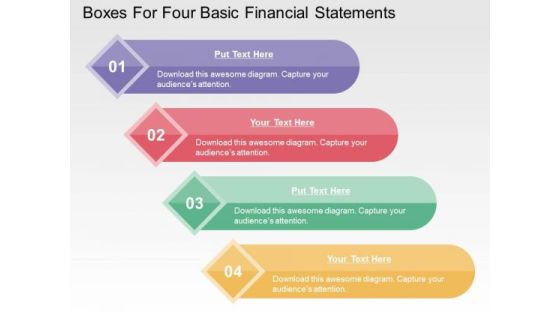
Boxes For Four Basic Financial Statements PowerPoint Templates
This business slide contains graphics of four text boxes. This diagram is suitable to present four basic financial statements. Visual effect of this diagram helps in maintaining the flow of the discussion and provides more clarity to the subject.

Graph Showing Economy Crash PowerPoint Templates
This business slide contains design of graph. This diagram is suitable to present downfall and economy crash. Visual effect of this diagram helps in maintaining the flow of the discussion and provides more clarity to the subject.

Illustration Of Dollar Growth Graph PowerPoint Template
This business slide contains graphics of dollar symbols on graph. This diagram helps to portray concept of financial planning. Present your views using this innovative slide and be assured of leaving a lasting impression.

Infographic For Mission Vision And Values PowerPoint Template
This slide contains the infographic diagram. Download this exclusive business diagram to present business mission, vision and values. This diagram can be useful for business presentations.
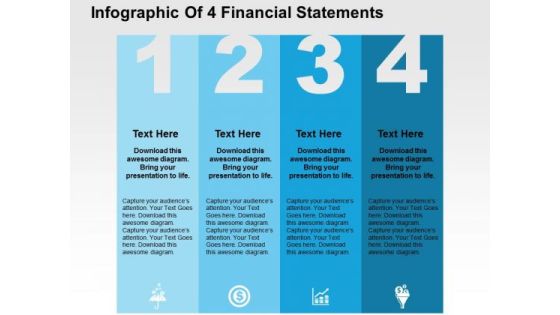
Infographic Of 4 Financial Statements PowerPoint Template
Four financial statements can be displayed in this business diagram. This slide contains the graphic of four text boxes with icons Use this editable slide to build quality presentation for your viewers.
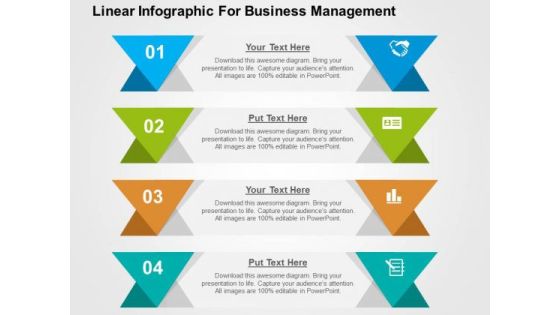
Linear Infographic For Business Management PowerPoint Template
Graphic of tags in linear flow has been used to design this business diagram. This diagram slide may be used to depict business steps in linear flow. Download this diagram for business research and analysis.
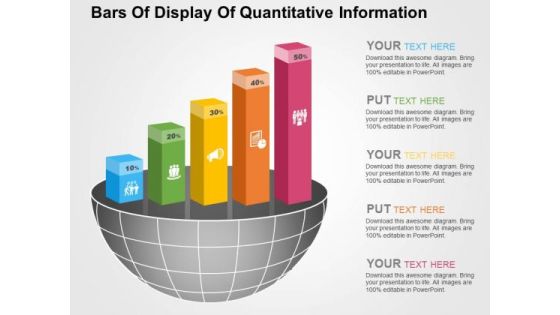
Bars Of Display Of Quantitative Information PowerPoint Templates
Visually support your presentation with our above template illustrating quantitative information. It contains graphics of bars. Etch your views in the brains of your audience with this diagram slide.
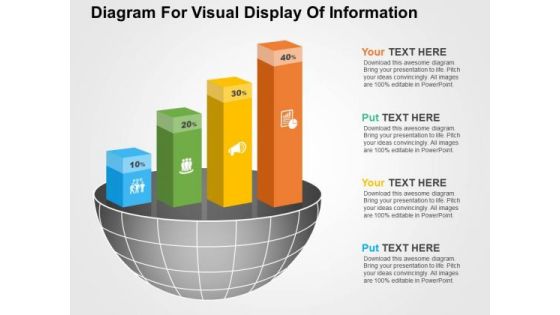
Diagram For Visual Display Of Information PowerPoint Templates
Visually support your presentation with our above template illustrating quantitative information. It contains graphics of bars. Etch your views in the brains of your audience with this diagram slide.

Percentage Data Growth Chart Powerpoint Slides
This PowerPoint template has been designed with percentage data growth chart. Download this PPT chart to depict financial ratio analysis. This PowerPoint slide is of great help in the business sector to make realistic presentations and provides effective way of presenting your newer thoughts.

Understand The Customer Needs Template 2 Ppt PowerPoint Presentation Show Graphics Pictures
This is a understand the customer needs template 2 ppt powerpoint presentation show graphics pictures. This is a five stage process. The stages in this process are understand your customer, what they do, when they buy, how they buy, what they expect of you.

Sample Financial Analysis Report Manufacturing Ppt PowerPoint Presentation Complete Deck With Slides
This is a sample financial analysis report manufacturing ppt powerpoint presentation complete deck with slides. This is a one stage process. The stages in this process are sample, financial, analysis, report, manufacturing.
Portfolio Performance Dashboard Ppt PowerPoint Presentation Icon Designs Download
Presenting this set of slides with name portfolio performance dashboard ppt powerpoint presentation icon designs download. The topics discussed in these slides are assets management, portfolio performance. This is a completely editable PowerPoint presentation and is available for immediate download. Download now and impress your audience.
Goal Performance Powerpoint Example
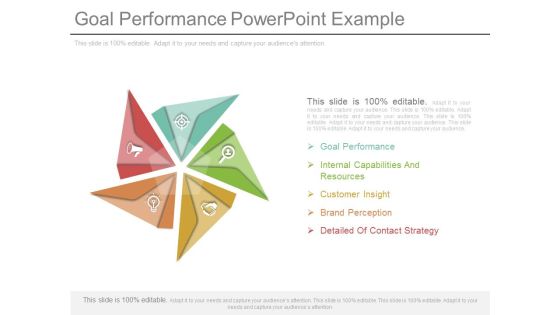
This is a goal performance powerpoint example. This is a five stage process. The stages in this process are goal performance, internal capabilities and resources, customer insight, brand perception, detail of contact strategy.

Increased Online Sales Increased Profitability Ppt Samples
This is a increased online sales increased profitability ppt samples. This is a three stage process. The stages in this process are increased online sales, increased profitability, increase offline sales, increased operating costs, increased employee morale, decrease call center volume, decrease operating costs, no impact.

People Development With Business Strategy Template Presentation Ideas
This is a people development with business strategy template presentation ideas. This is a eight stage process. The stages in this process are compete and grow, improve efficiency and cost, manage business operational risk, execute in line with strategy, business driven flexible, cost effective operations, resilient operations, manageable.

Best Practices For Quality Management Ppt Powerpoint Design
This is a best practices for quality management ppt powerpoint design. This is a nine stage process. The stages in this process are tools for managing quality, cost benefits analysis, cost of quality, basic quality tools, benchmarking, design of experiments, statistical sampling, additional quality planning tools, meetings.

Introduction Stage Of New Product Powerpoint Templates
This is a introduction stage of new product powerpoint templates. This is a five stage process. The stages in this process are sales, low sales, profits, negative profits, competition, little competition, targets, innovators are targeted, cost, high cost per customer acquired.
Business Diagram Four Stages Process With Percentage Presentation Template
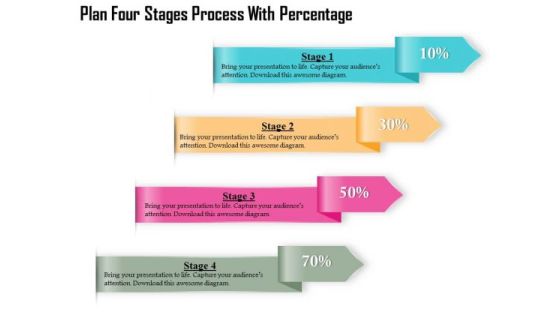
Four multicolored tags in vertical order has been used to decorate this business diagram. This diagram contains the concept of financial data display with percent values. This diagram can be used for management and finance related presentations.

Business Diagram Three Stages Process Percentage Presentation Template
Three multicolored tags in vertical order has been used to decorate this business diagram. This diagram contains the concept of financial data display with percent values. This diagram can be used for management and finance related presentations.
Business Diagram Hexagonal Shape For Text Representation Presentation Template
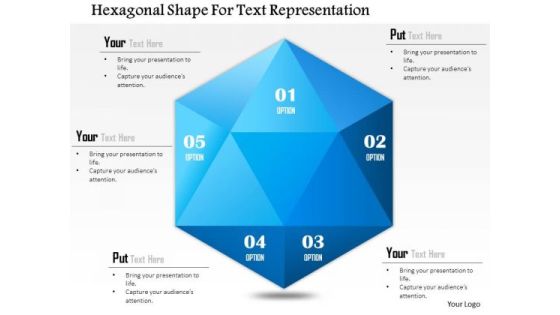
Graphic of hexagonal shape has been used to design this business diagram. This business slide can be used to represent business information. Use this diagram for your business and finance related presentations.
Business Diagram Five Staged Circular Puzzle Bar Graph Presentation Template
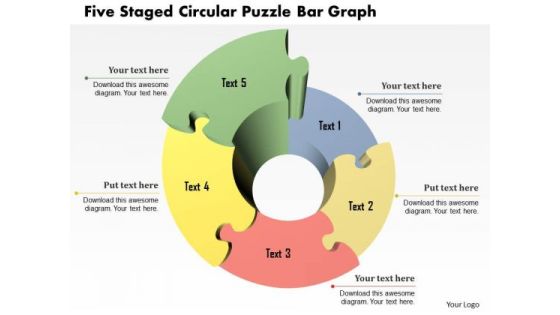
Five staged circular puzzle bar graph been used to design this power point template. This PPT contains the concept of business timeline. Show timelines for your business achievements and use this PPT for your business and finance related presentations.
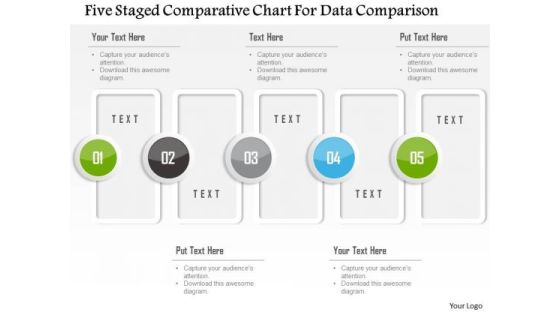
Business Diagram Five Staged Comparative Chart For Data Comparison Presentation Template
Five staged comparative chart has been used to design this power point template. This PPT contains the concept of data comparison. Use this PPT for your business and finance based data comparison in any financial presentation.

Business Diagram Four Staged Linear Timeline Diagram For Business Presentation Template
Four staged linear timeline diagram has been used d to decorate this Power Point template. This PPT contains the concept of process flow. Use this PPT and build quality presentation for business and finance related presentation.
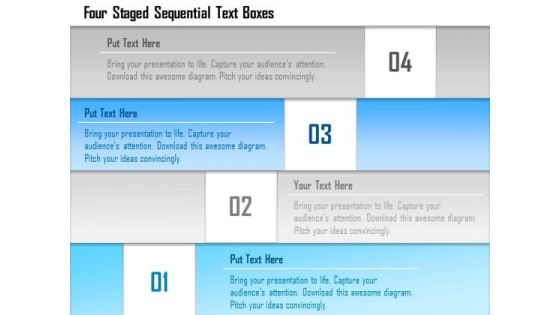
Business Diagram Four Staged Sequential Text Boxes Presentation Template
Four staged sequential stair designed text boxes are used to design this power point template. This PPT contains the concept of data flow. Use this PPT for your business and finance related presentations.
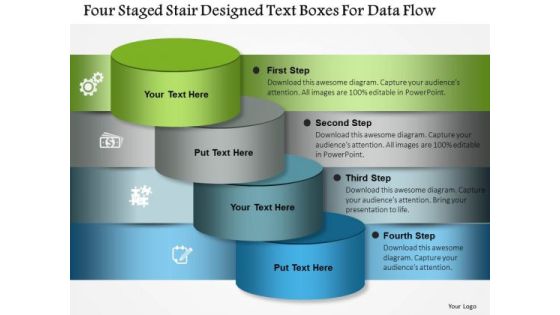
Business Diagram Four Staged Stair Designed Text Boxes For Data Flow Presentation Template
Four staged stair designed text boxes are used to design this power point template. This PPT contains the concept of data flow. Use this PPT for your business and finance related presentations.
Icons On Puzzles For Property Deals PowerPoint Template
Concepts of real estate and finance have been displayed in this business diagram slide. This professional diagram contains diagram of puzzle Infographic. Use this slide to build unique presentations for your viewers.

Infographic For Management Studies PowerPoint Templates
Our above slide has been designed with concentric semi circles. This infographic slide is best to describe concept of managerial finance. You can provide a fantastic explanation of the topic with this slide.

Infographics For Business Management Strategic Planning Powerpoint Template
This Power Point template has been designed with infographic diagram. This PPT diagram may be used for concepts like business management and strategic planning. Use this PPT diagram for business and finance related presentations.
Semi Circle Of Five Business Icons Powerpoint Template
This Power Point template has been crafted designed with semicircle of five business icons. This PPT diagram contains the concept of business strategy and planning process. Use this PPT diagram for business and finance related presentations.
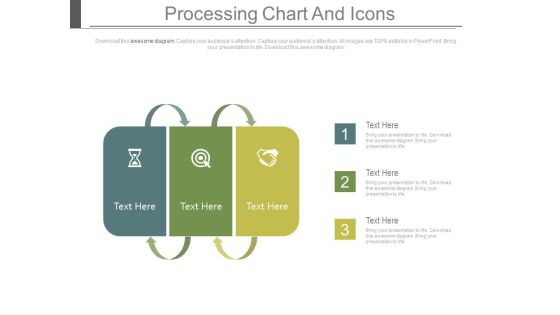
Three Steps Strategic Planning Model Powerpoint Template
This Power Point template has been designed with three steps strategic planning model. This PPT slide portrays the concept of business planning. Use this PPT diagram for business and finance related presentations.

Circles With Dollar Home Message And Target Icons Powerpoint Template
The above PPT template displays four icons of dollar, home, message and target. This diagram is excellent visual tools for explaining concept of home finance. Download this slide to attract the attention of your audience.

Examples Of Scorecards Dashboard Diagram Powerpoint Show
This is a examples of scorecards dashboard diagram powerpoint show. This is a four stage process. The stages in this process are finance, education and growth, customer relationship, process.

Balanced Scorecard Implementation Ppt Slides
This is a balanced scorecard implementation ppt slides. This is a four stage process. The stages in this process are internal business processes, finance, strategy, customers, education and growth.
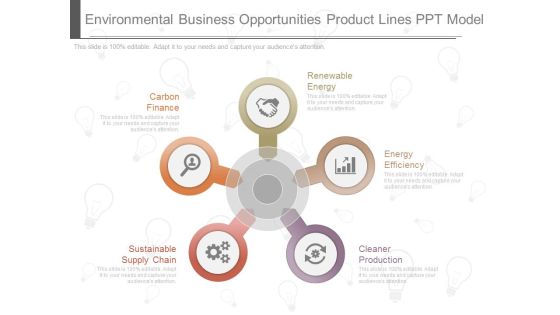
Environmental Business Opportunities Product Lines Ppt Model
This is a environmental business opportunities product lines ppt model. This is a five stage process. The stages in this process are carbon finance, renewable energy, sustainable supply chain, energy efficiency, cleaner production.\n\n\n\n\n\n\n\n\n\n

Customer Distribution Requirement Plan Template Ppt Slide Styles
This is a customer distribution requirement plan template ppt slide styles. This is a five stage process. The stages in this process are operations, executive, services, sales, finance, business one.\n\n\n

Trading System And Order Example Presentation Ideas
This is a trading system and order example presentation ideas. This is a nine stage process. The stages in this process are setting, shipping, tender, purchase, sales, finance, inventory.

Business Processes Of Organization Diagram Example Of Ppt
This is a business processes of organization diagram example of ppt. This is a eight stage process. The stages in this process are hr, inventory, sales, purchase, finance and accounting, crm, engineering production, scm.

Operational Flow Of Financial Services Chart Example Of Ppt
This is a operational flow of financial services chart example of ppt. This is a five stage process. The stages in this process are customer, mobile, atm, employees, high finance trading.

Roadmap For Building Organizational Efficiency Ppt Summary
This is a roadmap for building organizational efficiency ppt summary. This is a three stage process. The stages in this process are priorities, governance, finance, capacity, stockholders, targets, institutions, action plan, scoping, who, how, what.
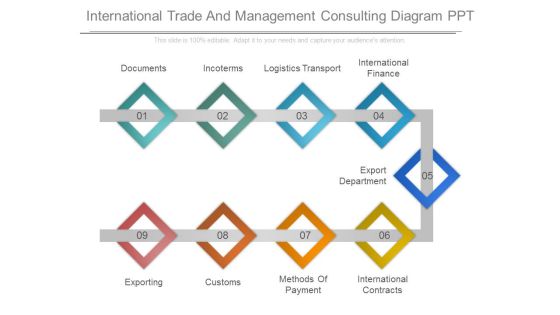
International Trade And Management Consulting Diagram Ppt
This is a international trade and management consulting diagram ppt. This is a nine stage process. The stages in this process are documents, incoterms, logistics transport, international finance, export department, exporting, customs, methods of payment, international contracts.
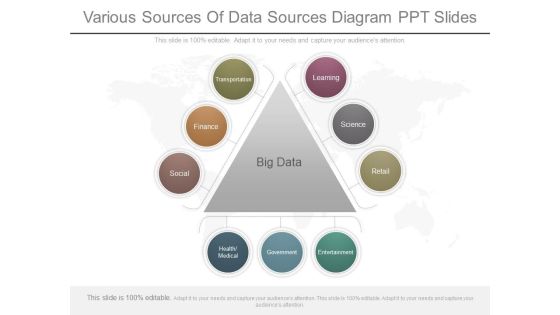
Various Sources Of Data Sources Diagram Ppt Slides
This is a various sources of data sources diagram ppt slides. This is a three stage process. The stages in this process are learning, science, retail, entertainment, government, health medical, social, finance, transportation.
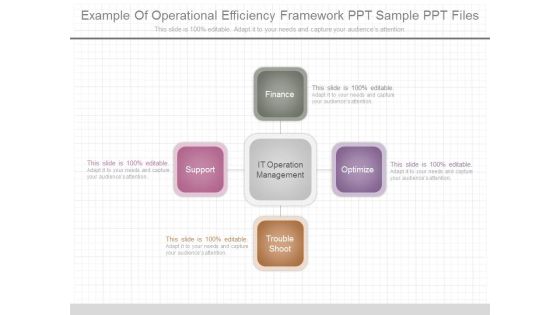
Example Of Operational Efficiency Framework Ppt Sample Ppt Files
This is a example of operational efficiency framework ppt sample ppt files. This is a four stage process. The stages in this process are finance, optimize, troubleshoot, support, it operation management.
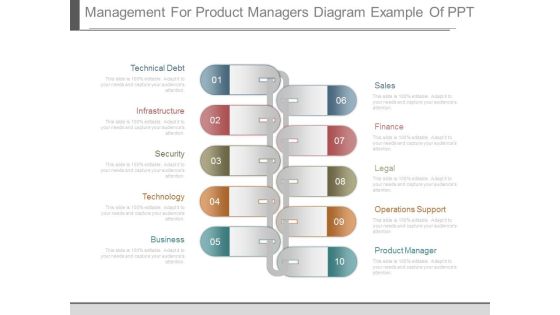
Management For Product Managers Diagram Example Of Ppt
This is a management for product managers diagram example of ppt. This is a ten stage process. The stages in this process are technical debt, infrastructure, security, technology, business, sales, finance, legal, operations support, product manager.
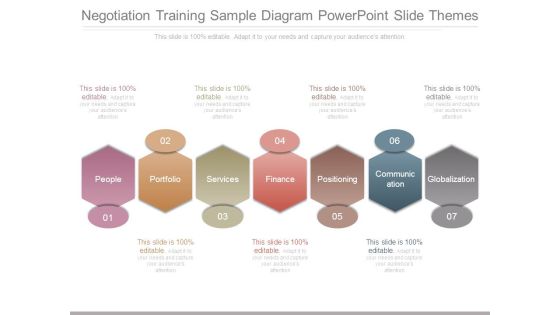
Negotiation Training Sample Diagram Powerpoint Slide Themes
This is a negotiation training sample diagram powerpoint slide themes. This is a seven stage process. The stages in this process are people, portfolio, services, finance, positioning, communication, globalization.

The Allure Of Matrix Management Diagram Powerpoint Slides
This is a the allure of matrix management diagram powerpoint slides. This is a eight stage process. The stages in this process are context, community, control, clarity, research, production, sales, finance.

Buy Trade Process Diagram Powerpoint Slides Design
This is a buy trade process diagram powerpoint slides design. This is a six stage process. The stages in this process are preparing to shop, find a realtor, property search, financing, making an offer, closing.

Balanced Scorecard Perspectives Example Presentation Graphics
This is a balanced scorecard perspectives example presentation graphics. This is a five stage process. The stages in this process are financial perspective, customer perspective, internal process perspective, finance, learning and growth.

Business Management Dashboard Slide Powerpoint Graphics
This is a business management dashboard slide powerpoint graphics. This is a four stage process. The stages in this process are property system, crm system, asset system, finance system.

Our Team Ppt PowerPoint Presentation Rules
This is a our team ppt powerpoint presentation rules. This is a four stage process. The stages in this process are john smith finance manager, marry smith ceo and founder, joe smith product manager.
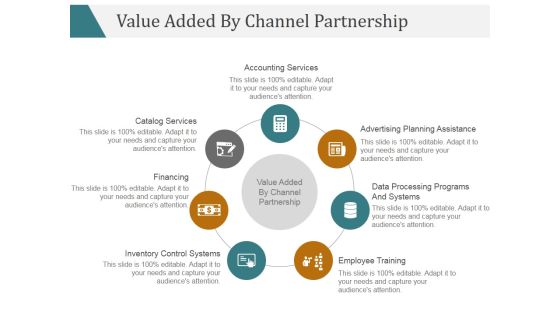
Value Added By Channel Partnership Ppt PowerPoint Presentation Layouts
This is a value added by channel partnership ppt powerpoint presentation layouts. This is a seven stage process. The stages in this process are financing, catalog services, employee training.
Investor Pitch Startup Ppt PowerPoint Presentation Complete Deck With Slides

Portfolio Evaluation Template 2 Ppt PowerPoint Presentation Inspiration Information
This is a portfolio evaluation template 2 ppt powerpoint presentation inspiration information. This is a five stage process. The stages in this process are pie, finance, percentage, business, growth.
Selection Of The Optimal Portfolio Template 2 Ppt PowerPoint Presentation Icon Introduction
This is a selection of the optimal portfolio template 2 ppt powerpoint presentation icon introduction. This is a three stage process. The stages in this process are real estate, stocks, bonds, percentage, finance.

Changes In Competitive Environment Template 2 Ppt PowerPoint Presentation Infographic Template Themes
This is a changes in competitive environment template 2 ppt powerpoint presentation infographic template themes. This is a four stage process. The stages in this process are weekly, monthly, year, finance, percentage.

Our Team Template 1 Ppt PowerPoint Presentation Show Graphics
This is a our team template 1 ppt powerpoint presentation show graphics. This is a three stage process. The stages in this process are director of sales, product manager, finance manager, designer, graphic designer.

Capex Summary Template 1 Ppt PowerPoint Presentation Gallery Layout
This is a capex summary template 1 ppt powerpoint presentation gallery layout. This is a four stage process. The stages in this process are machine, milestone, percentage, finance, business.

Capex Summary Template 2 Ppt PowerPoint Presentation Show Slide
This is a capex summary template 2 ppt powerpoint presentation show slide. This is a four stage process. The stages in this process are building, machine, milestone, percentage, finance.
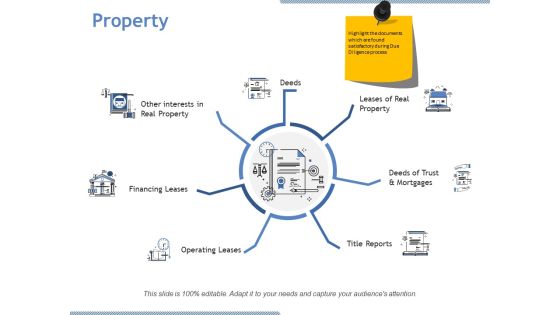
Property Ppt PowerPoint Presentation Professional Background Designs
This is a property ppt powerpoint presentation professional background designs. This is a seven stage process. The stages in this process are deeds, financing leases, operating leases, title reports, leases of real property.
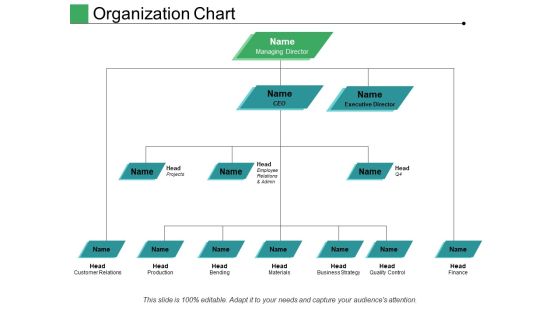
Organization Chart Ppt PowerPoint Presentation Pictures Structure
This is a organization chart ppt powerpoint presentation pictures structure. This is a three stage process. The stages in this process are managing director, executive director, head, ceo, finance.

Scope Verification Powerpoint Slides Deck
This is a scope verification powerpoint slides deck. This is a four stage process. The stages in this process are scope verification, acceptance project scope, quality assurance, evaluating overall project performance.
Forces Thought Powerpoint Slides Themes
This is a forces thought powerpoint slides themes. This is a four stage process. The stages in this process are very important, forces thought, all aspects of project, used for other projects.
Daily Schedule Circular Chart Ppt Powerpoint Guide
This is a daily schedule circular chart ppt powerpoint guide. This is a seven stage process. The stages in this process are develop proposal, submit and negotiate, award setup, manage subawards, execute project, close out project, define opportunity.
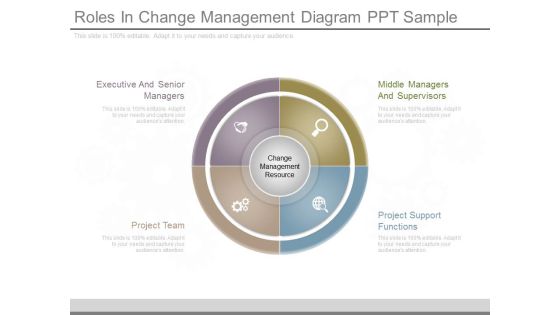
Roles In Change Management Diagram Ppt Sample
This is a roles in change management diagram ppt sample. This is a four stage process. The stages in this process are middle managers and supervisors, project support functions, project team, executive and senior managers.

Process Of Monitor And Control Risk Diagram Powerpoint Themes
This is a process of monitor and control risk diagram powerpoint themes. This is a six stage process. The stages in this process are monitor and control risks, project start, planning, identification, analysis, responses, project end.

Levels Of Organizational Maturity Diagram Powerpoint Shapes
This is a levels of organizational maturity diagram powerpoint shapes. This is a five stage process. The stages in this process are corporate success, project success, repeatable success, quantitative managed, project management success.

Sigma Performance Levels Ppt Infographics
This is a sigma performance levels ppt infographics. This is a five stage process. The stages in this process are engagement, bottom line, project by project, trained individuals, customer focused.

Six Sigma Strands Chart Ppt Examples Slides
This is a six sigma strands chart ppt examples slides. This is a six stage process. The stages in this process are bottom line, trained individuals, data driven approach, customer focused, project by project, engagement, benefits of six sigma.
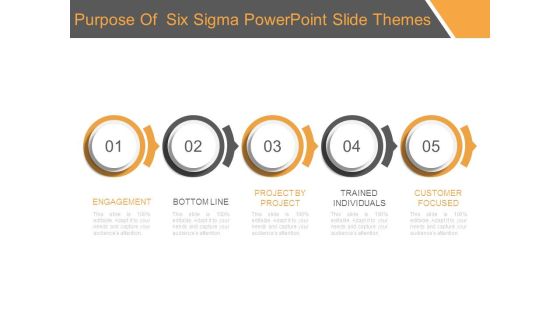
Purpose Of Six Sigma Powerpoint Slide Themes
This is a purpose of six sigma powerpoint slide themes. This is a five stage process. The stages in this process are engagement, bottom line, project by project, trained individuals, customer focused.
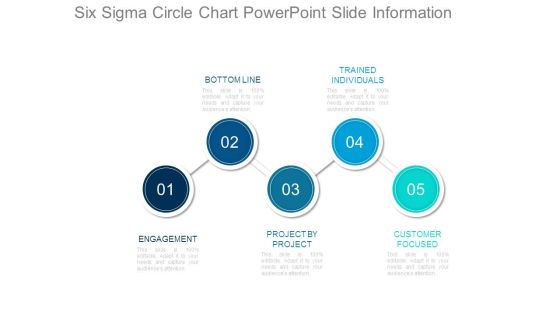
Six Sigma Circle Chart Powerpoint Slide Information
This is a six sigma circle chart powerpoint slide information. This is a five stage process. The stages in this process are bottom line, trained individuals, engagement, project by project, customer focused.

Six Sigma Linear Circles Chart Presentation Powerpoint Templates
This is a six sigma linear circles chart presentation powerpoint templates. This is a five stage process. The stages in this process are bottom line, trained individuals, engagement, project by project, customer focused.

Business Case Development Methodology Presentation Diagrams
This is a business case development methodology presentation diagrams. This is a five stage process. The stages in this process are final delivery stage, post project, subsequent delivery stage, initiation stage, pre project.
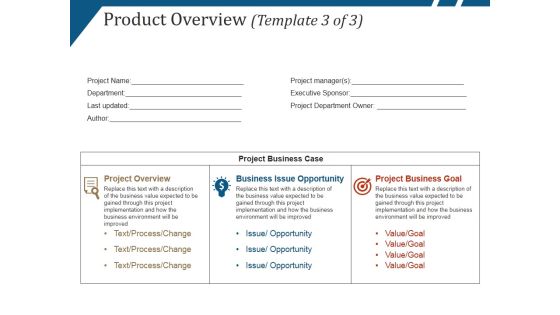
Product Overview Template 3 Ppt PowerPoint Presentation Ideas Design Templates
This is a product overview template 3 ppt powerpoint presentation ideas design templates. This is a three stage process. The stages in this process are project overview, business issue opportunity, project business goal.

Why Six Sigma Template 1 Ppt PowerPoint Presentation Infographic Template Slide
This is a why six sigma template 1 ppt powerpoint presentation infographic template slide. This is a five stage process. The stages in this process are engagement, bottom line, project by project, trained individuals, customer focused.

Why Six Sigma Template 2 Ppt PowerPoint Presentation Infographic Template Skills
This is a why six sigma template 2 ppt powerpoint presentation infographic template skills. This is a six stage process. The stages in this process are bottom line, engagement, project by project, customer focused, data driven approach.

Business Transformation Areas Ppt PowerPoint Presentation Infographics Graphics
This is a business transformation areas ppt powerpoint presentation infographics graphics. This is a five stage process. The stages in this process are business analytics, project management, project leadership, change management, business transformation.

Corporate Structure Business ORG Chart Ppt PowerPoint Presentation Slides Template
This is a corporate structure business org chart ppt powerpoint presentation slides template. This is a five stage process. The stages in this process are project governance, governance structure, project structure.
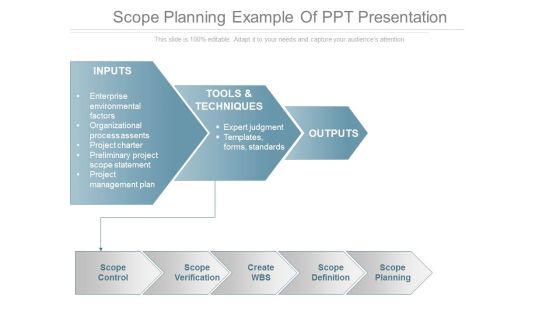
Scope Planning Example Of Ppt Presentation
This is a scope planning example of ppt presentation. This is a two stage process. The stages in this process are inputs, enterprise environmental factors, organizational process assents, project charter, preliminary project scope statement, project management plan, tools and techniques, expert judgment, templates forms standards, outputs, scope control, scope verification, create wbs, scope definition, scope planning.
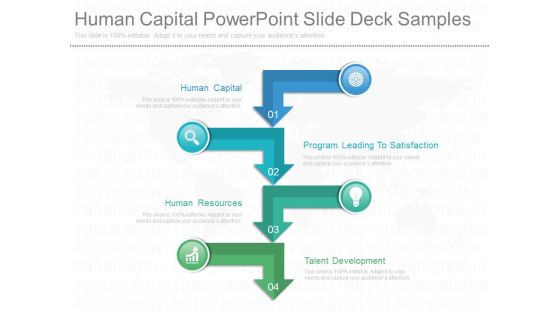
Human Capital Powerpoint Slide Deck Samples
This is a human capital powerpoint slide deck samples. This is a four stage process. The stages in this process are human capital, program leading to satisfaction, human resources, talent development.
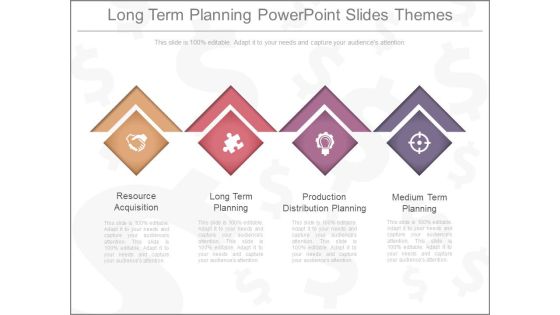
Long Term Planning Powerpoint Slides Themes
This is a long term planning powerpoint slides themes. This is a four stage process. The stages in this process are resource acquisition, long term planning, production distribution planning, medium term planning.
Network Development Example Ppt Presentation
This is a network development example ppt presentation. This is a five stage process. The stages in this process are delivery plan, network development, operational analysis, define scope, define key resources.

Development Objectives National Goals Powerpoint Layout
This is a development objectives national goals powerpoint layout. This is a six stage process. The stages in this process are issues assessment, implementation plan, actions of implementation, water resources, national goals, development objectives.

Customer Relationship Management Ppt Images
This is a customer relationship management ppt images. This is a four stage process. The stages in this process are customer relationship management, enterprise resource planning, business process redesign, financial management.
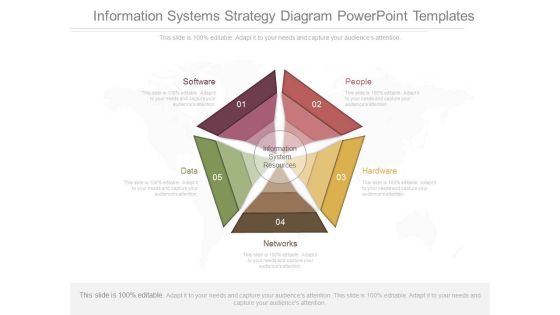
Information Systems Strategy Diagram Powerpoint Templates
This is a information systems strategy diagram powerpoint templates. This is a five stage process. The stages in this process are software, people, hardware, data, networks, information system resources.
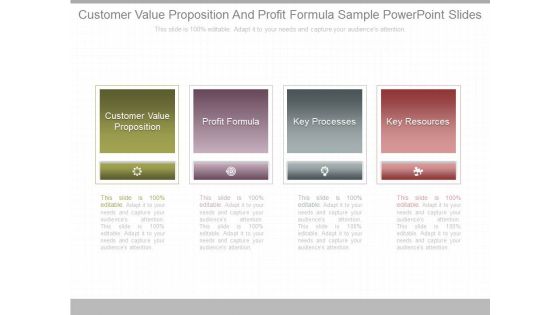
Customer Value Proposition And Profit Formula Sample Powerpoint Slides
This is a customer value proposition and profit formula sample powerpoint slides. This is a four stage process. The stages in this process are customer value proposition, profit formula, key processes, key resources.

Erp Systems Implementation Ppt Ideas
This is a erp systems implementation ppt ideas. This is a five stage process. The stages in this process are crm, financial management, supply chain management, resource planning, hrm, erp systems implementation.\n\n\n \n
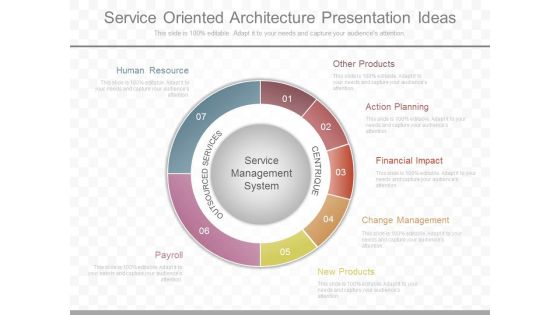
Service Oriented Architecture Presentation Ideas
This is a service oriented architecture presentation ideas. This is a seven stage process. The stages in this process are service management system, outsourced services, centrique, other products, action planning, financial impact, change management, new products, payroll, human resource.

Customer Relationship Management Diagram Ppt Sample
This is a customer relationship management diagram ppt sample. This is a four stage process. The stages in this process are business process redesign, customer relationship management, financial management, enterprises resources planning.

Quality Management General Requirements Ppt Slide Design
This is a quality management general requirements ppt slide design. This is a four stage process. The stages in this process are product realization, management responsibility, resource management, measurement analysis and improvement.

Team Building Assessment Ppt Presentation
This is a team building assessment ppt presentation. This is a six stage process. The stages in this process are resources, authority and accountability, communication and coordination, vision and values, team processes, goals.
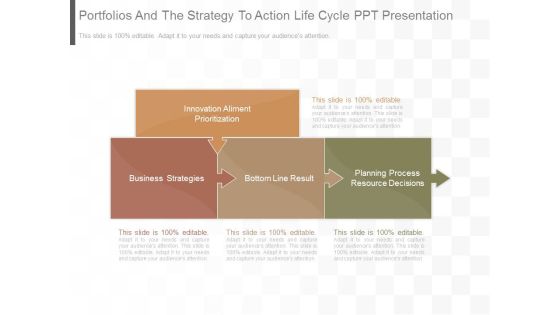
Portfolios And The Strategy To Action Life Cycle Ppt Presentation
This is a portfolios and the strategy to action life cycle ppt presentation. This is a four stage process. The stages in this process are innovation aliment prioritization, business strategies, bottom line result, planning process resource decisions.

Retail Cycle Business Diagram Ppt Powerpoint Slides
This is a retail cycle business diagram ppt powerpoint slides. This is a five stage process. The stages in this process are retail, supply chain, enterprise resource planning, workflow, business intelligence, customer relationship.
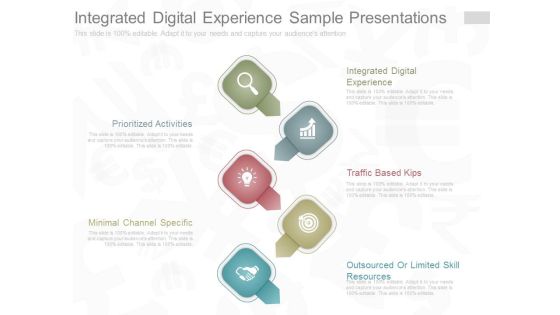
Integrated Digital Experience Sample Presentations
This is a integrated digital experience sample presentations. This is a five stage process. The stages in this process are integrated digital experience, traffic based kips, outsourced or limited skill resources, prioritized activities, minimal channel specific.

Strategic Planning Framework Diagram Powerpoint Templates
This is a strategic planning framework diagram powerpoint templates. This is a six stage process. The stages in this process are establish business strategy, assess current resources, define your passion, determine growth stage, monitor progress and adjust, create action plans.
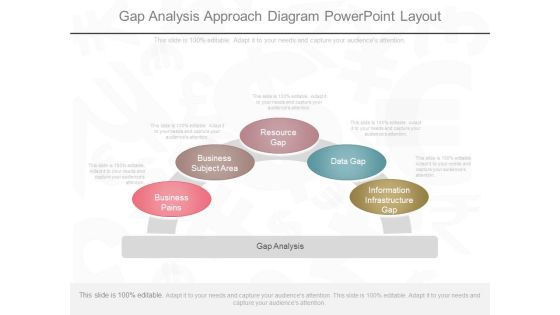
Gap Analysis Approach Diagram Powerpoint Layout
This is a gap analysis approach diagram powerpoint layout. This is a five stage process. The stages in this process are information infrastructure gap, data gap, resource gap, business subject area, business pains.
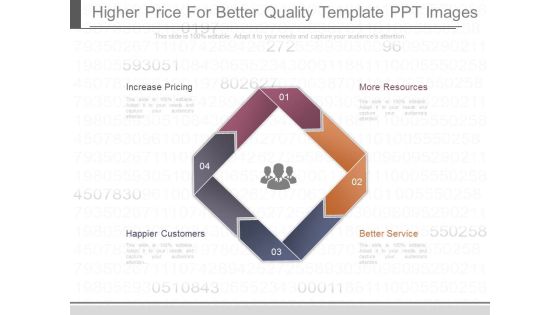
Higher Price For Better Quality Template Ppt Images
This is a higher price for better quality template ppt images. This is a four stage process. The stages in this process are more resources, better service, happier customers, increase pricing.

Program Management Framework Ppt Powerpoint Slide Graphics
This is a program management framework ppt powerpoint slide graphics. This is a five stage process. The stages in this process are resources, schedule, scope, organizing concept, program plan, plan track report, program metrics, supporting business processes.
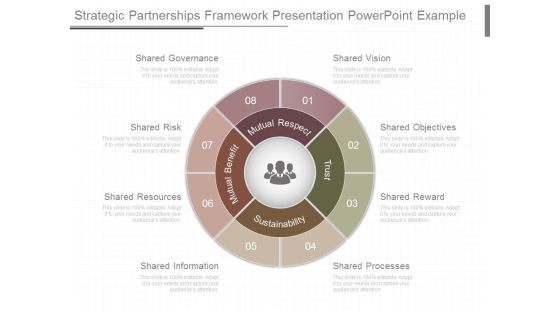
Strategic Partnerships Framework Presentation Powerpoint Example
This is a strategic partnerships framework presentation powerpoint example. This is a eight stage process. The stages in this process are shared vision, shared objectives, shared reward, shared processes, shared information, shared resources, shared risk, shared governance.
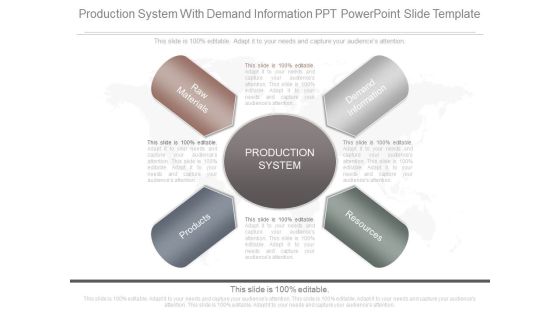
Production System With Demand Information Ppt Powerpoint Slide Template
This is a production system with demand information ppt powerpoint slide template. This is a four stage process. The stages in this process are raw materials, products, production system, demand information, resources.
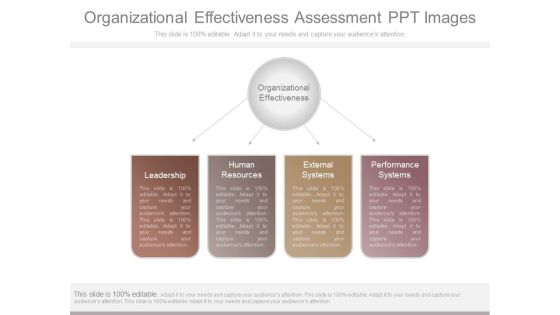
Organizational Effectiveness Assessment Ppt Images
This is a organizational effectiveness assessment ppt images. This is a four stage process. The stages in this process are organizational effectiveness, leadership, human resources, external systems, performance systems.

Importance Of It Governance Sample Diagram Ppt Presentations
This is a importance of it governance sample diagram ppt presentations. This is a five stage process. The stages in this process are strategic alliance, value creation and delivery, resource management, performance measurement, risk management and safeguarding of assets.

Sustainability Development Layout Ppt Slides
This is a sustainability development layout ppt slides. This is a four stage process. The stages in this process are strategic and operational level, sustainability development, equal, opportunity, sound management of resources.
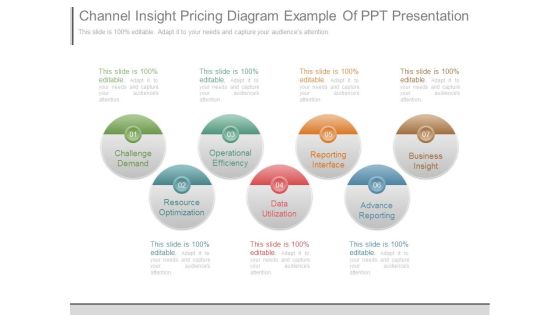
Channel Insight Pricing Diagram Example Of Ppt Presentation
This is a channel insight pricing diagram example of ppt presentation. This is a seven stage process. The stages in this process are challenge demand, operational efficiency, reporting interface, business insight, resource optimization, data utilization, advance reporting.
Various Stages Of Operation Management Ppt Slide
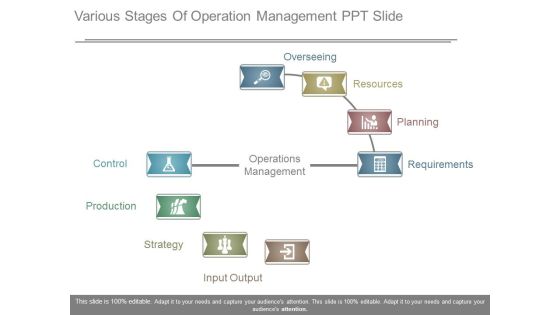
This is a various stages of operation management ppt slide. This is a eight stage process. The stages in this process are operation management, requirements, planning, resources, overseeing, input output, designing, strategy, production, control.

Measures Of Contingency Planning Ppt Powerpoint Slides Rules
This is a measures of contingency planning ppt powerpoint slides rules. This is a four stage process. The stages in this process are available resources, recovery measures, protective measures, residual risk, life cycle.
Vision Of Corporate Identity Sample Diagram Presentation Powerpoint
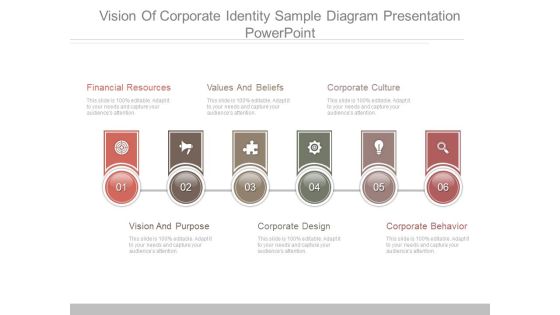
This is a vision of corporate identity sample diagram presentation powerpoint. This is a six stage process. The stages in this process are financial resources, values and beliefs, corporate culture, vision and purpose, corporate design, corporate behavior.

Joint Working Sustainability Development Powerpoint Slide Designs
This is a joint working sustainability development powerpoint slide designs. This is a five stage process. The stages in this process are joint working, equal opportunity, sustainability development, sound management of resources, strategic and operational level.

Authorize Self Administration Diagram Ppt Model
This is a authorize self administration diagram ppt model. This is a eight stage process. The stages in this process are plan, implement, communicate, incorporate, capability, behavior, process, resources.

Strategy Analytics Template Ppt Ideas
This is a strategy analytics template ppt ideas. This is a five stage process. The stages in this process are tools and techniques, business context, challenge demand, resource optimisation, operational efficiency.

Core Business Processes Diagram Ppt Examples
This is a core business processes diagram ppt examples. This is a eight stage process. The stages in this process are development, distribution, human resource, sales, initiation, accounting, design, stabilization.
Product Substitution In Business Template Ppt Slides Examples
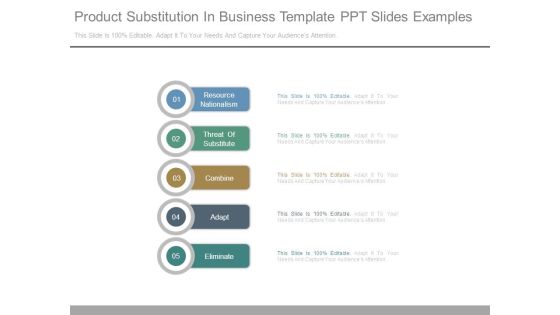
This is a product substitution in business template ppt slides examples. This is a five stage process. The stages in this process are resource nationalism, threat of substitute, combine, adapt, eliminate.
