Manufacturing Kpi
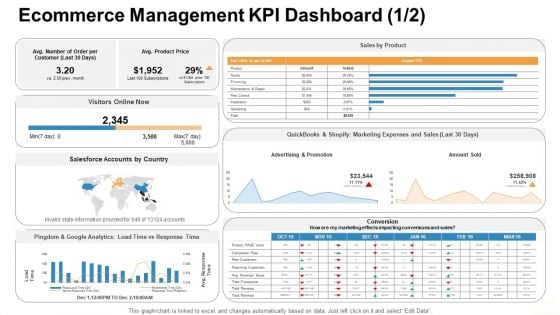
Ecommerce Management KPI Dashboard Sales Ppt Model Visual Aids PDF
This is a ecommerce management kpi dashboard sales ppt model visual aids pdf. template with various stages. Focus and dispense information on four stages using this creative set, that comes with editable features. It contains large content boxes to add your information on topics like product views per session, gross profit margin, average order value. You can also showcase facts, figures, and other relevant content using this PPT layout. Grab it now.
KPI Dashboard For Tracking Project Team Performance Pictures PDF
Following slide illustrates performance monitoring dashboard that can be used by managers to track their developers team efficiency. It also includes details about billable and non billable hours along with task summary.Deliver an awe inspiring pitch with this creative KPI Dashboard For Tracking Project Team Performance Pictures PDF bundle. Topics like Task Summary, Employee Productivity, Project Manager can be discussed with this completely editable template. It is available for immediate download depending on the needs and requirements of the user.
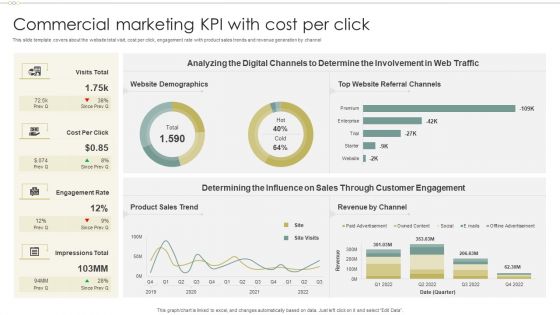
Commercial Marketing KPI With Cost Per Click Guidelines PDF
This slide template covers about the website total visit, cost per click, engagement rate with product sales trends and revenue generation by channel. Pitch your topic with ease and precision using this Commercial Marketing KPI With Cost Per Click Guidelines PDF. This layout presents information on Website Demographics, Referral Channels, Determining Influence. It is also available for immediate download and adjustment. So, changes can be made in the color, design, graphics or any other component to create a unique layout.

KPI Dashboard To Track Amazon Performance Ppt Styles Guidelines PDF
This slide provides information regarding dashboard to monitor Amazon performance. The KPIs include tracking of product sales, conversion rate, advertising spends, session, organic sales, etc. There are so many reasons you need a KPI Dashboard To Track Amazon Performance Ppt Styles Guidelines PDF. The first reason is you can not spend time making everything from scratch, Thus, Slidegeeks has made presentation templates for you too. You can easily download these templates from our website easily.
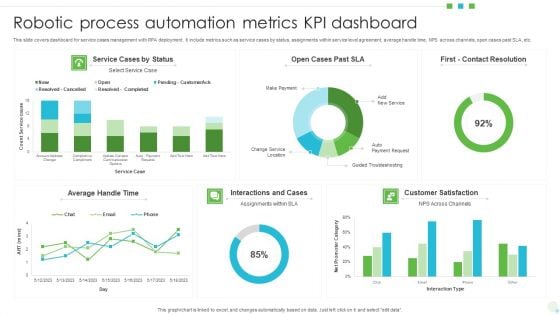
Robotic Process Automation Metrics KPI Dashboard Themes PDF
This slide covers dashboard for service cases management with RPA deployment. It include metrics such as service cases by status, assignments within service level agreement, average handle time, NPS across channels, open cases past SLA, etc. Showcasing this set of slides titled Robotic Process Automation Metrics KPI Dashboard Themes PDF. The topics addressed in these templates are Average, Service Cases, Customer Satisfaction. All the content presented in this PPT design is completely editable. Download it and make adjustments in color, background, font etc. as per your unique business setting.
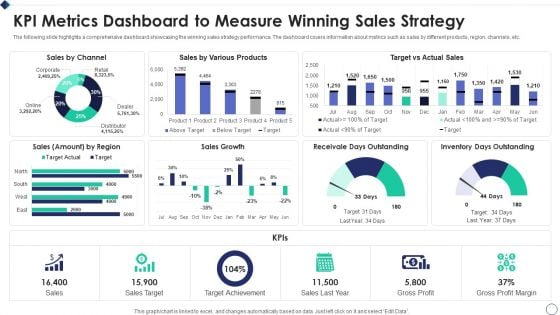
KPI Metrics Dashboard To Measure Winning Sales Strategy Ideas PDF
The following slide highlights a comprehensive dashboard showcasing the winning sales strategy performance. The dashboard covers information about metrics such as sales by different products, region, channels, etc.Showcasing this set of slides titled KPI Metrics Dashboard To Measure Winning Sales Strategy Ideas PDF The topics addressed in these templates are Sales By Channel, Various Products, Inventory Outstanding All the content presented in this PPT design is completely editable. Download it and make adjustments in color, background, font etc. as per your unique business setting.
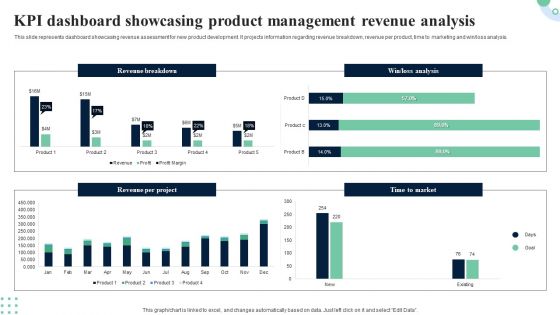
KPI Dashboard Showcasing Product Management Revenue Analysis Portrait PDF
This slide provides dashboard showcasing product development project overview with completion status. It provides information regarding cash flow statements, completion progress, project overview and product approval status. Pitch your topic with ease and precision using this KPI Dashboard Showcasing Product Management Revenue Analysis Portrait PDF. This layout presents information on Completion Progress, Product Approval Status, Cash Flow Statements. It is also available for immediate download and adjustment. So, changes can be made in the color, design, graphics or any other component to create a unique layout.
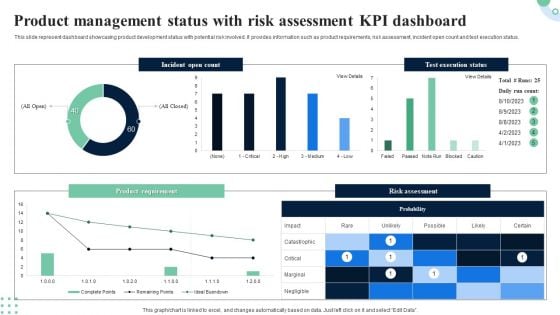
Product Management Status With Risk Assessment KPI Dashboard Professional PDF
This slide represent dashboard showcasing product development status with potential risk involved. It provides information such as product requirements, risk assessment, incident open count and test execution status. Showcasing this set of slides titled Product Management Status With Risk Assessment KPI Dashboard Professional PDF. The topics addressed in these templates are Incident Open Count, Test Execution Status, Product Requirement. All the content presented in this PPT design is completely editable. Download it and make adjustments in color, background, font etc. as per your unique business setting.

Maintenance KPI Dashboard With Production Volume Ppt Gallery Influencers PDF
This slide presents maintenance dashboard which covers quick stats, top products, returned items, downtime causes with quantity ordered, revenues, sold items, active machines, broken machine, missing parts, price, etc. Showcasing this set of slides titled Maintenance KPI Dashboard With Production Volume Ppt Gallery Influencers PDF. The topics addressed in these templates are Top 5 Products, Downtime Causes Missing, Return Items Active. All the content presented in this PPT design is completely editable. Download it and make adjustments in color, background, font etc. as per your unique business setting.
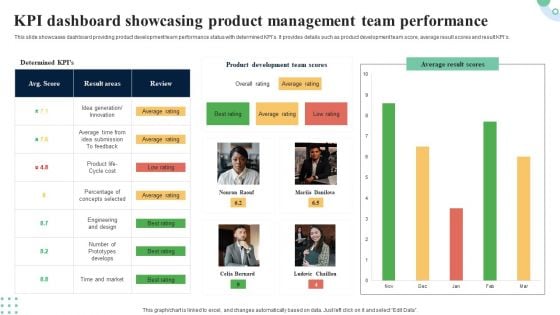
KPI Dashboard Showcasing Product Management Team Performance Demonstration PDF
This slide represents dashboard showcasing revenue assessment for new product development. It projects information regarding revenue breakdown, revenue per product, time to marketing and win or loss analysis. Showcasing this set of slides titled KPI Dashboard Showcasing Product Management Team Performance Demonstration PDF. The topics addressed in these templates are Revenue Per Project, Revenue Breakdown, Loss Analysis. All the content presented in this PPT design is completely editable. Download it and make adjustments in color, background, font etc. as per your unique business setting.
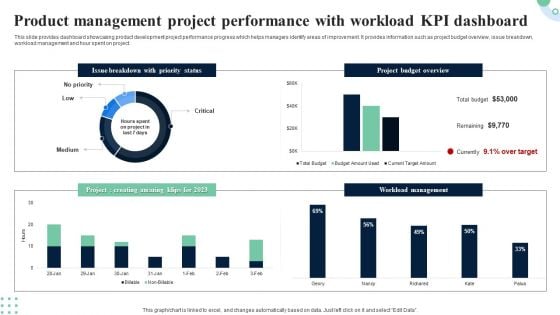
Product Management Project Performance With Workload KPI Dashboard Structure PDF
This slide provides dashboard showcasing product development project performance progress which helps managers identify areas of improvement. It provides information such as project budget overview, issue breakdown, workload management and hour spent on project. Pitch your topic with ease and precision using this Product Management Project Performance With Workload KPI Dashboard Structure PDF. This layout presents information on Project Budget Overview, Workload Management. It is also available for immediate download and adjustment. So, changes can be made in the color, design, graphics or any other component to create a unique layout.
Storage Facility Productivity Tracking KPI Dashboard Graphics PDF
This slide showcases a dashboard for tracking and managing warehouse productivity to optimize logistics operations. It includes key components such as warehouse operating costs, perfect order rate, total shipments by country and on time shipments. Showcasing this set of slides titled Storage Facility Productivity Tracking KPI Dashboard Graphics PDF. The topics addressed in these templates are Warehouse Operating Costs, Perfect Order Rate, Total Shipment Country. All the content presented in this PPT design is completely editable. Download it and make adjustments in color, background, font etc. as per your unique business setting.
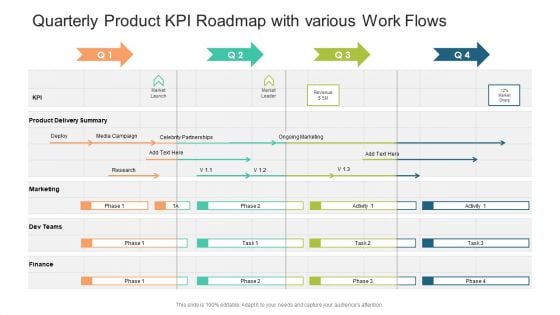
Quarterly Product KPI Roadmap With Various Work Flows Rules PDF
Presenting the quarterly product kpi roadmap with various work flows rules pdf. The template includes a roadmap that can be used to initiate a strategic plan. Not only this, the PowerPoint slideshow is completely editable and you can effortlessly modify the font size, font type, and shapes according to your needs. This PPT slide can be easily reached in standard screen and widescreen aspect ratios. The set is also available in various formats like PDF, PNG, and JPG. So download and use it multiple times as per your knowledge.
Workforce Productivity Tracking Report Kpi Dashboard Icons PDF
The following slide presents the KPAs of project work stream for transparency and better decision making. It includes KPIs such as work stream status, priority check, planned vs actual budget etc. Showcasing this set of slides titled Workforce Productivity Tracking Report Kpi Dashboard Icons PDF. The topics addressed in these templates are Initiation Meeting, Resource Assessment, Technological Analysis. All the content presented in this PPT design is completely editable. Download it and make adjustments in color, background, font etc. as per your unique business setting.
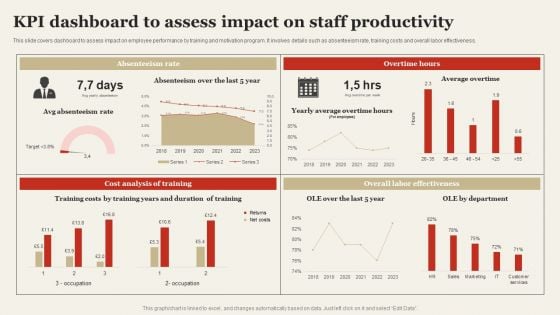
KPI Dashboard To Assess Impact On Staff Productivity Infographics PDF
This slide covers dashboard to assess impact on employee performance by training and motivation program. It involves details such as absenteeism rate, training costs and overall labor effectiveness. Make sure to capture your audiences attention in your business displays with our gratis customizable KPI Dashboard To Assess Impact On Staff Productivity Infographics PDF. These are great for business strategies, office conferences, capital raising or task suggestions. If you desire to acquire more customers for your tech business and ensure they stay satisfied, create your own sales presentation with these plain slides.
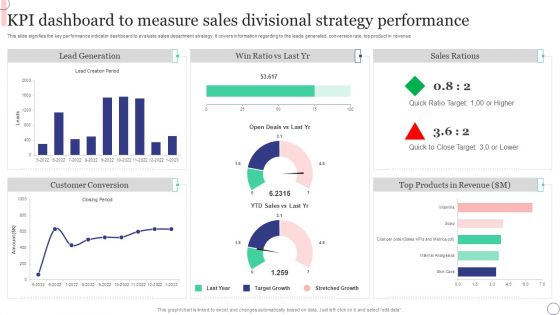
KPI Dashboard To Measure Sales Divisional Strategy Performance Microsoft PDF
This slide signifies the key performance indicator dashboard to evaluate sales department strategy. It covers information regarding to the leads generated, conversion rate, top product in revenue. Pitch your topic with ease and precision using this KPI Dashboard To Measure Sales Divisional Strategy Performance Microsoft PDF. This layout presents information on Sales Rations, Lead Generation, Customer Conversion. It is also available for immediate download and adjustment. So, changes can be made in the color, design, graphics or any other component to create a unique layout.
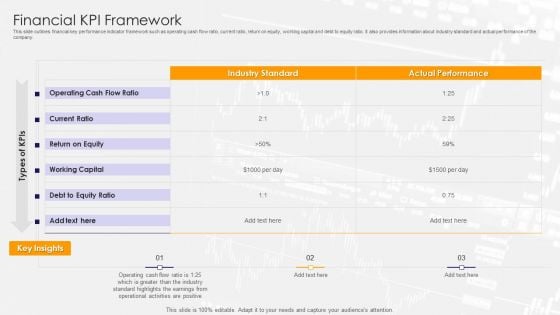
Financial KPI Framework Ppt PowerPoint Presentation Gallery Show PDF
This slide outlines financial key performance indicator framework such as operating cash flow ratio, current ratio, return on equity, working capital and debt to equity ratio. It also provides information about industry standard and actual performance of the company. Showcasing this set of slides titled financial kpi framework ppt powerpoint presentation gallery show pdf. The topics addressed in these templates are current ratio, working capital, equity. All the content presented in this PPT design is completely editable. Download it and make adjustments in color, background, font etc. as per your unique business setting.
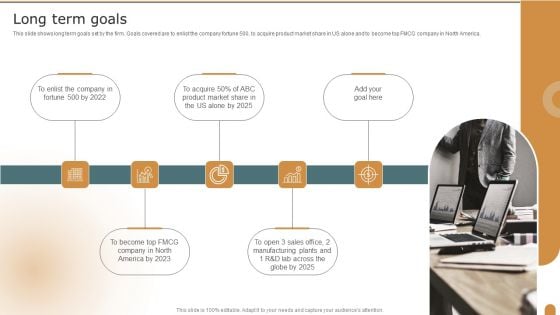
Long Term Goals Company Performance Evaluation Using KPI Portrait PDF
This slide shows long term goals set by the firm. Goals covered are to enlist the company fortune 500, to acquire product market share in US alone and to become top FMCG company in North America. This is a Long Term Goals Company Performance Evaluation Using KPI Portrait PDF template with various stages. Focus and dispense information on five stages using this creative set, that comes with editable features. It contains large content boxes to add your information on topics like Long Term Goals, Company, Product Market. You can also showcase facts, figures, and other relevant content using this PPT layout. Grab it now.
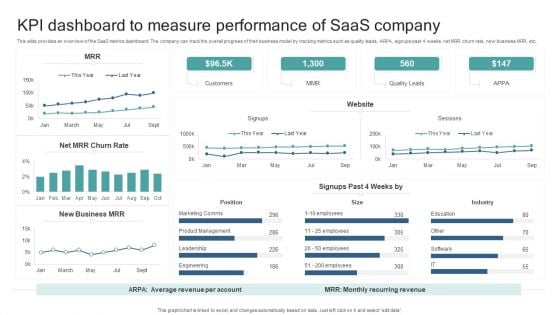
KPI Dashboard To Measure Performance Of Saas Company Introduction PDF
This slide provides an overview of the SaaS metrics dashboard. The company can track the overall progress of their business model by tracking metrics such as quality leads, ARPA, signups past 4 weeks, net MRR churn rate, new business MRR, etc. Pitch your topic with ease and precision using this KPI Dashboard To Measure Performance Of Saas Company Introduction PDF. This layout presents information on Industry, Position, Customers, Quality Leads. It is also available for immediate download and adjustment. So, changes can be made in the color, design, graphics or any other component to create a unique layout.
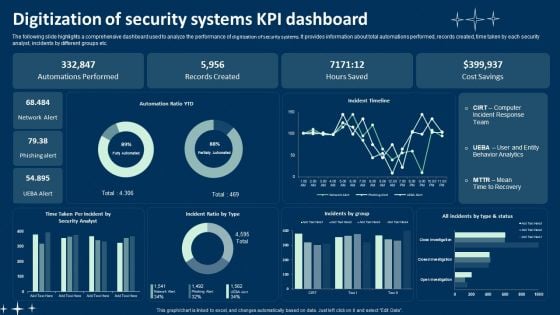
Digitization Of Security Systems KPI Dashboard Ppt Summary Portfolio PDF
The following slide highlights a comprehensive dashboard used to analyze the performance of digitization of security systems. It provides information about total automations performed, records created, time taken by each security analyst, incidents by different groups etc. Showcasing this set of slides titled Digitization Of Security Systems KPI Dashboard Ppt Summary Portfolio PDF. The topics addressed in these templates are Automations Performed, Records Created, Hours Saved. All the content presented in this PPT design is completely editable. Download it and make adjustments in color, background, font etc. as per your unique business setting.
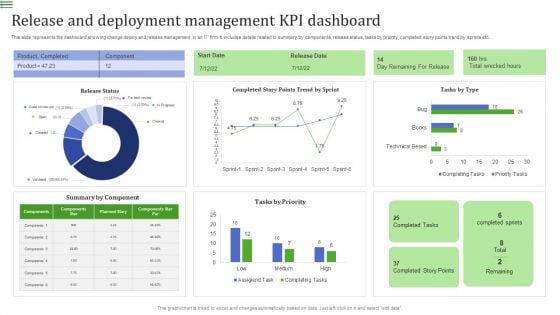
Release And Deployment Management KPI Dashboard Summary PDF
This slide represents the dashboard showing change deploy and release management in an IT firm. It includes details related to summary by components, release status, tasks by priority, completed story points trend by sprints etc.Showcasing this set of slides titled Release And Deployment Management KPI Dashboard Summary PDF. The topics addressed in these templates are Product Completed, Summary Component, Completed Story. All the content presented in this PPT design is completely editable. Download it and make adjustments in color, background, font etc. as per your unique business setting.
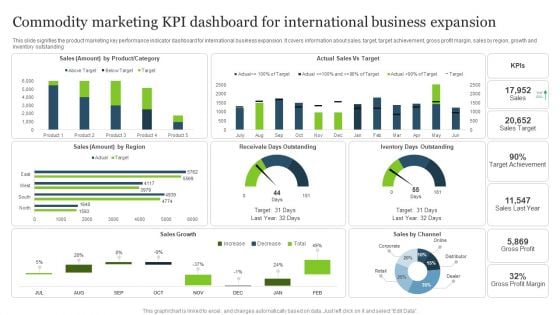
Commodity Marketing KPI Dashboard For International Business Expansion Formats PDF
This slide signifies the product marketing key performance indicator dashboard for international business expansion. It covers information about sales, target, target achievement, gross profit margin, sales by region, growth and inventory outstanding.Pitch your topic with ease and precision using this Commodity Marketing KPI Dashboard For International Business Expansion Formats PDF. This layout presents information on Target Achievement, Receivale Days, Gross Profit. It is also available for immediate download and adjustment. So, changes can be made in the color, design, graphics or any other component to create a unique layout.
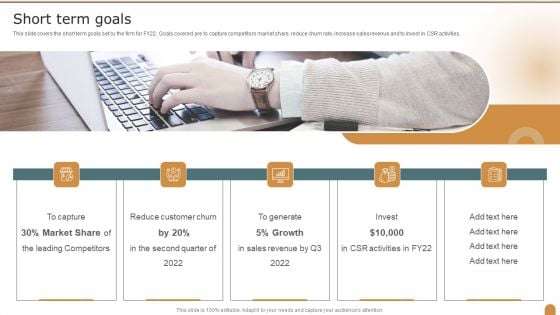
Short Term Goals Company Performance Evaluation Using KPI Themes PDF
This slide covers the short term goals set by the firm for FY22. Goals covered are to capture competitors market share, reduce churn rate, increase sales revenue and to invest in CSR activities. This is a Short Term Goals Company Performance Evaluation Using KPI Themes PDF template with various stages. Focus and dispense information on five stages using this creative set, that comes with editable features. It contains large content boxes to add your information on topics like Market Share, Customer Churn, Revenue. You can also showcase facts, figures, and other relevant content using this PPT layout. Grab it now.

Workforce Performance KPI Scorecard To Measure Employee Performance Formats PDF
Mentioned slide outlines a comprehensive scorecard which can assist HR to measure the overall performance of employees by tracking various KPIs. The KPIs could be employment compensation culture and performance. Showcasing this set of slides titled Workforce Performance KPI Scorecard To Measure Employee Performance Formats PDF. The topics addressed in these templates are Industry Standard, Satisfaction Index, Performance Standards. All the content presented in this PPT design is completely editable. Download it and make adjustments in color, background, font etc. as per your unique business setting.

KPI Dashboard Highlighting Marketing Campaign Results Mockup PDF
The purpose of this slide is to highlight a comprehensive dashboard which can assist the organization to evaluate the marketing campaign results. The dashboard covers information about sales performance, product performance, ecommerce conversion rate, etc. Showcasing this set of slides titled KPI Dashboard Highlighting Marketing Campaign Results Mockup PDF. The topics addressed in these templates are Sales Performance, Product Performance Analysis. All the content presented in this PPT design is completely editable. Download it and make adjustments in color, background, font etc. as per your unique business setting.
IT Project Management Progress Tracking KPI Dashboard Template PDF
This slide provides IT project development dashboard which helps managers performance status. It provides information regarding team velocity, work in story points, product estimation status, closed story point vs epic story point and pending story points. Showcasing this set of slides titled IT Project Management Progress Tracking KPI Dashboard Template PDF. The topics addressed in these templates are Team Velocity, Product Estimation Status, Pending Story Points. All the content presented in this PPT design is completely editable. Download it and make adjustments in color, background, font etc. as per your unique business setting.
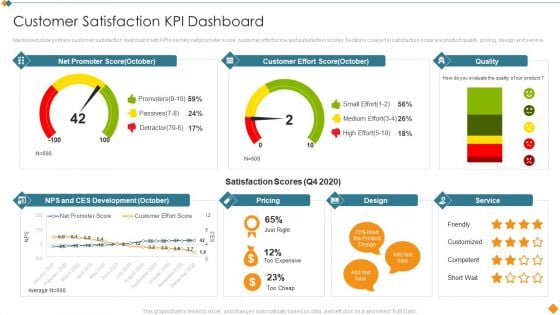
Maintaining Partner Relationships Customer Satisfaction KPI Dashboard Inspiration PDF
Mentioned slide portrays customer satisfaction dashboard with KPIs namely net promoter score, customer effort score and satisfaction scores. Sections covered in satisfaction score are product quality, pricing, design and service. Deliver and pitch your topic in the best possible manner with this Maintaining Partner Relationships Customer Satisfaction KPI Dashboard Inspiration PDF. Use them to share invaluable insights on Net Promoter Score, Customer Effort Score, Quality, Service, Pricing and impress your audience. This template can be altered and modified as per your expectations. So, grab it now.
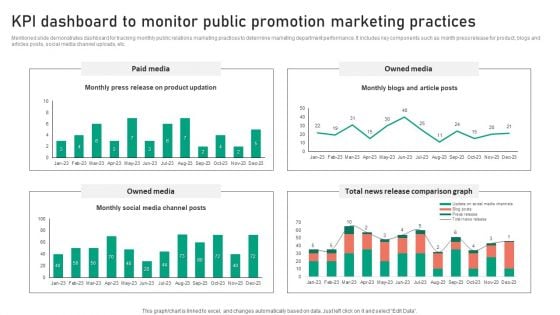
KPI Dashboard To Monitor Public Promotion Marketing Practices Template PDF
Mentioned slide demonstrates dashboard for tracking monthly public relations marketing practices to determine marketing department performance. It includes key components such as month press release for product, blogs and articles posts, social media channel uploads, etc. Pitch your topic with ease and precision using this KPI Dashboard To Monitor Public Promotion Marketing Practices Template PDF. This layout presents information on Paid Media, Owned Media, Total News Release, Comparison Graph. It is also available for immediate download and adjustment. So, changes can be made in the color, design, graphics or any other component to create a unique layout.
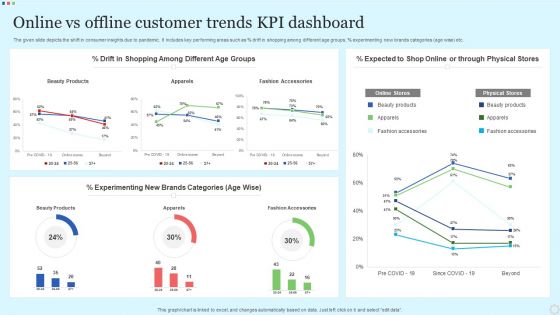
Online Vs Offline Customer Trends Kpi Dashboard Rules PDF
The given slide depicts the shift in consumer insights due to pandemic. It includes key performing areas such as percent drift in shopping among different age groups, percent experimenting new brands categories age wise etc. Showcasing this set of slides titled Online Vs Offline Customer Trends Kpi Dashboard Rules PDF. The topics addressed in these templates are Beauty Products, Apparels, Fashion Accessories. All the content presented in this PPT design is completely editable. Download it and make adjustments in color, background, font etc. as per your unique business setting.
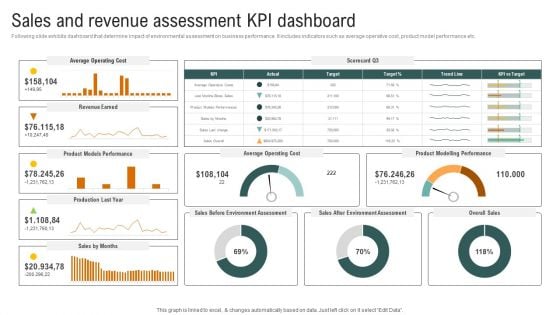
Sales And Revenue Assessment Kpi Dashboard Brochure PDF
Following slide exhibits dashboard that determine impact of environmental assessment on business performance. It includes indicators such as average operative cost, product model performance etc. If your project calls for a presentation, then Slidegeeks is your go-to partner because we have professionally designed, easy-to-edit templates that are perfect for any presentation. After downloading, you can easily edit Sales And Revenue Assessment Kpi Dashboard Brochure PDF and make the changes accordingly. You can rearrange slides or fill them with different images. Check out all the handy templates

Organizational Manpower Kpi Dashboard Employees Ppt PowerPoint Presentation Complete Deck
This organizational manpower kpi dashboard employees ppt powerpoint presentation complete deck acts as backup support for your ideas, vision, thoughts, etc. Use it to present a thorough understanding of the topic. This PPT slideshow can be utilized for both in-house and outside presentations depending upon your needs and business demands. Entailing twelve slides with a consistent design and theme, this template will make a solid use case. As it is intuitively designed, it suits every business vertical and industry. All you have to do is make a few tweaks in the content or any other component to design unique presentations. The biggest advantage of this complete deck is that it can be personalized multiple times once downloaded. The color, design, shapes, and other elements are free to modify to add personal touches. You can also insert your logo design in this PPT layout. Therefore a well-thought and crafted presentation can be delivered with ease and precision by downloading this organizational manpower kpi dashboard employees ppt powerpoint presentation complete deck PPT slideshow.

JIRA KPI Dashboard Ppt PowerPoint Presentation Complete Deck With Slides
This jira kpi dashboard ppt powerpoint presentation complete deck with slides acts as backup support for your ideas, vision, thoughts, etc. Use it to present a thorough understanding of the topic. This PPT slideshow can be utilized for both in-house and outside presentations depending upon your needs and business demands. Entailing sixteen slides with a consistent design and theme, this template will make a solid use case. As it is intuitively designed, it suits every business vertical and industry. All you have to do is make a few tweaks in the content or any other component to design unique presentations. The biggest advantage of this complete deck is that it can be personalized multiple times once downloaded. The color, design, shapes, and other elements are free to modify to add personal touches. You can also insert your logo design in this PPT layout. Therefore a well-thought and crafted presentation can be delivered with ease and precision by downloading this jira kpi dashboard ppt powerpoint presentation complete deck with slides PPT slideshow.
SLA KPI Dashboard Ppt PowerPoint Presentation Complete Deck With Slides
This SLA KPI Dashboard Ppt PowerPoint Presentation Complete Deck With Slides acts as backup support for your ideas, vision, thoughts, etc. Use it to present a thorough understanding of the topic. This PPT slideshow can be utilized for both in-house and outside presentations depending upon your needs and business demands. Entailing twelve slides with a consistent design and theme, this template will make a solid use case. As it is intuitively designed, it suits every business vertical and industry. All you have to do is make a few tweaks in the content or any other component to design unique presentations. The biggest advantage of this complete deck is that it can be personalized multiple times once downloaded. The color, design, shapes, and other elements are free to modify to add personal touches. You can also insert your logo design in this PPT layout. Therefore a well-thought and crafted presentation can be delivered with ease and precision by downloading this SLA KPI Dashboard Ppt PowerPoint Presentation Complete Deck With Slides PPT slideshow.

Firm KPI Dashboard Ppt PowerPoint Presentation Complete Deck With Slides
Boost your confidence and team morale with this well-structured Firm KPI Dashboard Ppt PowerPoint Presentation Complete Deck With Slides. This prefabricated set gives a voice to your presentation because of its well-researched content and graphics. Our experts have added all the components very carefully, thus helping you deliver great presentations with a single click. Not only that, it contains a set of twelve slides that are designed using the right visuals, graphics, etc. Various topics can be discussed, and effective brainstorming sessions can be conducted using the wide variety of slides added in this complete deck. Apart from this, our PPT design contains clear instructions to help you restructure your presentations and create multiple variations. The color, format, design anything can be modified as deemed fit by the user. Not only this, it is available for immediate download. So, grab it now.

Product KPI Scorecard Ppt PowerPoint Presentation Complete With Slides
Improve your presentation delivery using this Product KPI Scorecard Ppt PowerPoint Presentation Complete With Slides. Support your business vision and objectives using this well-structured PPT deck. This template offers a great starting point for delivering beautifully designed presentations on the topic of your choice. Comprising tweleve this professionally designed template is all you need to host discussion and meetings with collaborators. Each slide is self-explanatory and equipped with high-quality graphics that can be adjusted to your needs. Therefore, you will face no difficulty in portraying your desired content using this PPT slideshow. This PowerPoint slideshow contains every important element that you need for a great pitch. It is not only editable but also available for immediate download and utilization. The color, font size, background, shapes everything can be modified to create your unique presentation layout. Therefore, download it now.
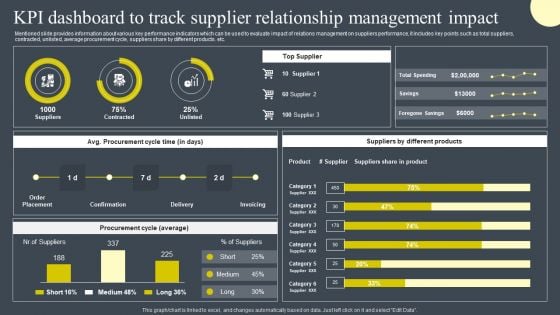
KPI Dashboard To Track Supplier Relationship Management Impact Inspiration PDF
Mentioned slide provides information about various key performance indicators which can be used to evaluate impact of relations management on suppliers performance, it includes key points such as total suppliers, contracted, unlisted, average procurement cycle, suppliers share by different products. etc. Slidegeeks has constructed KPI Dashboard To Track Supplier Relationship Management Impact Inspiration PDF after conducting extensive research and examination. These presentation templates are constantly being generated and modified based on user preferences and critiques from editors. Here, you will find the most attractive templates for a range of purposes while taking into account ratings and remarks from users regarding the content. This is an excellent jumping-off point to explore our content and will give new users an insight into our top-notch PowerPoint Templates.
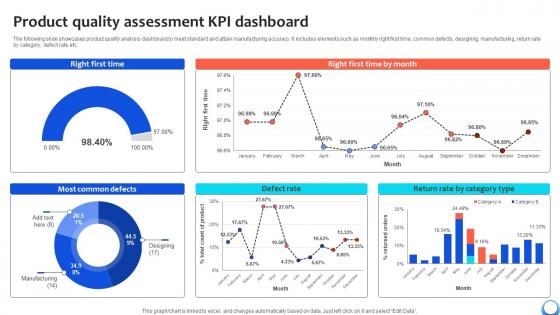
Product Quality Assessment KPI Dashboard Automating Production Process Strategy SS V
The following slide showcases product quality analysis dashboard to meet standard and attain manufacturing accuracy. It includes elements such as monthly right first time, common defects, designing, manufacturing, return rate by category, defect rate etc. Take your projects to the next level with our ultimate collection of Product Quality Assessment KPI Dashboard Automating Production Process Strategy SS V. Slidegeeks has designed a range of layouts that are perfect for representing task or activity duration, keeping track of all your deadlines at a glance. Tailor these designs to your exact needs and give them a truly corporate look with your own brand colors they will make your projects stand out from the rest The following slide showcases product quality analysis dashboard to meet standard and attain manufacturing accuracy. It includes elements such as monthly right first time, common defects, designing, manufacturing, return rate by category, defect rate etc.
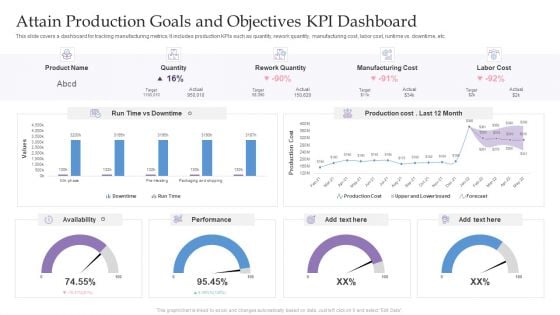
Attain Production Goals And Objectives KPI Dashboard Ppt Pictures Graphics PDF
This slide covers a dashboard for tracking manufacturing metrics. It includes production KPIs such as quantity, rework quantity, manufacturing cost, labor cost, runtime vs. downtime, etc. Showcasing this set of slides titled Attain Production Goals And Objectives KPI Dashboard Ppt Pictures Graphics PDF. The topics addressed in these templates are Product Name, Quantity, Rework Quantity, Manufacturing Cost. All the content presented in this PPT design is completely editable. Download it and make adjustments in color, background, font etc. as per your unique business setting.
Precooked Food Industry Analysis KPI Dashboard For Tracking Supply Chain Costs Diagrams PDF
This slide represents the KPI dashboard to track the multiple cost associated with supply chain in food manufacturing industry. It includes information regarding cash to cash cycle in days, carry cost of inventory along with details of net sales.Deliver an awe inspiring pitch with this creative Precooked Food Industry Analysis KPI Dashboard For Tracking Supply Chain Costs Diagrams PDF bundle. Topics like Processing Industry, Food Processing, Manufacturing Industry can be discussed with this completely editable template. It is available for immediate download depending on the needs and requirements of the user.
All About HRM Human Resources KPI Dashboard Sales Ppt Icon Deck PDF
Presenting this set of slides with name all about hrm human resources kpi dashboard sales ppt icon deck pdf. The topics discussed in these slides are manufacturing department, sales department, engineering department, financial department. This is a completely editable PowerPoint presentation and is available for immediate download. Download now and impress your audience.
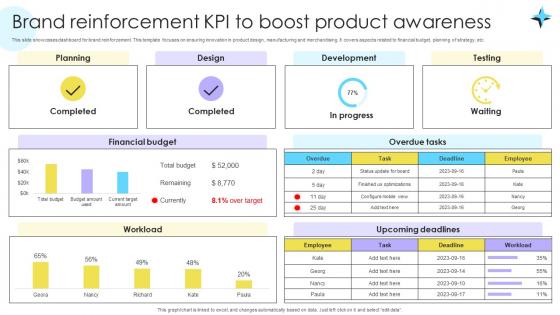
Brand Reinforcement KPI To Boost Product Encouraging Repetitive Customer Purchase Ppt Presentation
This slide showcases dashboard for brand reinforcement. This template focuses on ensuring innovation in product design, manufacturing and merchandising. It covers aspects related to financial budget, planning of strategy, etc. Want to ace your presentation in front of a live audience Our Brand Reinforcement KPI To Boost Product Encouraging Repetitive Customer Purchase Ppt Presentation can help you do that by engaging all the users towards you. Slidegeeks experts have put their efforts and expertise into creating these impeccable powerpoint presentations so that you can communicate your ideas clearly. Moreover, all the templates are customizable, and easy-to-edit and downloadable. Use these for both personal and commercial use. This slide showcases dashboard for brand reinforcement. This template focuses on ensuring innovation in product design, manufacturing and merchandising. It covers aspects related to financial budget, planning of strategy, etc.
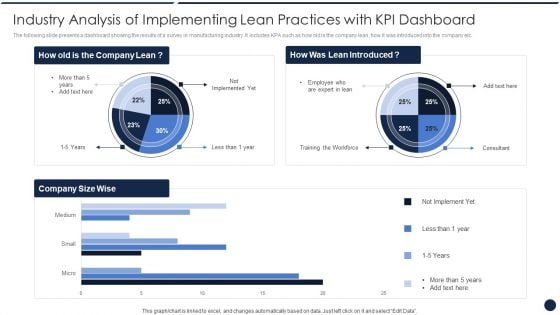
Industry Analysis Of Implementing Lean Practices With KPI Dashboard Sample PDF
The following slide presents a dashboard showing the results of a survey in manufacturing industry. It includes KPA such as how old is the company lean, how it was introduced into the company etc. Showcasing this set of slides titled Industry Analysis Of Implementing Lean Practices With KPI Dashboard Sample PDF The topics addressed in these templates are Industry Analysis, Implementing Lean, Practices With KPI Dashboard All the content presented in this PPT design is completely editable. Download it and make adjustments in color, background, font etc. as per your unique business setting.
KPI Dashboard For Tracking Supply Chain Costs Industry Analysis Of Food Formats PDF
This slide represents the KPI dashboard to track the multiple cost associated with supply chain in food manufacturing industry. It includes information regarding cash to cash cycle in days, carry cost of inventory along with details of net sales.Find a pre-designed and impeccable KPI Dashboard For Tracking Supply Chain Costs Industry Analysis Of Food Formats PDF. The templates can ace your presentation without additional effort. You can download these easy-to-edit presentation templates to make your presentation stand out from others. So, what are you waiting for Download the template from Slidegeeks today and give a unique touch to your presentation.
Weekly KPI Attain Production Goals And Objectives Chart Ppt Icon Graphics Template PDF
This slide showcases the manufacturing target achievement table. It can be used for evaluating the variance between actual and estimated KPIs such as throughput rate, inventory turns, scarp rate, etc. Showcasing this set of slides titled Weekly KPI Attain Production Goals And Objectives Chart Ppt Icon Graphics Template PDF. The topics addressed in these templates are Target, KPI, Inventory Turns. All the content presented in this PPT design is completely editable. Download it and make adjustments in color, background, font etc. as per your unique business setting.
KPI Dashboard For Tracking Supply Chain Costs Ppt Summary Templates PDF
This slide represents the KPI dashboard to track the multiple cost associated with supply chain in food manufacturing industry. It includes information regarding cash to cash cycle in days, carry cost of inventory along with details of net sales. Deliver an awe inspiring pitch with this creative KPI Dashboard For Tracking Supply Chain Costs Ppt Summary Templates PDF bundle. Topics like Supply Chain, Costs vs Sales, Carrying Costs Inventory, Supply Chain Costs can be discussed with this completely editable template. It is available for immediate download depending on the needs and requirements of the user.
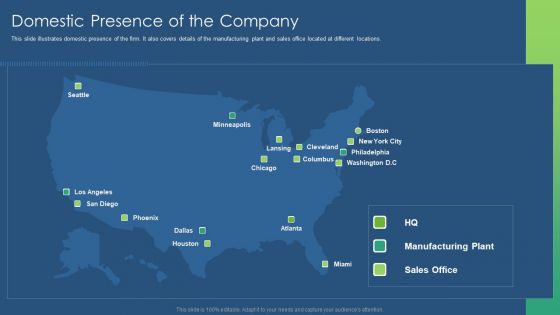
Sustainability Calculation With KPI Domestic Presence Of The Company Ppt PowerPoint Presentation File Introduction PDF
This slide illustrates domestic presence of the firm. It also covers details of the manufacturing plant and sales office located at different locations. This is a sustainability calculation with kpi domestic presence of the company ppt powerpoint presentation file introduction pdf template with various stages. Focus and dispense information on one stages using this creative set, that comes with editable features. It contains large content boxes to add your information on topics like domestic presence of the company. You can also showcase facts, figures, and other relevant content using this PPT layout. Grab it now.

Domestic Presence Of The Company Company Performance Evaluation Using KPI Demonstration PDF
This slide illustrates domestic presence of the firm. It also covers details of the manufacturing plant and sales office located at different locations. This is a Domestic Presence Of The Company Company Performance Evaluation Using KPI Demonstration PDF template with various stages. Focus and dispense information on one stage using this creative set, that comes with editable features. It contains large content boxes to add your information on topics like Domestic Presence, Company. You can also showcase facts, figures, and other relevant content using this PPT layout. Grab it now.
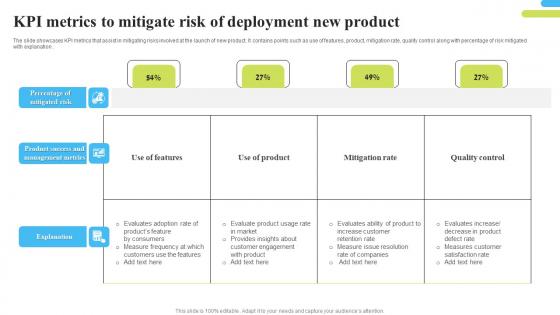
Kpi Metrics To Mitigate Risk Of Deployment New Product Themes Pdf
The slide showcases KPI metrics that assist in mitigating risks involved at the launch of new product. It contains points such as use of features, product, mitigation rate, quality control along with percentage of risk mitigated with explanation. Showcasing this set of slides titled Kpi Metrics To Mitigate Risk Of Deployment New Product Themes Pdf. The topics addressed in these templates are KPI Metrics To Mitigate Risk, Deployment New Product, Quality Control. All the content presented in this PPT design is completely editable. Download it and make adjustments in color, background, font etc. as per your unique business setting. The slide showcases KPI metrics that assist in mitigating risks involved at the launch of new product. It contains points such as use of features, product, mitigation rate, quality control along with percentage of risk mitigated with explanation.

Brand Extension Techniques KPI Dashboard To Track Product Performance Strategy SS V
This slide represents KPI dashboard for measuring product performance. It covers total activities, new customers, events, net promoter score. Formulating a presentation can take up a lot of effort and time, so the content and message should always be the primary focus. The visuals of the PowerPoint can enhance the presenters message, so our Brand Extension Techniques KPI Dashboard To Track Product Performance Strategy SS V was created to help save time. Instead of worrying about the design, the presenter can concentrate on the message while our designers work on creating the ideal templates for whatever situation is needed. Slidegeeks has experts for everything from amazing designs to valuable content, we have put everything into Brand Extension Techniques KPI Dashboard To Track Product Performance Strategy SS V This slide represents KPI dashboard for measuring product performance. It covers total activities, new customers, events, net promoter score.

Marketing Growth Strategy KPI Dashboard To Evaluate Sales Performance Strategy SS V
The following slide outlines key performance indicator KPI dashboard to monitor sales performance of company. The key metrics covered in slide are total sales by location, monthly sales trend, average revenue AR by clients, etc. This Marketing Growth Strategy KPI Dashboard To Evaluate Sales Performance Strategy SS V is perfect for any presentation, be it in front of clients or colleagues. It is a versatile and stylish solution for organizing your meetings. The Marketing Growth Strategy KPI Dashboard To Evaluate Sales Performance Strategy SS V features a modern design for your presentation meetings. The adjustable and customizable slides provide unlimited possibilities for acing up your presentation. Slidegeeks has done all the homework before launching the product for you. So, do not wait, grab the presentation templates today The following slide outlines key performance indicator KPI dashboard to monitor sales performance of company. The key metrics covered in slide are total sales by location, monthly sales trend, average revenue AR by clients, etc.
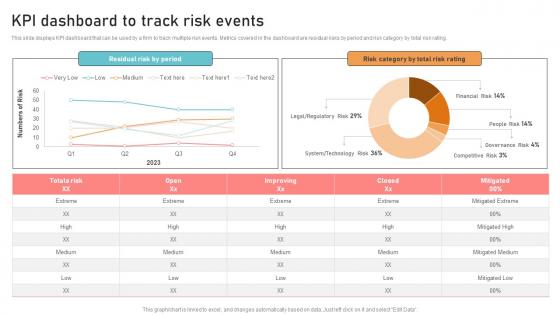
Optimizing Business Integration KPI Dashboard To Track Risk Events Designs Pdf
This slide displays KPI dashboard that can be used by a firm to track multiple risk events. Metrics covered in the dashboard are residual risks by period and risk category by total risk rating. Crafting an eye catching presentation has never been more straightforward. Let your presentation shine with this tasteful yet straightforward Optimizing Business Integration KPI Dashboard To Track Risk Events Designs Pdf template. It offers a minimalistic and classy look that is great for making a statement. The colors have been employed intelligently to add a bit of playfulness while still remaining professional. Construct the ideal Optimizing Business Integration KPI Dashboard To Track Risk Events Designs Pdf that effortlessly grabs the attention of your audience. Begin now and be certain to wow your customers. This slide displays KPI dashboard that can be used by a firm to track multiple risk events. Metrics covered in the dashboard are residual risks by period and risk category by total risk rating.
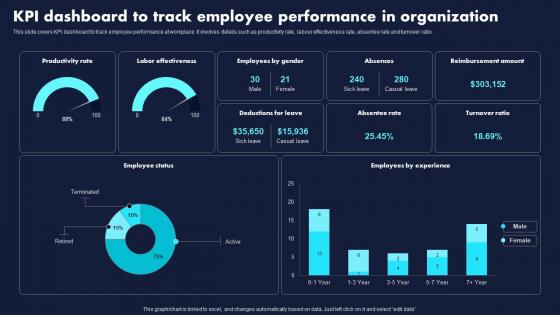
KPI Dashboard To Track Employee Performance Proven Techniques For Enhancing Formats Pdf
This slide covers KPI dashboard to track employee performance at workplace. It involves details such as productivity rate, labour effectiveness rate, absentee rate and turnover ratio.Whether you have daily or monthly meetings, a brilliant presentation is necessary. KPI Dashboard To Track Employee Performance Proven Techniques For Enhancing Formats Pdf can be your best option for delivering a presentation. Represent everything in detail using KPI Dashboard To Track Employee Performance Proven Techniques For Enhancing Formats Pdf and make yourself stand out in meetings. The template is versatile and follows a structure that will cater to your requirements. All the templates prepared by Slidegeeks are easy to download and edit. Our research experts have taken care of the corporate themes as well. So, give it a try and see the results. This slide covers KPI dashboard to track employee performance at workplace. It involves details such as productivity rate, labour effectiveness rate, absentee rate and turnover ratio.
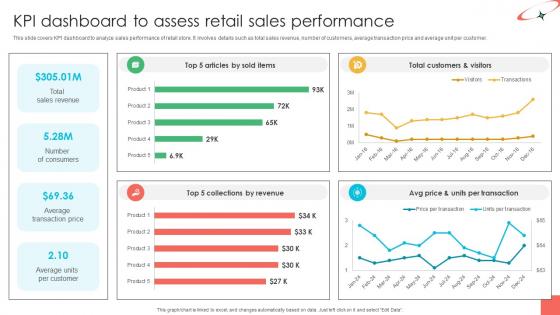
Marketing Strategies For Effective KPI Dashboard To Assess Retail Sales Performance
This slide covers KPI dashboard to analyze sales performance of retail store. It involves details such as total sales revenue, number of customers, average transaction price and average unit per customer. This Marketing Strategies For Effective KPI Dashboard To Assess Retail Sales Performance is perfect for any presentation, be it in front of clients or colleagues. It is a versatile and stylish solution for organizing your meetings. The Marketing Strategies For Effective KPI Dashboard To Assess Retail Sales Performance features a modern design for your presentation meetings. The adjustable and customizable slides provide unlimited possibilities for acing up your presentation. Slidegeeks has done all the homework before launching the product for you. So, do not wait, grab the presentation templates today This slide covers KPI dashboard to analyze sales performance of retail store. It involves details such as total sales revenue, number of customers, average transaction price and average unit per customer.
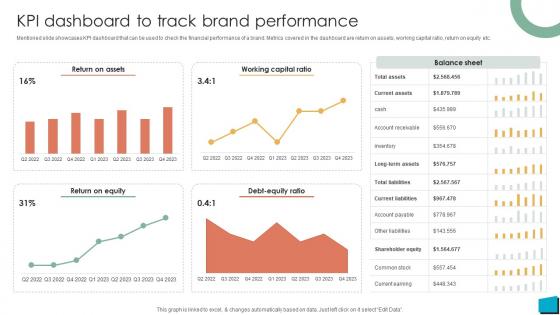
Brand Authority KPI Dashboard To Track Brand Performance Strategy SS V
Mentioned slide showcases KPI dashboard that can be used to check the financial performance of a brand. Metrics covered in the dashboard are return on assets, working capital ratio, return on equity etc. This Brand Authority KPI Dashboard To Track Brand Performance Strategy SS V is perfect for any presentation, be it in front of clients or colleagues. It is a versatile and stylish solution for organizing your meetings. The Brand Authority KPI Dashboard To Track Brand Performance Strategy SS V features a modern design for your presentation meetings. The adjustable and customizable slides provide unlimited possibilities for acing up your presentation. Slidegeeks has done all the homework before launching the product for you. So, do not wait, grab the presentation templates today Mentioned slide showcases KPI dashboard that can be used to check the financial performance of a brand. Metrics covered in the dashboard are return on assets, working capital ratio, return on equity etc.
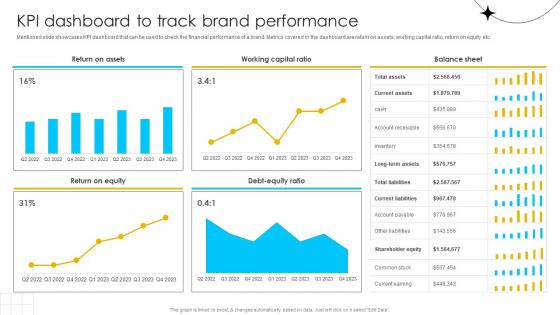
Brand Influence KPI Dashboard To Track Brand Performance Strategy SS V
Mentioned slide showcases KPI dashboard that can be used to check the financial performance of a brand. Metrics covered in the dashboard are return on assets, working capital ratio, return on equity etc. This Brand Influence KPI Dashboard To Track Brand Performance Strategy SS V is perfect for any presentation, be it in front of clients or colleagues. It is a versatile and stylish solution for organizing your meetings. The Brand Influence KPI Dashboard To Track Brand Performance Strategy SS V features a modern design for your presentation meetings. The adjustable and customizable slides provide unlimited possibilities for acing up your presentation. Slidegeeks has done all the homework before launching the product for you. So, do not wait, grab the presentation templates today Mentioned slide showcases KPI dashboard that can be used to check the financial performance of a brand. Metrics covered in the dashboard are return on assets, working capital ratio, return on equity etc.
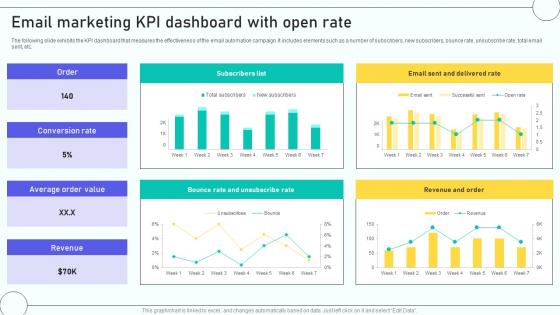
A4 Email Marketing Automation Process To Email Marketing KPI Dashboard With Open Rate
The following slide exhibits the KPI dashboard that measures the effectiveness of the email automation campaign. It includes elements such as a number of subscribers, new subscribers, bounce rate, unsubscribe rate, total email sent, etc. Slidegeeks is one of the best resources for PowerPoint templates. You can download easily and regulate A4 Email Marketing Automation Process To Email Marketing KPI Dashboard With Open Rate for your personal presentations from our wonderful collection. A few clicks is all it takes to discover and get the most relevant and appropriate templates. Use our Templates to add a unique zing and appeal to your presentation and meetings. All the slides are easy to edit and you can use them even for advertisement purposes. The following slide exhibits the KPI dashboard that measures the effectiveness of the email automation campaign. It includes elements such as a number of subscribers, new subscribers, bounce rate, unsubscribe rate, total email sent, etc.
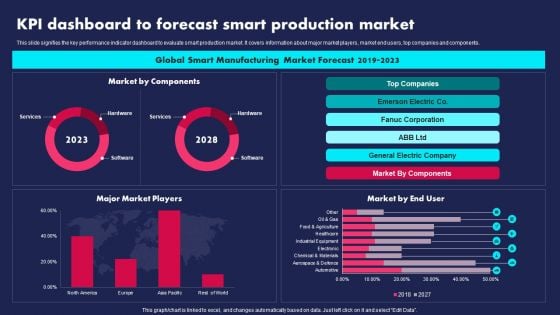
KPI Dashboard To Forecast Smart Production Market Ppt PowerPoint Presentation Gallery Visual Aids PDF
This slide signifies the key performance indicator dashboard to evaluate smart production market. It covers information about major market players, market end users, top companies and components. Pitch your topic with ease and precision using this KPI Dashboard To Forecast Smart Production Market Ppt PowerPoint Presentation Gallery Visual Aids PDF. This layout presents information on Global Smart Manufacturing, Market Forecast, 2019 To 2023. It is also available for immediate download and adjustment. So, changes can be made in the color, design, graphics or any other component to create a unique layout.
Kpi Dashboard For Tracking Enhance Client Engagement With Interactive Advertising Background Pdf
This slide shows KPI dashboard for assessing performance of social media platforms. It provides information about followers, likes, clicks, shares, impressions, engaged users, new followers, etc. The Kpi Dashboard For Tracking Enhance Client Engagement With Interactive Advertising Background Pdf is a compilation of the most recent design trends as a series of slides. It is suitable for any subject or industry presentation, containing attractive visuals and photo spots for businesses to clearly express their messages. This template contains a variety of slides for the user to input data, such as structures to contrast two elements, bullet points, and slides for written information. Slidegeeks is prepared to create an impression. This slide shows KPI dashboard for assessing performance of social media platforms. It provides information about followers, likes, clicks, shares, impressions, engaged users, new followers, etc.
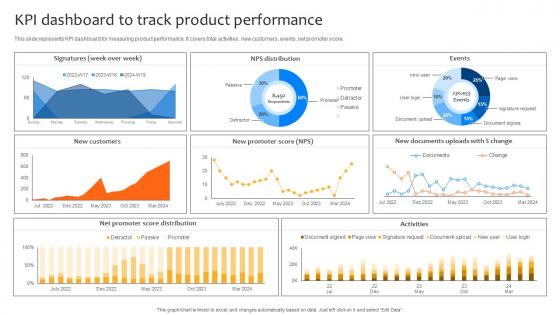
Deploying Strategies For Business KPI Dashboard To Track Product Performance Strategy SS V
This slide represents KPI dashboard for measuring product performance. It covers total activities, new customers, events, net promoter score. Coming up with a presentation necessitates that the majority of the effort goes into the content and the message you intend to convey. The visuals of a PowerPoint presentation can only be effective if it supplements and supports the story that is being told. Keeping this in mind our experts created Deploying Strategies For Business KPI Dashboard To Track Product Performance Strategy SS V to reduce the time that goes into designing the presentation. This way, you can concentrate on the message while our designers take care of providing you with the right template for the situation. This slide represents KPI dashboard for measuring product performance. It covers total activities, new customers, events, net promoter score.
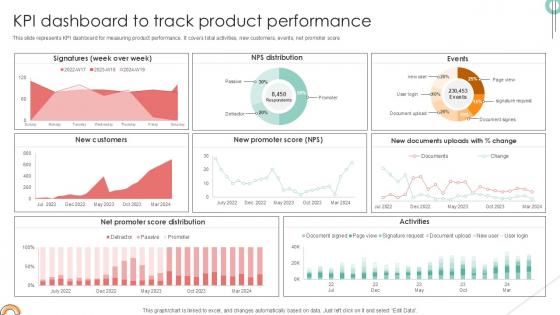
KPI Dashboard To Track Implementing Product Diversification PPT Presentation Strategy SS V
This slide represents KPI dashboard for measuring product performance. It covers total activities, new customers, events, net promoter score. This modern and well-arranged KPI Dashboard To Track Implementing Product Diversification PPT Presentation Strategy SS V provides lots of creative possibilities. It is very simple to customize and edit with the Powerpoint Software. Just drag and drop your pictures into the shapes. All facets of this template can be edited with Powerpoint, no extra software is necessary. Add your own material, put your images in the places assigned for them, adjust the colors, and then you can show your slides to the world, with an animated slide included. This slide represents KPI dashboard for measuring product performance. It covers total activities, new customers, events, net promoter score


 Continue with Email

 Home
Home


