Manufacturing Icon

Formulating Money Laundering Identifying Inherent Risk Factors And Measures Diagrams PDF
This slide showcases identifying inherent risk factors and measures. It provides information about customer base, products, services, delivery channels, jurisdictions, qualitative factors, location, customer risk rating, transparency, fund transfer, etc. Formulating a presentation can take up a lot of effort and time, so the content and message should always be the primary focus. The visuals of the PowerPoint can enhance the presenters message, so our Formulating Money Laundering Identifying Inherent Risk Factors And Measures Diagrams PDF was created to help save time. Instead of worrying about the design, the presenter can concentrate on the message while our designers work on creating the ideal templates for whatever situation is needed. Slidegeeks has experts for everything from amazing designs to valuable content, we have put everything into Formulating Money Laundering Identifying Inherent Risk Factors And Measures Diagrams PDF.

Critical Initiatives To Deploy Checklist Criteria To Assess Merger Partner Attractiveness Diagrams PDF
This slide provides information regarding checklist to evaluate merger partner attractiveness. The partner attractiveness is analyzed on several parameters such as vision and mission compatibility, organization size, etc. This Critical Initiatives To Deploy Checklist Criteria To Assess Merger Partner Attractiveness Diagrams PDF is perfect for any presentation, be it in front of clients or colleagues. It is a versatile and stylish solution for organizing your meetings. The Critical Initiatives To Deploy Checklist Criteria To Assess Merger Partner Attractiveness Diagrams PDF features a modern design for your presentation meetings. The adjustable and customizable slides provide unlimited possibilities for acing up your presentation. Slidegeeks has done all the homework before launching the product for you. So, dont wait, grab the presentation templates today.

Sharing Customer Testimonials To Increase Ecommerce Sales Ppt PowerPoint Presentation File Diagrams PDF
This slide showcases sharing customers to influencer customer for purchasing the product and increase ecommerce website sales. Organization can share customer testimonials through social media, emails and paid ads. Get a simple yet stunning designed Sharing Customer Testimonials To Increase Ecommerce Sales Ppt PowerPoint Presentation File Diagrams PDF. It is the best one to establish the tone in your meetings. It is an excellent way to make your presentations highly effective. So, download this PPT today from Slidegeeks and see the positive impacts. Our easy to edit Sharing Customer Testimonials To Increase Ecommerce Sales Ppt PowerPoint Presentation File Diagrams PDF can be your go to option for all upcoming conferences and meetings. So, what are you waiting for Grab this template today.

Why Target Market Identification Examples Of Micro Marketing Strategy Diagrams PDF
This template covers examples of companies that have successfully run the micro marketing campaigns such as P and G and Uber. It also includes micro marketing campaign details of P and G and uber company such as product line, target audience, aim, specific targeted problems, and the campaign results. Do you have an important presentation coming up Are you looking for something that will make your presentation stand out from the rest Look no further than Why Target Market Identification Examples Of Micro Marketing Strategy Diagrams PDF. With our professional designs, you can trust that your presentation will pop and make delivering it a smooth process. And with Slidegeeks, you can trust that your presentation will be unique and memorable. So why wait Grab Why Target Market Identification Examples Of Micro Marketing Strategy Diagrams PDF today and make your presentation stand out from the rest.

Facebook Audience Targeting And Advertising Funnel Ppt PowerPoint Presentation Diagram PDF
This slide represents the funnel showing the objective of targeting audience through Facebook ads. It includes details related to Facebook advertising objectives such as reach new audiences, re-engagement, revenue etc. This Facebook Audience Targeting And Advertising Funnel Ppt PowerPoint Presentation Diagram PDF is perfect for any presentation, be it in front of clients or colleagues. It is a versatile and stylish solution for organizing your meetings. The Facebook Audience Targeting And Advertising Funnel Ppt PowerPoint Presentation Diagram PDF features a modern design for your presentation meetings. The adjustable and customizable slides provide unlimited possibilities for acing up your presentation. Slidegeeks has done all the homework before launching the product for you. So, do not wait, grab the presentation templates today

Types Of Branded Content To Increase Brand Awareness Ppt PowerPoint Presentation Diagram PDF
The following slide showcases branded content types used in marketing collaterals with its description and usage. It presents types such as brand story telling, product demos, influencer marketing, user generated content, interactive content, live streaming and virtual reality and augmented reality. Find highly impressive Types Of Branded Content To Increase Brand Awareness Ppt PowerPoint Presentation Diagram PDF on Slidegeeks to deliver a meaningful presentation. You can save an ample amount of time using these presentation templates. No need to worry to prepare everything from scratch because Slidegeeks experts have already done a huge research and work for you. You need to download Types Of Branded Content To Increase Brand Awareness Ppt PowerPoint Presentation Diagram PDF for your upcoming presentation. All the presentation templates are 100 percent editable and you can change the color and personalize the content accordingly. Download now.

Loyalty Program Campaign To Improve Customer Experience Ppt PowerPoint Presentation Diagram Templates PDF
This slide represents action plan to implement loyalty program at malls with the aim to improve shopping experience and increase repeat customers. It includes incentives, discounts, customer engagement etc. This Loyalty Program Campaign To Improve Customer Experience Ppt PowerPoint Presentation Diagram Templates PDF is perfect for any presentation, be it in front of clients or colleagues. It is a versatile and stylish solution for organizing your meetings. The Loyalty Program Campaign To Improve Customer Experience Ppt PowerPoint Presentation Diagram Templates PDF features a modern design for your presentation meetings. The adjustable and customizable slides provide unlimited possibilities for acing up your presentation. Slidegeeks has done all the homework before launching the product for you. So, do not wait, grab the presentation templates today
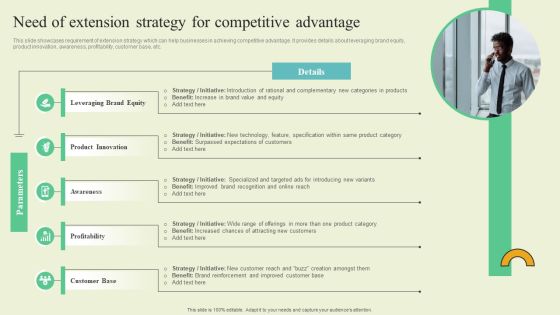
Extending Brand To Introduce New Commodities And Offerings Need Of Extension Strategy For Competitive Diagrams PDF
This slide showcases requirement of extension strategy which can help businesses in achieving competitive advantage. It provides details about leveraging brand equity, product innovation, awareness, profitability, customer base, etc. Formulating a presentation can take up a lot of effort and time, so the content and message should always be the primary focus. The visuals of the PowerPoint can enhance the presenters message, so our Extending Brand To Introduce New Commodities And Offerings Need Of Extension Strategy For Competitive Diagrams PDF was created to help save time. Instead of worrying about the design, the presenter can concentrate on the message while our designers work on creating the ideal templates for whatever situation is needed. Slidegeeks has experts for everything from amazing designs to valuable content, we have put everything into Extending Brand To Introduce New Commodities And Offerings Need Of Extension Strategy For Competitive Diagrams PDF

Brand Ecosystem Tactics And Brand Architecture Introduction To Brand Portfolio Diagrams PDF
This slide covers a brief overview of the brand portfolio. It also includes the two primary dimensions to be considered while creating a brand portfolio the breadth of the product mix and depth of branding. Do you have to make sure that everyone on your team knows about any specific topic I yes, then you should give Brand Ecosystem Tactics And Brand Architecture Introduction To Brand Portfolio Diagrams PDF a try. Our experts have put a lot of knowledge and effort into creating this impeccable Brand Ecosystem Tactics And Brand Architecture Introduction To Brand Portfolio Diagrams PDF. You can use this template for your upcoming presentations, as the slides are perfect to represent even the tiniest detail. You can download these templates from the Slidegeeks website and these are easy to edit. So grab these today.
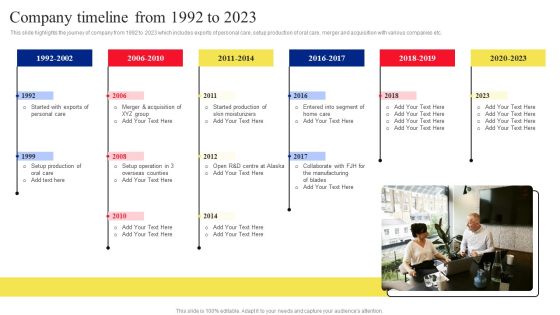
Fast Moving Consumer Goods Producing Company Profile Company Timeline From 1992 To 2023 Diagrams PDF
This slide highlights the journey of company from 1992 to 2023 which includes exports of personal care, setup production of oral care, merger and acquisition with various companies etc. Formulating a presentation can take up a lot of effort and time, so the content and message should always be the primary focus. The visuals of the PowerPoint can enhance the presenters message, so our Fast Moving Consumer Goods Producing Company Profile Company Timeline From 1992 To 2023 Diagrams PDF was created to help save time. Instead of worrying about the design, the presenter can concentrate on the message while our designers work on creating the ideal templates for whatever situation is needed. Slidegeeks has experts for everything from amazing designs to valuable content, we have put everything into Fast Moving Consumer Goods Producing Company Profile Company Timeline From 1992 To 2023 Diagrams PDF

Brand Positioning And Launch Plan For Emerging Markets Case Study Amazon Multi Diagrams PDF
This slide showcases multibrand strategy example which helped amazon to launch multiple products in market and gain competitive edge. It highlights two strategies that were used by amazon to expand its global presence that are branded house and house of brand strategy. Do you have to make sure that everyone on your team knows about any specific topic I yes, then you should give Brand Positioning And Launch Plan For Emerging Markets Case Study Amazon Multi Diagrams PDF a try. Our experts have put a lot of knowledge and effort into creating this impeccable Brand Positioning And Launch Plan For Emerging Markets Case Study Amazon Multi Diagrams PDF. You can use this template for your upcoming presentations, as the slides are perfect to represent even the tiniest detail. You can download these templates from the Slidegeeks website and these are easy to edit. So grab these today.

Determine Cyber Security Risks And Threats Ppt PowerPoint Presentation Diagram Lists PDF
The following slide highlights cyber security risks and threats identified within the company to analyze and protect from potential loss. It includes elements such as objectives, issue identifier, malware, phishing, ransomware, weak credentials, data breach etc. This Determine Cyber Security Risks And Threats Ppt PowerPoint Presentation Diagram Lists PDF is perfect for any presentation, be it in front of clients or colleagues. It is a versatile and stylish solution for organizing your meetings. The Determine Cyber Security Risks And Threats Ppt PowerPoint Presentation Diagram Lists PDF features a modern design for your presentation meetings. The adjustable and customizable slides provide unlimited possibilities for acing up your presentation. Slidegeeks has done all the homework before launching the product for you. So, do not wait, grab the presentation templates today
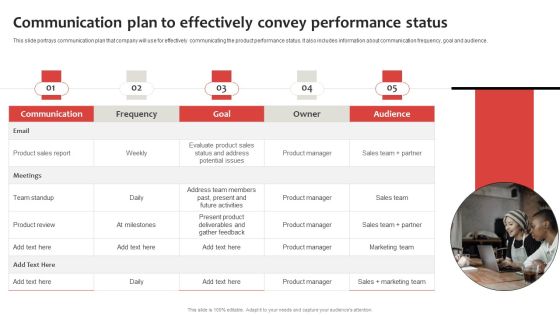
Strategic Plan To Establish And Promote Brand Awareness Communication Plan To Effectively Convey Diagrams PDF
This slide portrays communication plan that company will use for effectively communicating the product performance status. It also includes information about communication frequency, goal and audience. Do you have an important presentation coming up Are you looking for something that will make your presentation stand out from the rest Look no further than Strategic Plan To Establish And Promote Brand Awareness Communication Plan To Effectively Convey Diagrams PDF. With our professional designs, you can trust that your presentation will pop and make delivering it a smooth process. And with Slidegeeks, you can trust that your presentation will be unique and memorable. So why wait Grab Strategic Plan To Establish And Promote Brand Awareness Communication Plan To Effectively Convey Diagrams PDF today and make your presentation stand out from the rest.

Continuous Flow Supply Chain Planning Model Ppt PowerPoint Presentation Diagram Lists PDF
This slide highlights the continuous flow supply planning model which highlights the production line approach which includes items flow, lead time, inventory work, layout and quality control areas. Get a simple yet stunning designed Continuous Flow Supply Chain Planning Model Ppt PowerPoint Presentation Diagram Lists PDF. It is the best one to establish the tone in your meetings. It is an excellent way to make your presentations highly effective. So, download this PPT today from Slidegeeks and see the positive impacts. Our easy to edit Continuous Flow Supply Chain Planning Model Ppt PowerPoint Presentation Diagram Lists PDF can be your go to option for all upcoming conferences and meetings. So, what are you waiting for Grab this template today.
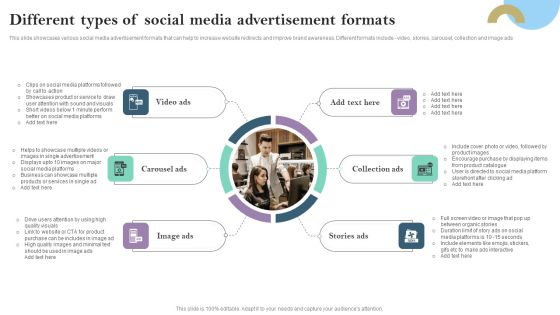
Different Types Of Social Media Advertisement Formats Ppt PowerPoint Presentation Diagram Images PDF
This slide showcases various social media advertisement formats that can help to increase website redirects and improve brand awareness. Different formats include - video, stories, carousel, collection and image ads This Different Types Of Social Media Advertisement Formats Ppt PowerPoint Presentation Diagram Images PDF is perfect for any presentation, be it in front of clients or colleagues. It is a versatile and stylish solution for organizing your meetings. The Different Types Of Social Media Advertisement Formats Ppt PowerPoint Presentation Diagram Images PDF features a modern design for your presentation meetings. The adjustable and customizable slides provide unlimited possibilities for acing up your presentation. Slidegeeks has done all the homework before launching the product for you. So, do not wait, grab the presentation templates today
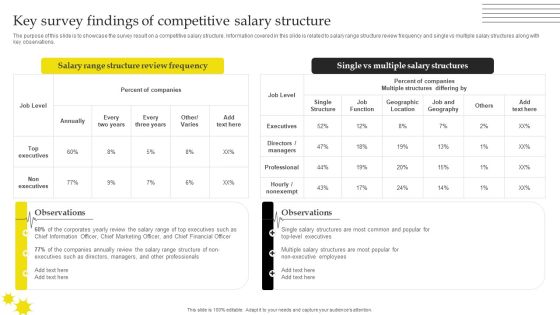
Effective Strategies For Retaining Healthcare Staff Key Survey Findings Of Competitive Salary Structure Diagrams PDF
The purpose of this slide is to showcase the survey result on a competitive salary structure. Information covered in this slide is related to salary range structure review frequency and single vs multiple salary structures along with key observations. This Effective Strategies For Retaining Healthcare Staff Key Survey Findings Of Competitive Salary Structure Diagrams PDF is perfect for any presentation, be it in front of clients or colleagues. It is a versatile and stylish solution for organizing your meetings. The Effective Strategies For Retaining Healthcare Staff Key Survey Findings Of Competitive Salary Structure Diagrams PDF features a modern design for your presentation meetings. The adjustable and customizable slides provide unlimited possibilities for acing up your presentation. Slidegeeks has done all the homework before launching the product for you. So, do not wait, grab the presentation templates today

Sample Referral Email To Gain Customer Referrals And Increase Sales Ppt PowerPoint Presentation Diagram Images PDF
This slide covers sample email sent to customers by company to increase referrals and product sales. The purpose of this template is to provide an idea about structure of emails used by company under referral marketing strategies. Create an editable Sample Referral Email To Gain Customer Referrals And Increase Sales Ppt PowerPoint Presentation Diagram Images PDF that communicates your idea and engages your audience. Whether youre presenting a business or an educational presentation, pre designed presentation templates help save time. Sample Referral Email To Gain Customer Referrals And Increase Sales Ppt PowerPoint Presentation Diagram Images PDF is highly customizable and very easy to edit, covering many different styles from creative to business presentations. Slidegeeks has creative team members who have crafted amazing templates. So, go and get them without any delay.

Billing Software MVP Development Process Workflow Ppt PowerPoint Presentation Diagram Lists PDF
Following slide exhibits process of developing effective minimum viable product MVP. It include pointers such as clear need, observe research, prioritize insights, development, new ideas, feedback etc. Do you have an important presentation coming up Are you looking for something that will make your presentation stand out from the rest Look no further than Billing Software MVP Development Process Workflow Ppt PowerPoint Presentation Diagram Lists PDF. With our professional designs, you can trust that your presentation will pop and make delivering it a smooth process. And with Slidegeeks, you can trust that your presentation will be unique and memorable. So why wait Grab Billing Software MVP Development Process Workflow Ppt PowerPoint Presentation Diagram Lists PDF today and make your presentation stand out from the rest.
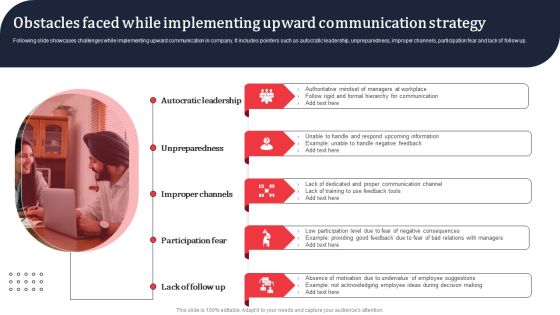
Obstacles Faced While Implementing Upward Communication Strategy Ppt PowerPoint Presentation Diagram Images PDF
Following slide showcases challenges while implementing upward communication in company. It includes pointers such as autocratic leadership, unpreparedness, improper channels, participation fear and lack of follow up. This Obstacles Faced While Implementing Upward Communication Strategy Ppt PowerPoint Presentation Diagram Images PDF is perfect for any presentation, be it in front of clients or colleagues. It is a versatile and stylish solution for organizing your meetings. The Obstacles Faced While Implementing Upward Communication Strategy Ppt PowerPoint Presentation Diagram Images PDF features a modern design for your presentation meetings. The adjustable and customizable slides provide unlimited possibilities for acing up your presentation. Slidegeeks has done all the homework before launching the product for you. So, do not wait, grab the presentation templates today

Impressive Statistics Associated With Amazon Brand Ppt PowerPoint Presentation File Diagrams PDF
This slide caters details about key statistics associated with Amazon in terms of number of employees, estimated annual revenue, Prime subscribers across globe, net income generated, segment that generated majority revenues, etc. This Impressive Statistics Associated With Amazon Brand Ppt PowerPoint Presentation File Diagrams PDF is perfect for any presentation, be it in front of clients or colleagues. It is a versatile and stylish solution for organizing your meetings. The Impressive Statistics Associated With Amazon Brand Ppt PowerPoint Presentation File Diagrams PDF features a modern design for your presentation meetings. The adjustable and customizable slides provide unlimited possibilities for acing up your presentation. Slidegeeks has done all the homework before launching the product for you. So, do not wait, grab the presentation templates today

Saas Continuous Income Generation Model For Software Startup Which Pricing Strategy To Use Diagrams PDF
The following slide provides an overview of the various strategies that the organization can use in order to price their product and services, these strategies can be premium pricing, market penetration pricing, economy pricing or competitive pricing Do you have an important presentation coming up Are you looking for something that will make your presentation stand out from the rest Look no further than Saas Continuous Income Generation Model For Software Startup Which Pricing Strategy To Use Diagrams PDF. With our professional designs, you can trust that your presentation will pop and make delivering it a smooth process. And with Slidegeeks, you can trust that your presentation will be unique and memorable. So why wait Grab Saas Continuous Income Generation Model For Software Startup Which Pricing Strategy To Use Diagrams PDF today and make your presentation stand out from the rest.
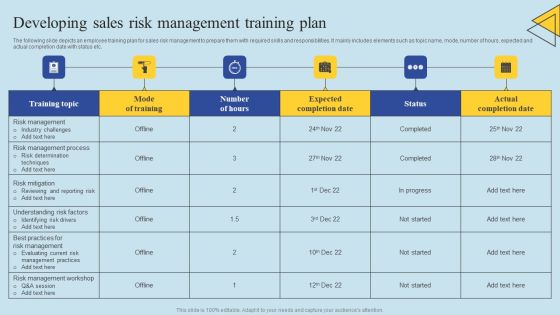
Determining Risks In Sales Administration Procedure Developing Sales Risk Management Training Plan Diagrams PDF
The following slide depicts an employee training plan for sales risk management to prepare them with required skills and responsibilities. It mainly includes elements such as topic name, mode, number of hours, expected and actual completion date with status etc. This Determining Risks In Sales Administration Procedure Developing Sales Risk Management Training Plan Diagrams PDF is perfect for any presentation, be it in front of clients or colleagues. It is a versatile and stylish solution for organizing your meetings. The Determining Risks In Sales Administration Procedure Developing Sales Risk Management Training Plan Diagrams PDF features a modern design for your presentation meetings. The adjustable and customizable slides provide unlimited possibilities for acing up your presentation. Slidegeeks has done all the homework before launching the product for you. So, do not wait, grab the presentation templates today

Acquiring Clients Through Search Engine And Native Ads Advertisement Formats Compatibility Across Different Diagrams PDF
This slide showcase various advertisement formats that are used by marketers to increase brand awareness and generate leads from social media platforms. Key formats of social media ads are - image, carousel, product, collection, interactive lead forms ads etc. Create an editable Acquiring Clients Through Search Engine And Native Ads Advertisement Formats Compatibility Across Different Diagrams PDF that communicates your idea and engages your audience. Whether youre presenting a business or an educational presentation, pre designed presentation templates help save time. Acquiring Clients Through Search Engine And Native Ads Advertisement Formats Compatibility Across Different Diagrams PDF is highly customizable and very easy to edit, covering many different styles from creative to business presentations. Slidegeeks has creative team members who have crafted amazing templates. So, go and get them without any delay.

Unconstrained Market Growth Using Blue Ocean Strategies Four Hurdles Strategy Execution Diagrams PDF
This template cover four types of hurdles to strategy execution that companies can face while developing a blue ocean strategy with a profitable business model. The 4 type of hurdles are cognitive hurdle, resource hurdle, motivational hurdle and political hurdle. This Unconstrained Market Growth Using Blue Ocean Strategies Four Hurdles Strategy Execution Diagrams PDF is perfect for any presentation, be it in front of clients or colleagues. It is a versatile and stylish solution for organizing your meetings. The Unconstrained Market Growth Using Blue Ocean Strategies Four Hurdles Strategy Execution Diagrams PDF features a modern design for your presentation meetings. The adjustable and customizable slides provide unlimited possibilities for acing up your presentation. Slidegeeks has done all the homework before launching the product for you. So, do not wait, grab the presentation templates today

What Value Innovation And How To Create It In Blue Ocean Market Diagrams PDF
This template covers introduction of value a. It is a process in which a company introduces new technologies or upgrades that are designed to achieve both product differentiation and low costs. Do you have to make sure that everyone on your team knows about any specific topic I yes, then you should give What Value Innovation And How To Create It In Blue Ocean Market Diagrams PDF a try. Our experts have put a lot of knowledge and effort into creating this impeccable What Value Innovation And How To Create It In Blue Ocean Market Diagrams PDF. You can use this template for your upcoming presentations, as the slides are perfect to represent even the tiniest detail. You can download these templates from the Slidegeeks website and these are easy to edit. So grab these today.
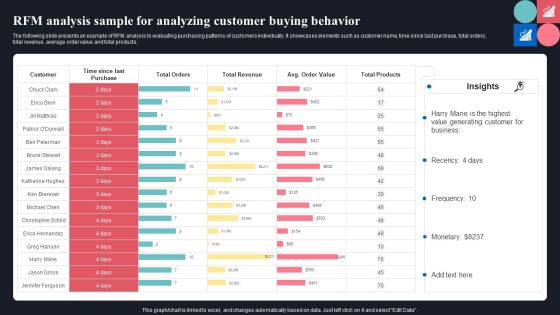
RFM Analysis Sample For Analyzing Customer Buying Behavior Ppt Gallery Diagrams PDF
The following slide presents an example of RFM analysis to evaluating purchasing patterns of customers individually. It showcases elements such as customer name, time since last purchase, total orders, total revenue, average order value and total products. Get a simple yet stunning designed RFM Analysis Sample For Analyzing Customer Buying Behavior Ppt Gallery Diagrams PDF. It is the best one to establish the tone in your meetings. It is an excellent way to make your presentations highly effective. So, download this PPT today from Slidegeeks and see the positive impacts. Our easy to edit RFM Analysis Sample For Analyzing Customer Buying Behavior Ppt Gallery Diagrams PDF can be your go to option for all upcoming conferences and meetings. So, what are you waiting for Grab this template today.
Effective NPO Promotional Strategies For Recruit Volunteers Timeline To Create And Launch Fundraising Video Diagrams PDF
This slide provides an overview of the steps followed by nonprofit organizations while creating videos. The stages covered are creative planning, meeting, pre, post-production and video premier. Explore a selection of the finest Effective NPO Promotional Strategies For Recruit Volunteers Timeline To Create And Launch Fundraising Video Diagrams PDF here. With a plethora of professionally designed and pre-made slide templates, you can quickly and easily find the right one for your upcoming presentation. You can use our Effective NPO Promotional Strategies For Recruit Volunteers Timeline To Create And Launch Fundraising Video Diagrams PDF to effectively convey your message to a wider audience. Slidegeeks has done a lot of research before preparing these presentation templates. The content can be personalized and the slides are highly editable. Grab templates today from Slidegeeks.

Order Processing System With Delivery And Shipment Status Ppt PowerPoint Presentation Ideas Visual Aids PDF
Presenting order processing system with delivery and shipment status ppt powerpoint presentation ideas visual aids pdf to dispense important information. This template comprises one stages. It also presents valuable insights into the topics including contact, products issued, stock account, order fulfilment, billing, processing order, activities pre sales, contact, inquiry, price quotation, sales order, delivery, transfer order, invoice, accounts receivables, shipment, planning agreement. This is a completely customizable PowerPoint theme that can be put to use immediately. So, download it and address the topic impactfully.

Strategy Ppt Background Linear Arrow 11 Stages Business PowerPoint 10 Design
We present our strategy PPT Background linear arrow 11 stages business PowerPoint 10 design. Use our Arrows PowerPoint Templates because, All elements of the venture are equally critical. Use our Business PowerPoint Templates because, Marketing Strategy Business Template:- Maximizing sales of your product is the intended destination. Use our Marketing PowerPoint Templates because, Feel the buzz as they comprehend your plan to get the entire act together. Use our Technology PowerPoint Templates because; emphasize the process of your business/corporate growth. Use our Process and flows PowerPoint Templates because, this template with an image of helps you chart the course of your presentation. Use these PowerPoint slides for presentations relating to Algorithm, arrow, arrow chart, business, chart, color, connection, development, diagram, direction, flow chart, flow diagram, flowchart, kind of diagram, linear, linear diagram, management, motion, organization, plan, process, process arrows, process chart, process diagram, process flow, program, sign, solution, strategy, symbol, technology. The prominent colors used in the PowerPoint template are Blue, Gray, and White

Concept Of Revenue Management Ppt Powerpoint Images
This is a concept of revenue management ppt powerpoint images. This is a five stage process. The stages in this process are revenue by division, chart title, total revenue completed target, product, consulting, trading.
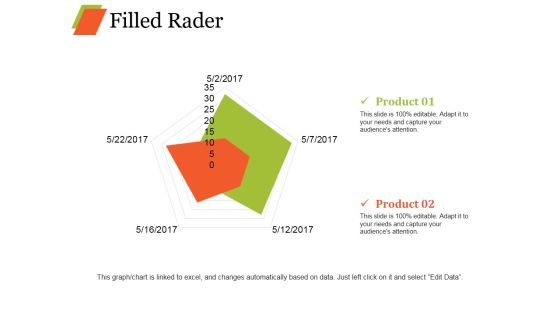
Filled Rader Ppt PowerPoint Presentation Inspiration Graphic Tips
This is a filled rader ppt powerpoint presentation inspiration graphic tips. This is a two stage process. The stages in this process are radar chart, shapes, product, business, marketing.
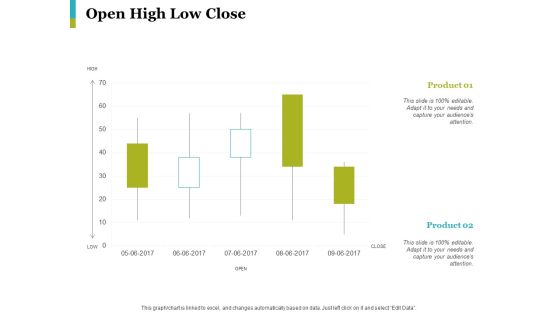
Open High Low Close Ppt PowerPoint Presentation Styles Graphics Example
This is a open high low close ppt powerpoint presentation styles graphics example.This is a two stage process. The stages in this process are product, percentage, chart, management, marketing.
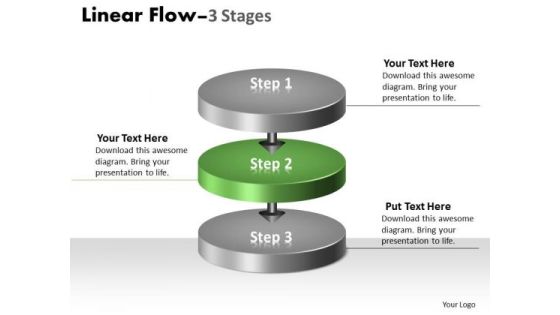
Ppt Background Vertical Steps For Free Idea Strategy 3 Design
We present our PPT Background vertical Steps for free idea strategy 3 design. Use our Circle Charts PowerPoint Templates because, this template with an image of helps you chart the course of your presentation. Use our Arrows PowerPoint Templates because, the basic stages are in place, you need to build upon them with our PowerPoint templates. Use our Communication PowerPoint Templates because; Employ the right colors for your brilliant ideas. Use our Layers PowerPoint Templates because; Outline your targets to your team. Use our Business PowerPoint Templates because, Marketing Strategy Business Template:- Maximizing sales of your product is the intended destination. Use these PowerPoint slides for presentations relating to background, blog, business, chain, communication, community, concept, connection, constructive, contact, design, flow, interaction, internet, line, linear, location, logistic, modern, movement, network, path, pointer, reaction, structure, system, team, . The prominent colors used in the PowerPoint template are Green, Gray, and Black
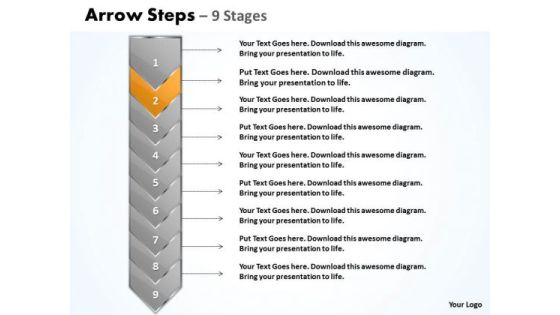
Strategy Ppt Background Green And Orange Arrow 9 States Diagram 3 Image
We present our strategy PPT Background green and orange arrow 9 states diagram 3 Image.Use our Advertising PowerPoint Templates because, to achieve sure shot success they need to come together at the right time, place and manner. Use our Arrows PowerPoint Templates because, creating a winner is your passion and dream. Use our Marketing PowerPoint Templates because, our cleverly selected background hues are guaranteed to achieve this aim. Use our Business PowerPoint Templates because; inform your team of your ideas using our illustrative slides. Use our Process and flows PowerPoint Templates because, you as the Champion your team shall anoint. Use these PowerPoint slides for presentations relating to Advertising, arrow, banner, bookmark, card, choice, concept, creative, design, direction, flow, illustration, info graphic, instruction, label, layout, manual, marketing, modern, offer, options, order, pointer, process, product, promotion, sequence, simple, special, step, symbol, template. The prominent colors used in the PowerPoint template are Yellow, Gray, and Black
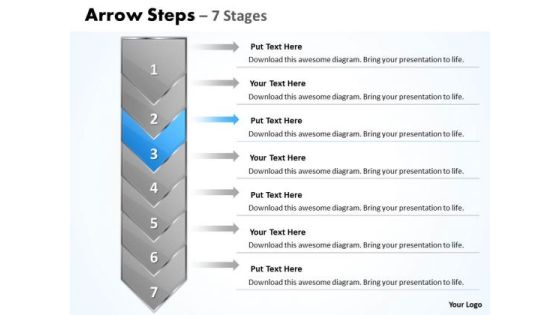
Strategy Ppt Escalation 7 State Diagram Represented By Arrow 4 Graphic
We present our strategy PPT escalation 7 state diagram represented by arrow 4 Graphic.Use our Advertising PowerPoint Templates because, illustrate the means to prevent or control them using our imaginative templates. Use our Arrows PowerPoint Templates because, Brainstorming Light Bulbs: - The atmosphere in the workplace is electric. Use our Marketing PowerPoint Templates because, illustrate the means to prevent or control them using our imaginative templates. Use our Business PowerPoint Templates because; illustrate these thoughts with this slide. Use our Process and flows PowerPoint Templates because; Present your opinions in this field using our impressive templates. Use these PowerPoint slides for presentations relating to Advertising, arrow, banner, bookmark, card, choice, concept, creative, design, direction, flow, illustration, info graphic, instruction, label, layout, manual, marketing, modern, offer, options, order, pointer, process, product, promotion, sequence, simple, special, step, symbol, template. The prominent colors used in the PowerPoint template are Blue, Gray, and Black
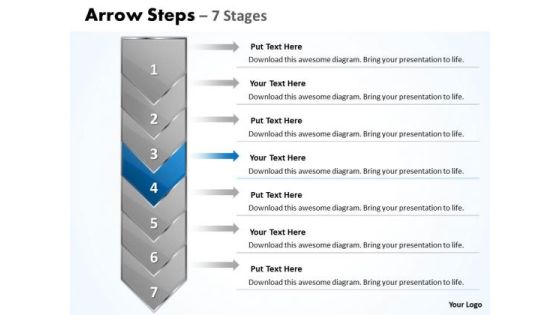
Strategy Ppt Escalation 7 State Diagram Represented By Arrow 5 Graphic
We present our strategy PPT escalation 7 state diagram represented by arrow 5 Graphic.Use our Advertising PowerPoint Templates because, Present your views using our innovative slides and be assured of leaving a lasting impression. Use our Arrows PowerPoint Templates because; examine each brilliant thought in thorough detail highlighting all the pros and cons as minutely as possible. Use our Marketing PowerPoint Templates because; Use them to your advantage to priorities your ideas. Use our Business PowerPoint Templates because, Ideas roll along in your mind like billiard balls. Use our Process and flows PowerPoint Templates because, unravel the process layer by layer and expose their relevance to the core issue. Use these PowerPoint slides for presentations relating to Advertising, arrow, banner, bookmark, card, choice, concept, creative, design, direction, flow, illustration, info graphic, instruction, label, layout, manual, marketing, modern, offer, options, order, pointer, process, product, promotion, sequence, simple, special, step, symbol, template. The prominent colors used in the PowerPoint template are Blue, Gray, and Black
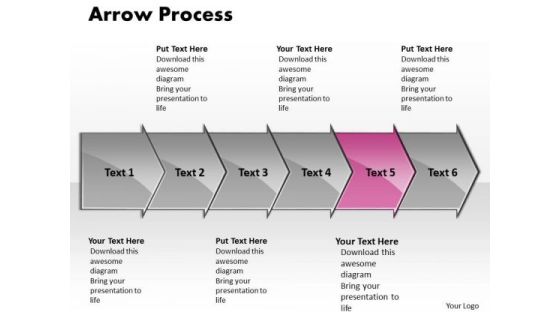
Marketing Ppt Arrow Process 6 State Diagram Communication Skills PowerPoint Image
We present our marketing PPT arrow process 6 state diagram communication skills power point Image. Use our Advertising PowerPoint Templates because; Draw on its universal impact to highlight the similarities with your organizational structure and plans. Use our Arrows PowerPoint Templates because; evolve the strategy to take you down the required path with appropriate, efficient and effective marketing along the way. Use our Shapes PowerPoint Templates because; Blaze a brilliant trail from point to point. Use our Business PowerPoint Templates because, creating a winner is your passion and dream. Use our Process and Flows PowerPoint Templates because, You have what it takes to grow. Use these PowerPoint slides for presentations relating to advertising, arrow, background, banner, blue, bookmark, card, choice, concept, creative, design, direction, flow, instruction, label, layout, manual, marketing, pointer, process, product, promotion, sequence, step, symbol, vector. The prominent colors used in the PowerPoint template are Pink, Gray, and Black
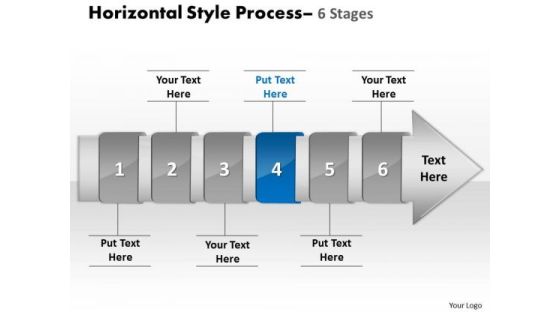
Ppt Horizontal Flow Of 6 Stage Cause And Effect Diagram PowerPoint Template 5 Graphic
We present our PPT horizontal flow of 6 stage cause and effect diagram PowerPoint template 5 Graphic. Use our Design PowerPoint Templates because, you have made significant headway in this field. Use our Shapes PowerPoint Templates because, are the tools that helped most of us evolve. Use our Business PowerPoint Templates because, Marketing Strategy Business Template: - Maximizing sales of your product is the intended destination. Use our Process and Flows PowerPoint Templates because, However there is a key aspect to be emphasized. Use our Arrows PowerPoint Templates because; in any endeavor people matter most. Use these PowerPoint slides for presentations relating to accent, advertisement, aqua, arrow, blank, business, button, collection, color, decoration, design, direction, element, empty, financial, flow, graph, green, grey, horizontal, instruction, isolated, placard, process, promo, promotion, sale, set, shape, shiny, silver, steps, symbol. The prominent colors used in the PowerPoint template are Blue navy, White, Gray

Ppt 3d Illustration Of Beeline Arrow Flow Diagram Selling Plan PowerPoint 1 Image
We present our PPT 3d illustration of beeline arrow flow diagram selling plan PowerPoint 1 Image. Use our Arrows PowerPoint Templates because; Use this impressive template to unravel your recipe for a mouthwatering result. Use our Symbol PowerPoint Templates because; Break it all down to Key Result Areas. Use our Business PowerPoint Templates because, Marketing Strategy Business Template: - Maximizing sales of your product is the intended destination. Use our Leadership PowerPoint Templates because; motivate your team to cross all barriers. Use our Metaphor PowerPoint Templates because, you understand how each drives the next to motor the entire sequence. Use these PowerPoint slides for presentations relating to Abstract, Age, Ancient, Antique, Arrows, Art, Artistic, Background, Colors, Decoration, Design, Dynamic, Elegant, Element, Future, Illustration, Index, Linear, Lines, Modern, Old, Paper, Pattern, Scratch, Text, Texture, Up, Vintage. The prominent colors used in the PowerPoint template are Green, Blue, and Black
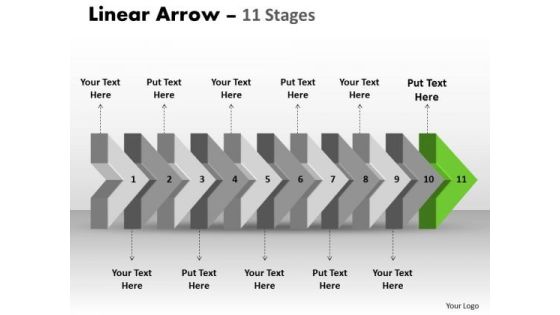
Ppt 3d Illustration Of Beeline Arrow Flow Ishikawa Diagram PowerPoint Template 12 Graphic
We present our PPT 3d illustration of beeline arrow flow ishikawa diagram PowerPoint template 12 Graphic. Use our Arrows PowerPoint Templates because; Watch their mental juices begin to flow. Use our Business PowerPoint Templates because, Marketing Strategy Business Template: - Maximizing sales of your product is the intended destination. Use our Process and Flows PowerPoint Templates because, Set out the goals and your plan of action for them. Use our Symbol PowerPoint Templates because, It is in your DNA to analyze possible causes to the minutest detail. Use our Metaphor PowerPoint Templates because; Show them how to churn out fresh ideas. Use these PowerPoint slides for presentations relating to Abstract, Age, Ancient, Antique, Arrows, Art, Artistic, Background, Colors, Decoration, Design, Dynamic, Elegant, Element, Future, Illustration, Index, Linear, Lines, Modern, Old, Paper, Pattern, Scratch, Text, Texture, Up, Vintage. The prominent colors used in the PowerPoint template are Green, Gray, Black

Ppt Background 9 Stages Linear Means Free Fishbone Diagram PowerPoint Template 6 Graphic
We present our PPT Background 9 stages linear means free fishbone diagram PowerPoint template 6 Graphic. Use our Arrows PowerPoint Templates because; motivate your team to cross all barriers. Use our Communication PowerPoint Templates because, our presentation designs are for those on the go. Use our Shapes PowerPoint Templates because, you have the plans ready for them to absorb and understand. Use our Business PowerPoint Templates because, Marketing Strategy Business Template: - Maximizing sales of your product is the intended destination. Use our Process and Flows PowerPoint Templates because, and watch them strengthen your companys sinews. Use these PowerPoint slides for presentations relating to background, blog, business, chain, communication, connection, constructive, contact, design, diagonal, dialog, digital, flow, global, interaction, internet, line, linear, network, partner, pointer, reaction, social, stream, structure, system, team,. The prominent colors used in the PowerPoint template are Green, Gray, and White

Accelerating COVID 19 Recovery In Maritime Sector Finding New Sales Channels Diagrams PDF
This template covers the strategies that companys are recently using in COVID-19 pandemic such as using social media, WhatsApp to share its customers tips, safety advice and other marketing material etcThis is a accelerating COVID 19 recovery in maritime sector finding new sales channels diagrams pdf. template with various stages. Focus and dispense information on one stage using this creative set, that comes with editable features. It contains large content boxes to add your information on topics like start delivering products home, using strict safety protocols, safety advice and other marketing material, revenue, and make some in house items for online sale. You can also showcase facts, figures, and other relevant content using this PPT layout. Grab it now.

Need Of Raising Funds From Market Developing Fundraising Techniques Diagrams PDF
This slide showcases reasons due to which organization wants to raise funds from equity and debt market. Its key components are production capacity, hiring employees and operational cost.Slidegeeks is here to make your presentations a breeze with Need Of Raising Funds From Market Developing Fundraising Techniques Diagrams PDF With our easy-to-use and customizable templates, you can focus on delivering your ideas rather than worrying about formatting. With a variety of designs to choose from, you are sure to find one that suits your needs. And with animations and unique photos, illustrations, and fonts, you can make your presentation pop. So whether you are giving a sales pitch or presenting to the board, make sure to check out Slidegeeks first.

Assessing International Market Assessing And Evaluating Strategies For Global Expansion Diagrams PDF
This slide showcases assessment and evaluation of global expansion strategies. It compares strategies on various parameters that are network structure, local production, marketing adoption, centre of excellence, inter subsidiary flows etc. Slidegeeks is here to make your presentations a breeze with Assessing International Market Assessing And Evaluating Strategies For Global Expansion Diagrams PDF With our easy-to-use and customizable templates, you can focus on delivering your ideas rather than worrying about formatting. With a variety of designs to choose from, youre sure to find one that suits your needs. And with animations and unique photos, illustrations, and fonts, you can make your presentation pop. So whether youre giving a sales pitch or presenting to the board, make sure to check out Slidegeeks first.
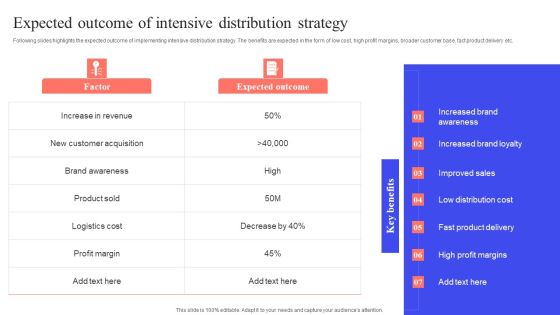
Implementing Effective Distribution Expected Outcome Of Intensive Distribution Strategy Diagrams PDF
Following slides highlights the expected outcome of implementing intensive distribution strategy. The benefits are expected in the form of low cost, high profit margins, broader customer base, fact product delivery etc. Slidegeeks has constructed Implementing Effective Distribution Expected Outcome Of Intensive Distribution Strategy Diagrams PDF after conducting extensive research and examination. These presentation templates are constantly being generated and modified based on user preferences and critiques from editors. Here, you will find the most attractive templates for a range of purposes while taking into account ratings and remarks from users regarding the content. This is an excellent jumping-off point to explore our content and will give new users an insight into our top-notch PowerPoint Templates.

CRM Software Deployment Journey Post Implementation Impacts On Company Sales Diagrams PDF
This slide covers the forecasted impacts of deploying CRM systems in the organization. It includes outcomes such as increase in sales, increases in sales team productivity, increased rates of customer retention and satisfaction, return on investment, and shortened sales cycle. Want to ace your presentation in front of a live audience Our CRM Software Deployment Journey Post Implementation Impacts On Company Sales Diagrams PDF can help you do that by engaging all the users towards you.. Slidegeeks experts have put their efforts and expertise into creating these impeccable powerpoint presentations so that you can communicate your ideas clearly. Moreover, all the templates are customizable, and easy-to-edit and downloadable. Use these for both personal and commercial use.

Optimizing AI Strategies To Improve Financial Services AI Competitive Landscape Diagrams PDF
This slide covers the detail of the artificial intelligence competitors available in the market along with their company highlights, market information, product details and SWOT analysis. Coming up with a presentation necessitates that the majority of the effort goes into the content and the message you intend to convey. The visuals of a PowerPoint presentation can only be effective if it supplements and supports the story that is being told. Keeping this in mind our experts created Optimizing AI Strategies To Improve Financial Services AI Competitive Landscape Diagrams PDF to reduce the time that goes into designing the presentation. This way, you can concentrate on the message while our designers take care of providing you with the right template for the situation.

Cyber Physical Systems In Smart Greenhouse Ppt PowerPoint Presentation Diagram PDF
This slide describes the cyber-physical systems in the smart greenhouse, including its benefits such as saving time and money, improved productivity, and controlled amount of water. Coming up with a presentation necessitates that the majority of the effort goes into the content and the message you intend to convey. The visuals of a PowerPoint presentation can only be effective if it supplements and supports the story that is being told. Keeping this in mind our experts created Cyber Physical Systems In Smart Greenhouse Ppt PowerPoint Presentation Diagram PDF to reduce the time that goes into designing the presentation. This way, you can concentrate on the message while our designers take care of providing you with the right template for the situation.
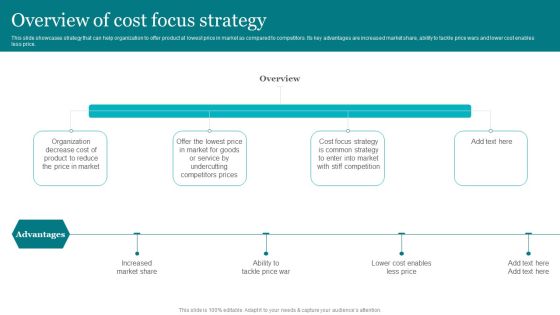
Porters Strategies For Targeted Client Segment Overview Of Cost Focus Strategy Diagrams PDF
This slide showcases strategy that can help organization to offer product at lowest price in market as compared to competitors. Its key advantages are increased market share, ability to tackle price wars and lower cost enables less price. Want to ace your presentation in front of a live audience Our Porters Strategies For Targeted Client Segment Overview Of Cost Focus Strategy Diagrams PDF can help you do that by engaging all the users towards you. Slidegeeks experts have put their efforts and expertise into creating these impeccable powerpoint presentations so that you can communicate your ideas clearly. Moreover, all the templates are customizable, and easy to edit and downloadable. Use these for both personal and commercial use.

Red Ocean Technique Competition Defining The Steps To Craft Compelling USP Elements PDF Diagrams PDF
The following slide exhibits six step process of creating a unique USP. The key steps outlined in the slide are defining the target audience, identifying competitor product special features, positioning the USP, promoting the USP, testing and writing clear and concise USP. Slidegeeks is one of the best resources for PowerPoint templates. You can download easily and regulate Red Ocean Technique Competition Defining The Steps To Craft Compelling USP Elements PDF Diagrams PDF for your personal presentations from our wonderful collection. A few clicks is all it takes to discover and get the most relevant and appropriate templates. Use our Templates to add a unique zing and appeal to your presentation and meetings. All the slides are easy to edit and you can use them even for advertisement purposes.

Techniques To Monitor Transactions Identifying Inherent Risk Factors And Measures Diagrams PDF
This slide showcases identifying inherent risk factors and measures. It provides information about customer base, products, services, delivery channels, jurisdictions, qualitative factors, location, customer risk rating, transparency, fund transfer, etc. Welcome to our selection of the Techniques To Monitor Transactions Identifying Inherent Risk Factors And Measures Diagrams PDF. These are designed to help you showcase your creativity and bring your sphere to life. Planning and Innovation are essential for any business that is just starting out. This collection contains the designs that you need for your everyday presentations. All of our PowerPoints are 100 percent editable, so you can customize them to suit your needs. This multi-purpose template can be used in various situations. Grab these presentation templates today.

Strategic Guide To Perform Marketing Benefits And Limitations Of Marketing For Enterprises Diagrams PDF
This slide highlights various advantages and disadvantages of using marketing concept on business to promote products or services among audience. It presents benefits like broadens market area, increase brand awareness, increase business revenue and limitation such as budgetary and time constraints and data reliability. Coming up with a presentation necessitates that the majority of the effort goes into the content and the message you intend to convey. The visuals of a PowerPoint presentation can only be effective if it supplements and supports the story that is being told. Keeping this in mind our experts created Strategic Guide To Perform Marketing Benefits And Limitations Of Marketing For Enterprises Diagrams PDF to reduce the time that goes into designing the presentation. This way, you can concentrate on the message while our designers take care of providing you with the right template for the situation.

Best Practices To Identify Profitable Customer Segment Ppt PowerPoint Presentation File Diagrams PDF
This slide illustrates various methods to determine lucrative customer segments in market. It provides information such as 80 or 20 marketing rule, align spend and resource, catchment analysis, market penetration analysis and customer or product analysis. Are you in need of a template that can accommodate all of your creative concepts This one is crafted professionally and can be altered to fit any style. Use it with Google Slides or PowerPoint. Include striking photographs, symbols, depictions, and other visuals. Fill, move around, or remove text boxes as desired. Test out color palettes and font mixtures. Edit and save your work, or work with colleagues. Download Best Practices To Identify Profitable Customer Segment Ppt PowerPoint Presentation File Diagrams PDF and observe how to make your presentation outstanding. Give an impeccable presentation to your group and make your presentation unforgettable.

Strategies To Decrease Ecommerce Shipping Time Ppt PowerPoint Presentation Diagram Templates PDF
This slide showcases strategies that can help organization to reduce the shipping time of products. It includes local warehouse, stock management, dropshipping and AI to forecast demand. Present like a pro with Strategies To Decrease Ecommerce Shipping Time Ppt PowerPoint Presentation Diagram Templates PDF Create beautiful presentations together with your team, using our easy to use presentation slides. Share your ideas in real time and make changes on the fly by downloading our templates. So whether you are in the office, on the go, or in a remote location, you can stay in sync with your team and present your ideas with confidence. With Slidegeeks presentation got a whole lot easier. Grab these presentations today.

Understanding Basic Customer Needs And Requirements Ppt PowerPoint Presentation File Diagrams PDF
This slide showcases the five resulting elements from analyzing customers basic requirements from a product purchased. It includes requirements such as functionality, reliability, compatibility, price, usability, etc. Are you in need of a template that can accommodate all of your creative concepts This one is crafted professionally and can be altered to fit any style. Use it with Google Slides or PowerPoint. Include striking photographs, symbols, depictions, and other visuals. Fill, move around, or remove text boxes as desired. Test out color palettes and font mixtures. Edit and save your work, or work with colleagues. Download Understanding Basic Customer Needs And Requirements Ppt PowerPoint Presentation File Diagrams PDF and observe how to make your presentation outstanding. Give an impeccable presentation to your group and make your presentation unforgettable.

Streamlining Brand Portfolio Technique Need To Create A Strong Brand Portfolio Strategy Diagrams PDF
This slide covers the requirement for creating a brand portfolio strategy. It includes reasons such as slow revenue growth, products increasingly seen as commoditized, poor cross-sell or up-sell between brands, etc. Welcome to our selection of the Streamlining Brand Portfolio Technique Need To Create A Strong Brand Portfolio Strategy Diagrams PDF. These are designed to help you showcase your creativity and bring your sphere to life. Planning and Innovation are essential for any business that is just starting out. This collection contains the designs that you need for your everyday presentations. All of our PowerPoints are 100 percent editable, so you can customize them to suit your needs. This multi purpose template can be used in various situations. Grab these presentation templates today.

Comprehensive Guide For Social Business Startup 6Ps Social Entrepreneurial Diagrams PDF
The slide carries various areas to be determined for establishing a social business start up. 6Ps of social enterprise areas included are people, problem, plan, prioritize, prototype and pursue if the product or services provides benefits to the people. Coming up with a presentation necessitates that the majority of the effort goes into the content and the message you intend to convey. The visuals of a PowerPoint presentation can only be effective if it supplements and supports the story that is being told. Keeping this in mind our experts created Comprehensive Guide For Social Business Startup 6Ps Social Entrepreneurial Diagrams PDF to reduce the time that goes into designing the presentation. This way, you can concentrate on the message while our designers take care of providing you with the right template for the situation.

Introduction To Infographics With Key Characteristics Ppt PowerPoint Presentation Diagram PDF
The slide outlines meaning of infographics along with its characteristics to promote products or service through content marketing. It showcases features such as provide a summary of a case, easy to explain a complicated approach, raise awareness about a problem or cause, compare and differ numerous opportunities, etc. If your project calls for a presentation, then Slidegeeks is your go to partner because we have professionally designed, easy to edit templates that are perfect for any presentation. After downloading, you can easily edit Introduction To Infographics With Key Characteristics Ppt PowerPoint Presentation Diagram PDF and make the changes accordingly. You can rearrange slides or fill them with different images. Check out all the handy templates
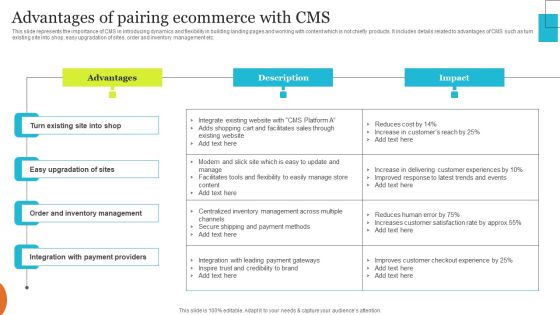
Implementing Effective Ecommerce Managemnet Platform Advantages Of Pairing Ecommerce With CMS Diagrams PDF
This slide represents the importance of CMS in introducing dynamics and flexibility in building landing pages and working with content which is not chiefly products. It includes details related to advantages of CMS such as turn existing site into shop, easy upgradation of sites, order and inventory management etc. Slidegeeks is one of the best resources for PowerPoint templates. You can download easily and regulate Implementing Effective Ecommerce Managemnet Platform Advantages Of Pairing Ecommerce With CMS Diagrams PDF for your personal presentations from our wonderful collection. A few clicks is all it takes to discover and get the most relevant and appropriate templates. Use our Templates to add a unique zing and appeal to your presentation and meetings. All the slides are easy to edit and you can use them even for advertisement purposes.

Developing Email Marketing Campaign To Increase Web Traffic Ppt PowerPoint Presentation File Diagrams PDF
The following slide showcases a comprehensive email marketing campaign through which marketing professionals can boost traffic to the website and convert leads into sales. It provides information about email types such as welcome, promotional, product launch, and re-engagement email. It also covers suitable time to send mail, target audience, status, sending date, and headline. Are you in need of a template that can accommodate all of your creative concepts This one is crafted professionally and can be altered to fit any style. Use it with Google Slides or PowerPoint. Include striking photographs, symbols, depictions, and other visuals. Fill, move around, or remove text boxes as desired. Test out color palettes and font mixtures. Edit and save your work, or work with colleagues. Download Developing Email Marketing Campaign To Increase Web Traffic Ppt PowerPoint Presentation File Diagrams PDF and observe how to make your presentation outstanding. Give an impeccable presentation to your group and make your presentation unforgettable.
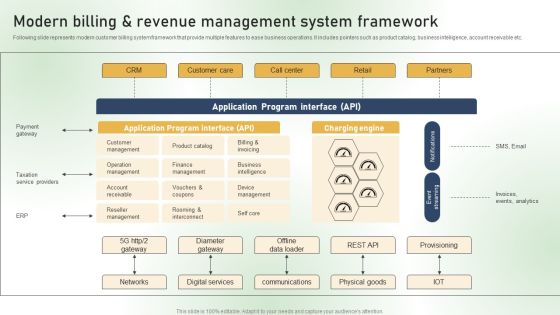
Modern Billing And Revenue Management System Framework Ppt PowerPoint Presentation Diagram Images PDF
Following slide represents modern customer billing system framework that provide multiple features to ease business operations. It includes pointers such as product catalog, business intelligence, account receivable etc. This Modern Billing And Revenue Management System Framework Ppt PowerPoint Presentation Diagram Images PDF from Slidegeeks makes it easy to present information on your topic with precision. It provides customization options, so you can make changes to the colors, design, graphics, or any other component to create a unique layout. It is also available for immediate download, so you can begin using it right away. Slidegeeks has done good research to ensure that you have everything you need to make your presentation stand out. Make a name out there for a brilliant performance.
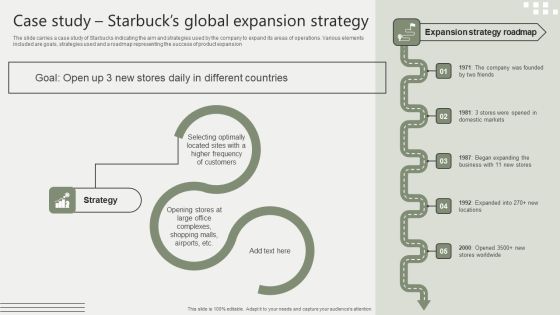
Global Business Market Development Guide Case Study Starbucks Global Expansion Strategy Diagrams PDF
The slide carries a case study of Starbucks indicating the aim and strategies used by the company to expand its areas of operations. Various elements included are goals, strategies used and a roadmap representing the success of product expansion This modern and well arranged Global Business Market Development Guide Case Study Starbucks Global Expansion Strategy Diagrams PDF provides lots of creative possibilities. It is very simple to customize and edit with the Powerpoint Software. Just drag and drop your pictures into the shapes. All facets of this template can be edited with Powerpoint no extra software is necessary. Add your own material, put your images in the places assigned for them, adjust the colors, and then you can show your slides to the world, with an animated slide included.
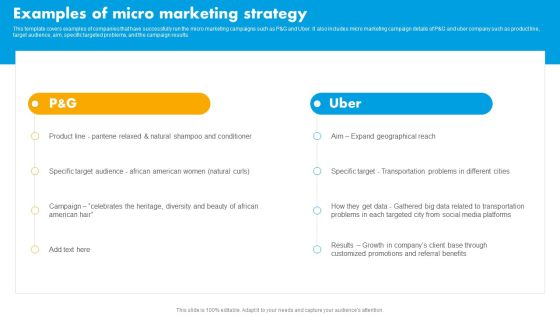
Integrating Effective Target Marketing Tactics Examples Of Micro Marketing Strategy Diagrams PDF
This template covers examples of companies that have successfully run the micro marketing campaigns such as P and G and Uber. It also includes micro marketing campaign details of P and G and uber company such as product line, target audience, aim, specific targeted problems, and the campaign results. Are you in need of a template that can accommodate all of your creative concepts This one is crafted professionally and can be altered to fit any style. Use it with Google Slides or PowerPoint. Include striking photographs, symbols, depictions, and other visuals. Fill, move around, or remove text boxes as desired. Test out color palettes and font mixtures. Edit and save your work, or work with colleagues. Download Integrating Effective Target Marketing Tactics Examples Of Micro Marketing Strategy Diagrams PDF and observe how to make your presentation outstanding. Give an impeccable presentation to your group and make your presentation unforgettable.

Comprehensive Guide To Manage Brand Portfolio Introduction To Brand Portfolio For Better Customer Diagrams PDF
This slide covers a brief overview of the brand portfolio. It also includes the two primary dimensions to be considered while creating a brand portfolio the breadth of the product mix and depth of branding. Present like a pro with Comprehensive Guide To Manage Brand Portfolio Introduction To Brand Portfolio For Better Customer Diagrams PDF Create beautiful presentations together with your team, using our easy to use presentation slides. Share your ideas in real time and make changes on the fly by downloading our templates. So whether you are in the office, on the go, or in a remote location, you can stay in sync with your team and present your ideas with confidence. With Slidegeeks presentation got a whole lot easier. Grab these presentations today.
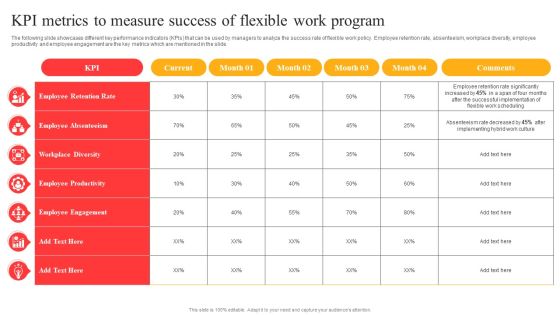
Flexible Working Policies And Guidelines Kpi Metrics To Measure Success Of Flexible Work Program Diagrams PDF
The following slide showcases different key performance indicators KPIs that can be used by managers to analyze the success rate of flexible work policy. Employee retention rate, absenteeism, workplace diversity, employee productivity and employee engagement are the key metrics which are mentioned in the slide. Coming up with a presentation necessitates that the majority of the effort goes into the content and the message you intend to convey. The visuals of a PowerPoint presentation can only be effective if it supplements and supports the story that is being told. Keeping this in mind our experts created Flexible Working Policies And Guidelines Kpi Metrics To Measure Success Of Flexible Work Program Diagrams PDF to reduce the time that goes into designing the presentation. This way, you can concentrate on the message while our designers take care of providing you with the right template for the situation.

Comprehensive Sports Event Marketing Plan Barriers To Sports Marketing With Actionable Solutions Diagrams PDF
This slide represents the ways in which sports sponsorships helps brands to increase customer reach and brand recognition. It includes benefits of sports sponsorships such as brand visibility, brand loyalty, increase in social media engagement etc. This slide represents the challenges faced by marketers in effectively promoting sporting events, products and services by using sports teams and athletes. It includes details related to barriers such as limited budget, measuring ROI etc. Slidegeeks is one of the best resources for PowerPoint templates. You can download easily and regulate Comprehensive Sports Event Marketing Plan Barriers To Sports Marketing With Actionable Solutions Diagrams PDF for your personal presentations from our wonderful collection. A few clicks is all it takes to discover and get the most relevant and appropriate templates. Use our Templates to add a unique zing and appeal to your presentation and meetings. All the slides are easy to edit and you can use them even for advertisement purposes.
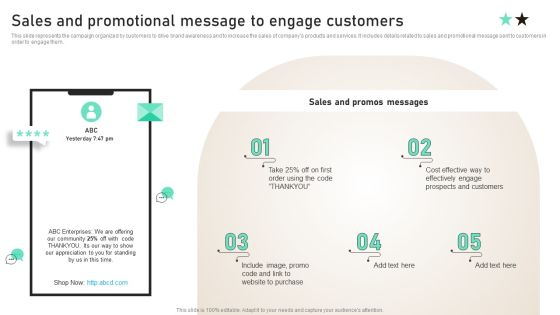
Sales And Promotional Message To Engage Customers Ppt PowerPoint Presentation File Diagrams PDF
This slide represents the campaign organized by customers to drive brand awareness and to increase the sales of companys products and services. It includes details related to sales and promotional message sent to customers in order to engage them. This Sales And Promotional Message To Engage Customers Ppt PowerPoint Presentation File Diagrams PDF from Slidegeeks makes it easy to present information on your topic with precision. It provides customization options, so you can make changes to the colors, design, graphics, or any other component to create a unique layout. It is also available for immediate download, so you can begin using it right away. Slidegeeks has done good research to ensure that you have everything you need to make your presentation stand out. Make a name out there for a brilliant performance.
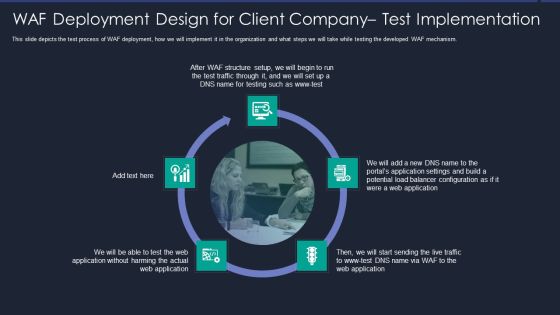
Web App Firewall Services IT WAF Deployment Design For Client Company Test Implementation Pictures PDF
This slide describes the production deployment and tuning phase of WAF deployment design, how both tasks would be accomplished, and then the final testing of WAF. This is a web app firewall services it waf deployment design for client company test implementation pictures pdf template with various stages. Focus and dispense information on two stages using this creative set, that comes with editable features. It contains large content boxes to add your information on topics like production network, development process, evaluating. You can also showcase facts, figures, and other relevant content using this PPT layout. Grab it now.

Playbook For Application Developers Project Development Planning With Gate Process Template PDF
This slide shows four phase project development plan that can be used by product development manager in showcasing various activities that will be performed in order to meet defined objectives. Deliver and pitch your topic in the best possible manner with this playbook for application developers project development planning with gate process template pdf Use them to share invaluable insights on product feature mapping across different goals and activities and impress your audience. This template can be altered and modified as per your expectations. So, grab it now.

BI Business Case And Roadmap With Development And Deployment BI Transformation Toolset Elements PDF
This slide covers the multiple stages involved in the implementation of the business intelligence system in the organization. Also, it contains information regarding the product selection and solution design phase of the BI project. This is a BI Business Case And Roadmap With Development And Deployment BI Transformation Toolset Elements PDF template with various stages. Focus and dispense information on three stages using this creative set, that comes with editable features. It contains large content boxes to add your information on topics like Solution Design, Product Selection, Requirements, Development. You can also showcase facts, figures, and other relevant content using this PPT layout. Grab it now.

Agile Software Development Lifecycle Formats PDF
This slide provides the glimpse about the agile software development lifecycle which focuses on concept, inception, construction iterations, transition, production and retirement phases. Presenting Agile Software Development Lifecycle Formats PDF to provide visual cues and insights. Share and navigate important information on six stages that need your due attention. This template can be used to pitch topics like Inception, Transition, Production, Retirement, Construction Iterations. In addtion, this PPT design contains high resolution images, graphics, etc, that are easily editable and available for immediate download.
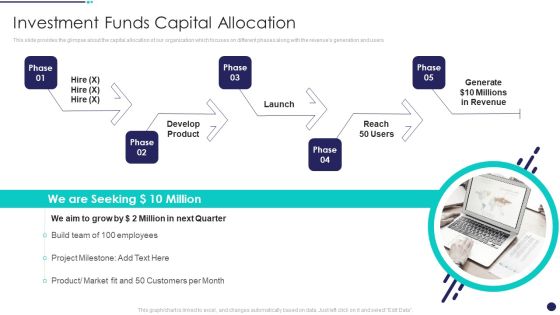
Investment Funds Utilization Investment Funds Capital Allocation Background PDF
This slide provides the glimpse about the capital allocation of our organization which focuses on different phases along with the revenues generation and users Presenting Investment Funds Utilization Investment Funds Capital Allocation Background PDF to provide visual cues and insights. Share and navigate important information on five stages that need your due attention. This template can be used to pitch topics like Develop Product, Project Milestone, Product Or Market In addtion, this PPT design contains high resolution images, graphics, etc, that are easily editable and available for immediate download.
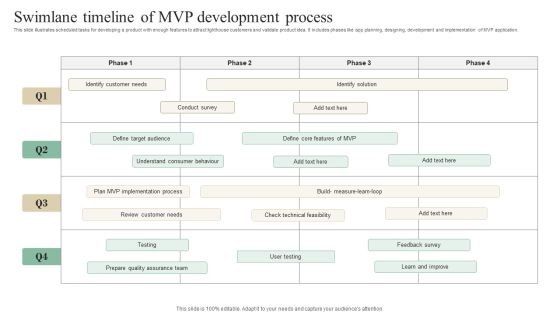
Swimlane Timeline Of MVP Development Process Demonstration PDF
This slide illustrates scheduled tasks for developing a product with enough features to attract lighthouse customers and validate product idea. It includes phases like app planning, designing, development and implementation of MVP application. Showcasing this set of slides titled Swimlane Timeline Of MVP Development Process Demonstration PDF. The topics addressed in these templates are Conduct Survey, Quality Assurance Team, Implementation Process. All the content presented in this PPT design is completely editable. Download it and make adjustments in color, background, font etc. as per your unique business setting.

Brand Ecosystem Tactics And Brand Architecture Stages Of Brand Portfolio Strategy Background PDF
This slide covers various brand portfolio phases with a management system such as renovation and rationalization, identification of growth opportunities, and optimization. This Brand Ecosystem Tactics And Brand Architecture Stages Of Brand Portfolio Strategy Background PDF is perfect for any presentation, be it in front of clients or colleagues. It is a versatile and stylish solution for organizing your meetings. The product features a modern design for your presentation meetings. The adjustable and customizable slides provide unlimited possibilities for acing up your presentation. Slidegeeks has done all the homework before launching the product for you. So, do not wait, grab the presentation templates today

Cloud Adoption Case Implementation Stages Designs PDF
This slide shows implementing phases of business cloud system. This purpose of slide is to clarify sub-activities included in every stage. It includes discovery stage, start building plan and stabilize production, etc. Persuade your audience using this Cloud Adoption Case Implementation Stages Designs PDF. This PPT design covers three stages, thus making it a great tool to use. It also caters to a variety of topics including Cloud Migration Plan, Start Building Plan, Stabilize Production. Download this PPT design now to present a convincing pitch that not only emphasizes the topic but also showcases your presentation skills.

Hierarchy Process For Corporate Management Team Ppt Slide
This is a hierarchy process for corporate management team ppt slide. This is a three stage process. The stages in this process are management, sales, production, development, north, south, parts, series, hardware, software.
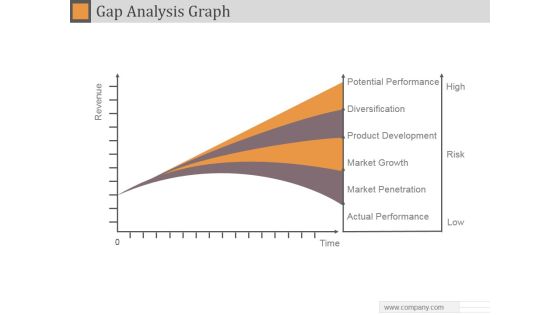
Gap Analysis Graph Ppt PowerPoint Presentation Example 2015
This is a gap analysis graph ppt powerpoint presentation example 2015. This is a four stage process. The stages in this process are potential performance, diversification, product development, market growth, market penetration, actual performance.
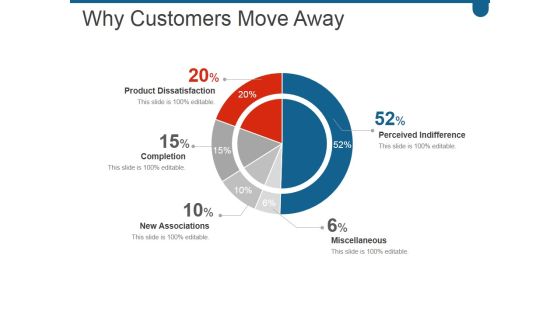
Why Customers Move Away Ppt PowerPoint Presentation Outline Mockup
This is a why customers move away ppt powerpoint presentation outline mockup. This is a five stage process. The stages in this process are product dissatisfaction, completion, new associations, perceived indifference, miscellaneous.

Internet Marketing Objectives Ppt PowerPoint Presentation Layouts Smartart
This is a internet marketing objectives ppt powerpoint presentation layouts smartart. This is a six stage process. The stages in this process are sales leads, product types, sales revenue, profit margins, repeat sales, web visitors.

Clustered Column Line Ppt Powerpoint Presentation Ideas Inspiration
This is a clustered column line ppt powerpoint presentation ideas inspiration. This is a four stage process. The stages in this process are product, in percentage, graph, management, business.
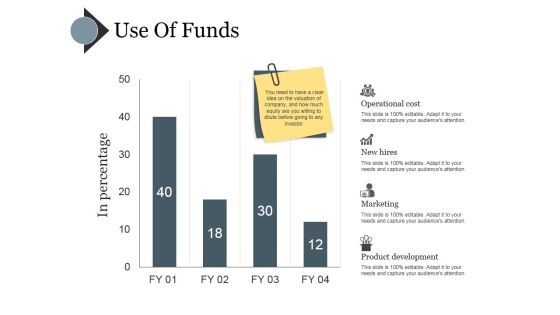
Use Of Funds Ppt PowerPoint Presentation Portfolio Clipart
This is a use of funds ppt powerpoint presentation portfolio clipart. This is a four stage process. The stages in this process are operational cost, new hires, marketing, product development.
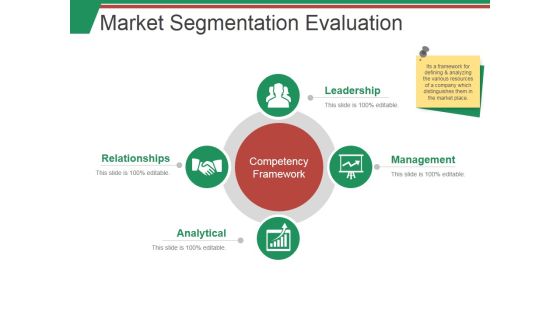
Market Segmentation Evaluation Template 1 Ppt PowerPoint Presentation Summary Smartart
This is a market segmentation evaluation template 1 ppt powerpoint presentation summary smartart. This is a two stage process. The stages in this process are market sales, net profit, beverages, milk product, nutrition.
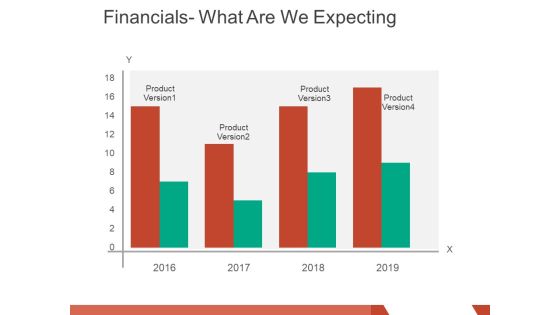
financials what are we expecting ppt powerpoint presentation layouts graphics pictures
This is a financials what are we expecting ppt powerpoint presentation layouts graphics pictures. This is a four stage process. The stages in this process are product version, business, marketing, finance, graph.
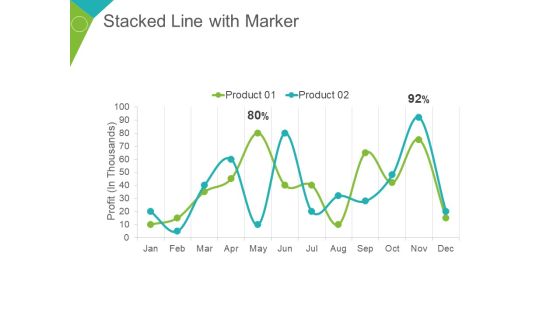
Stacked Line With Marker Ppt PowerPoint Presentation Summary Demonstration
This is a stacked line with marker ppt powerpoint presentation summary demonstration. This is a two stage process. The stages in this process are profit in thousands, product, percentage, finance, business.

Bar Graph Ppt PowerPoint Presentation Portfolio Example
This is a bar graph ppt powerpoint presentation portfolio example. This is a three stage process. The stages in this process are sales in percentage, year, business, product, business, graph.

Clustered Column Line Ppt PowerPoint Presentation Infographics Templates
This is a clustered column line ppt powerpoint presentation infographics templates. This is a three stage process. The stages in this process are in percentage, business, marketing, product, finance, graph.
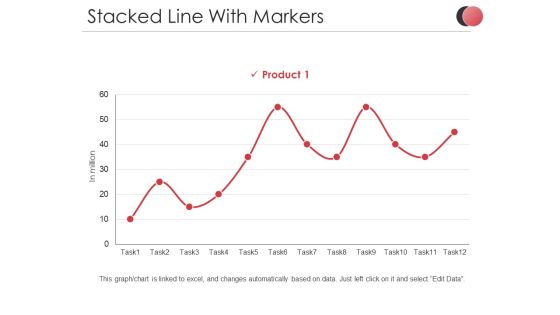
Stacked Line With Markers Ppt PowerPoint Presentation Slides Demonstration
This is a stacked line with markers ppt powerpoint presentation slides demonstration. This is a one stage process. The stages in this process are in million, product, percentage, business, marketing, finance.

Stacked Column Ppt PowerPoint Presentation Infographics Samples
This is a stacked column ppt powerpoint presentation infographics samples. This is a two stage process. The stages in this process are product, sales in percentage, business, marketing, graph.

Bar Graph Template 1 Ppt PowerPoint Presentation Slides Format Ideas
This is a bar graph template 1 ppt powerpoint presentation slides format ideas. This is a three stage process. The stages in this process are product, years, bar graph, business, marketing.

Clustered Column Ppt PowerPoint Presentation Ideas Graphic Tips
This is a clustered column ppt powerpoint presentation ideas graphic tips. This is a two stage process. The stages in this process are financial year, sales in percentage, product, graph, business.
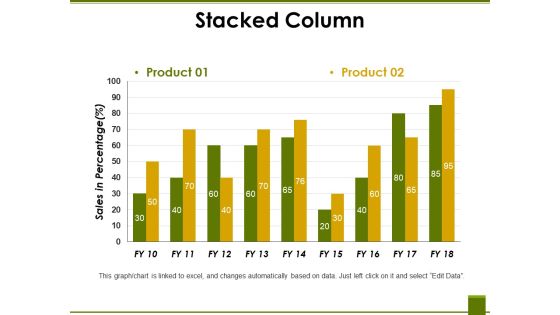
Stacked Column Ppt PowerPoint Presentation Professional Vector
This is a stacked column ppt powerpoint presentation professional vector. This is a two stage process. The stages in this process are product, sales in percentage, business, marketing, graph.

Stacked Line Ppt PowerPoint Presentation Infographic Template Graphics Template
This is a stacked line ppt powerpoint presentation infographic template graphics template. This is a three stage process. The stages in this process are product, in percentage, business, marketing, finance.

Clustered Column Line Ppt PowerPoint Presentation Inspiration Layouts
This is a clustered column line ppt powerpoint presentation inspiration layouts. This is a four stage process. The stages in this process are in percentage, product, business, strategy, graph.

Clustered Column Ppt PowerPoint Presentation Portfolio Smartart
This is a clustered column ppt powerpoint presentation portfolio smartart. This is a two stage process. The stages in this process are financial year, product, sales in percentage, finance, business, graph.

Clustered Column Ppt PowerPoint Presentation Pictures Mockup
This is a clustered column ppt powerpoint presentation pictures mockup. This is a two stage process. The stages in this process are product, sales in percentage, financial year, graph, business.

Clustered Bar Ppt PowerPoint Presentation Show Slide Portrait
This is a clustered bar ppt powerpoint presentation show slide portrait. This is a four stage process. The stages in this process are product, unit count, graph, business, marketing.

Clustered Column Ppt PowerPoint Presentation Professional Graphic Tips
This is a clustered column ppt powerpoint presentation professional graphic tips. This is a two stage process. The stages in this process are product, profit in percentage, graph, business, marketing.

Stacked Column Ppt PowerPoint Presentation Professional Template
This is a stacked column ppt powerpoint presentation professional template. This is a nine stage process. The stages in this process are product, profit million dollars, business, marketing, graph.

Stacked Line With Marker Ppt PowerPoint Presentation Professional Pictures
This is a stacked line with marker ppt powerpoint presentation professional pictures. This is a twelve stage process. The stages in this process are product, profit in thousands, business, graph, marketing.

Market Analysis Ppt PowerPoint Presentation Show Design Inspiration
This is a market analysis ppt powerpoint presentation show design inspiration. This is a four stage process. The stages in this process are market segmentation, product market mapping, competitive strategies, market attractiveness.

Clustered Column Ppt PowerPoint Presentation Slides Smartart
This is a clustered column ppt powerpoint presentation slides smartart. This is a two stage process. The stages in this process are product, sales in percentage, financial year, bar graph.
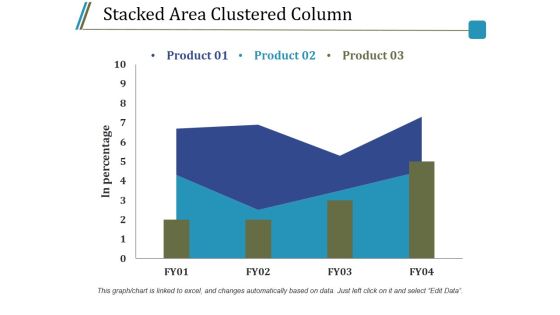
Stacked Area Clustered Column Ppt PowerPoint Presentation Model Guidelines
This is a stacked area clustered column ppt powerpoint presentation model guidelines. This is a three stage process. The stages in this process are product, in percentage, bar graph, growth, success.

Stacked Line With Markers Ppt PowerPoint Presentation Infographic Template Graphics Example
This is a stacked line with markers ppt powerpoint presentation infographic template graphics example. This is a one stage process. The stages in this process are in million, task, product, finance, line graph.
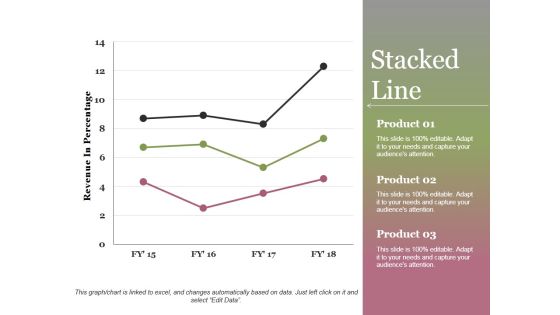
Stacked Line Ppt PowerPoint Presentation Show
This is a stacked line ppt powerpoint presentation show. This is a three stage process. The stages in this process are revenue in percentage, product, stacked line, growth, success.

Stacked Area Clustered Column Ppt PowerPoint Presentation File Background Designs
This is a stacked area clustered column ppt powerpoint presentation file background designs. This is a three stage process. The stages in this process are product, in percentage, growth, success, bar graph.

Clustered Column Template 1 Ppt PowerPoint Presentation Outline File Formats
This is a clustered column template 1 ppt powerpoint presentation outline file formats. This is a two stage process. The stages in this process are product, bar graph, success, growth, finance.

Clustered Column Template 2 Ppt PowerPoint Presentation Summary Smartart
This is a clustered column template 2 ppt powerpoint presentation summary smartart. This is a two stage process. The stages in this process are product, bar graph, in percentage, clustered column, growth.
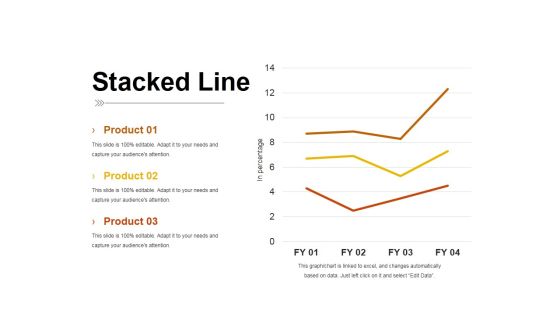
Stacked Line Ppt PowerPoint Presentation Inspiration Pictures
This is a stacked line ppt powerpoint presentation inspiration pictures. This is a three stage process. The stages in this process are product, stacked line, in percentage, business, growth.
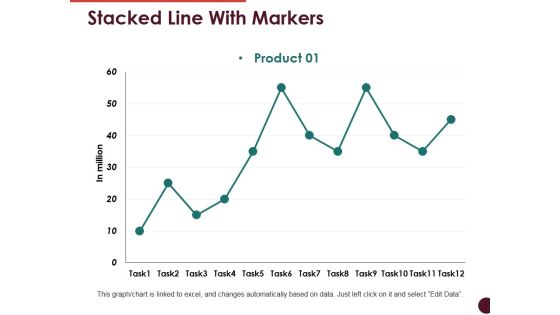
Stacked Line With Markers Ppt PowerPoint Presentation Show Templates
This is a stacked line with markers ppt powerpoint presentation show templates. This is a one stage process. The stages in this process are product, bar graph, growth, success, business.
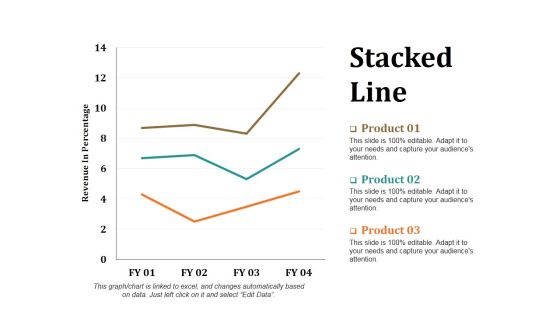
Stacked Line Ppt PowerPoint Presentation Layouts Portrait
This is a stacked line ppt powerpoint presentation layouts portrait. This is a three stage process. The stages in this process are revenue in percentage, stacked line, product, growth, success.
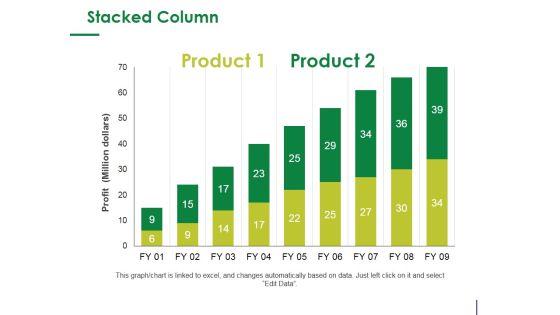
Stacked Column Ppt PowerPoint Presentation Infographic Template Design Ideas
This is a stacked column ppt powerpoint presentation infographic template design ideas. This is a two stage process. The stages in this process are product, profit, bar graph, growth, success.

Clustered Column Line Ppt PowerPoint Presentation Summary Background Image
This is a clustered column line ppt powerpoint presentation summary background image. This is a four stage process. The stages in this process are in percentage, product, graph, growth, success.

Clustered Column Ppt PowerPoint Presentation File Graphics
This is a clustered column ppt powerpoint presentation file graphics. This is a two stage process. The stages in this process are product, financial year, sales in percentage, graph, growth.
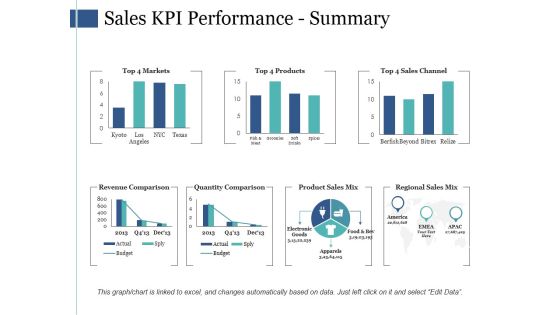
Sales Kpi Performance Summary Ppt PowerPoint Presentation Infographic Template Infographics
This is a sales kpi performance summary ppt powerpoint presentation infographic template infographics. This is a seven stage process. The stages in this process are revenue comparison, quantity comparison, product sales mix, regional sales mix.
Sales Kpi Tracker Ppt PowerPoint Presentation Visual Aids Files
This is a sales kpi tracker ppt powerpoint presentation visual aids files. This is a six stage process. The stages in this process are leads created, sales ratio, opportunities won, top products in revenue, open deals vs last yr.

Sales Kpi Performance Summary Ppt PowerPoint Presentation Ideas Graphics Template
This is a sales kpi performance summary ppt powerpoint presentation ideas graphics template. This is a seven stage process. The stages in this process are revenue comparison, quantity comparison, product sales mix, regional sales mix.
Sales Kpi Tracker Ppt PowerPoint Presentation Pictures Designs
This is a sales kpi tracker ppt powerpoint presentation pictures designs. This is a two stage process. The stages in this process are leads created, sales ratio, opportunities won, top products in revenue, win ratio vs last yr.

Bar Graph Ppt PowerPoint Presentation File Slides
This is a bar graph ppt powerpoint presentation file slides. This is a three stage process. The stages in this process are product, sales in percentage, bar graph, growth, success.

Stacked Column Ppt PowerPoint Presentation Layouts Example
This is a stacked column ppt powerpoint presentation layouts example. This is a two stage process. The stages in this process are product, stacked column, bar graph, growth, success.

Clustered Column Ppt PowerPoint Presentation Visual Aids Show
This is a clustered column ppt powerpoint presentation visual aids show. This is a two stage process. The stages in this process are product, profit, business, bar graph, finance.

Clustered Column Line Ppt PowerPoint Presentation Pictures Example
This is a clustered column line ppt powerpoint presentation pictures example. This is a three stage process. The stages in this process are product, in percentage, bar graph, growth, success.

Clustered Column Line Ppt PowerPoint Presentation Infographic Template Pictures
This is a clustered column line ppt powerpoint presentation infographic template pictures. This is a three stage process. The stages in this process are product, in percentage, bar graph, growth, success.

Clustered Column Line Ppt PowerPoint Presentation Topics
This is a clustered column line ppt powerpoint presentation topics. This is a three stage process. The stages in this process are product, in percentage, growth, bar graph, business.

Stacked Area Clustered Column Ppt PowerPoint Presentation Gallery Gridlines
This is a stacked area clustered column ppt powerpoint presentation gallery gridlines. This is a three stage process. The stages in this process are bar graph, product, in percentage.
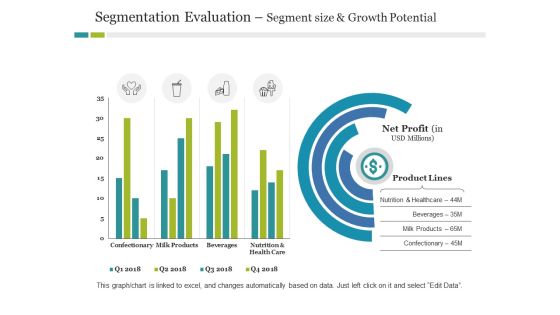
Segmentation Evaluation Segment Size And Growth Potential Ppt PowerPoint Presentation Infographic Template Outline
This is a segmentation evaluation segment size and growth potential ppt powerpoint presentation infographic template outline. This is a two stage process. The stages in this process are business, product lines, finance, marketing, strategy.

Bar Graph Ppt PowerPoint Presentation Portfolio Slide Portrait
This is a bar graph ppt powerpoint presentation portfolio slide portrait. This is a three stage process. The stages in this process are product, sales in percentage, bar graph, growth, success.
Sales Kpi Tracker Ppt PowerPoint Presentation Pictures Layout Ideas
This is a sales kpi tracker ppt powerpoint presentation pictures layout ideas. This is a four stage process. The stages in this process are opportunities won, top products in revenue, leads created, win ratio vs last yr, open deals vs.
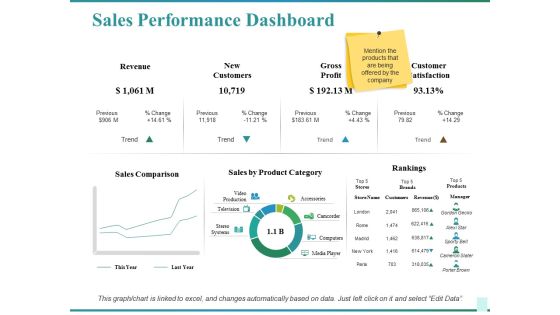
Sales Performance Dashboard Ppt PowerPoint Presentation Show Graphics Design
This is a sales performance dashboard ppt powerpoint presentation show graphics design. This is a two stage process. The stages in this process are sales comparison, sales by product category, rankings, customer satisfaction, revenue.

Scatter Line Ppt PowerPoint Presentation Styles Graphics Pictures
This is a scatter line ppt powerpoint presentation styles graphics pictures. This is a one stage process. The stages in this process are product, dollar in millions, sales in percentage.

Sales Performance Dashboard Template Ppt PowerPoint Presentation Professional Elements
This is a sales performance dashboard template ppt powerpoint presentation professional elements. This is a eight stage process. The stages in this process are sales comparison, sales by product category, sales by month, brand profitability, revenue.
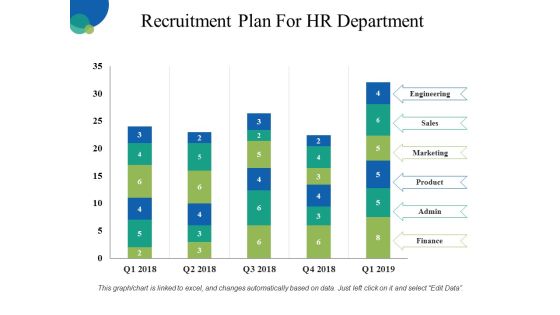
Recruitment Plan For HR Department Ppt PowerPoint Presentation Inspiration Layout Ideas
This is a recruitment plan for hr department ppt powerpoint presentation inspiration layout ideas. This is a five stage process. The stages in this process are engineering, sales, marketing, product, finance.

Scatter Line Ppt PowerPoint Presentation Infographics Background Images
This is a scatter line ppt powerpoint presentation infographics background images. This is a one stage process. The stages in this process are dollar in millions, product, sales in percentage.

Company Sales And Performance Dashboard Ppt PowerPoint Presentation Show Structure
This is a company sales and performance dashboard ppt powerpoint presentation show structure. This is a four stage process. The stages in this process are year product sales, month growth in revenue, profit margins graph, year profits.

Recruitment Plan For Hr Department Ppt PowerPoint Presentation Show
This is a recruitment plan for hr department ppt powerpoint presentation show. This is a five stage process. The stages in this process are engineering, sales, marketing, product, finance.

Area Stacked Ppt PowerPoint Presentation Infographics Shapes
This is a area stacked ppt powerpoint presentation infographics shapes. This is a two stage process. The stages in this process are product, area stacked, sales in percentage, financial year.

Stacked Area Clustered Column Ppt PowerPoint Presentation Summary Slides
This is a stacked area clustered column ppt powerpoint presentation summary slides. This is a three stage process. The stages in this process are product, in percentage, financial year, bar graph.

Stacked Area Clustered Column Ppt PowerPoint Presentation Professional Influencers
This is a stacked area clustered column ppt powerpoint presentation professional influencers. This is a three stage process. The stages in this process are stacked area clustered column, percentage, product, year.
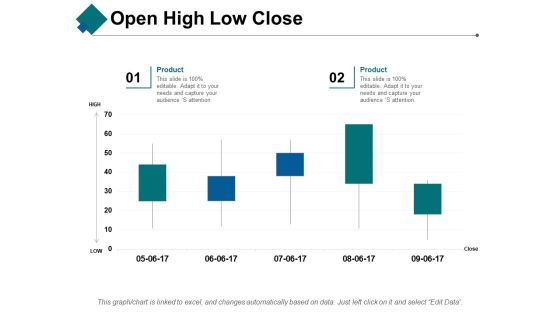
Open High Low Close Ppt PowerPoint Presentation Show Aids
This is a open high low close ppt powerpoint presentation show aids. This is a two stage process. The stages in this process are open, high, low, close, product.

Clustered Bar Ppt PowerPoint Presentation Slides Example Topics
This is a clustered bar ppt powerpoint presentation slides example topics. This is a two stage process. The stages in this process are clustered bar, product, unit count, business, marketing.

Volume Open High Low Close Ppt PowerPoint Presentation Slides Maker
This is a volume open high low close ppt powerpoint presentation slides maker. This is a two stage process. The stages in this process are volume, open, high, low, close, product.

Open High Low Close Ppt PowerPoint Presentation Model Good
This is a open high low close ppt powerpoint presentation model good. This is a two stage process. The stages in this process are open, high, low, close, product.
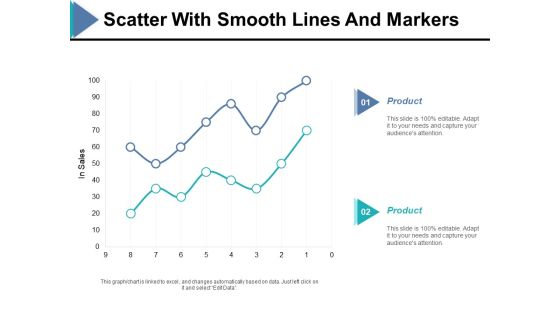
Scatter With Smooth Lines And Markers Ppt PowerPoint Presentation Ideas Example
This is a scatter with smooth lines and markers ppt powerpoint presentation ideas example. This is a two stage process. The stages in this process are in sales, finance, bar graph, product, business.

Bar Graph Ppt PowerPoint Presentation Styles Skills
This is a bar graph ppt powerpoint presentation styles skills. This is a two stage process. The stages in this process are bar graph, product, in year, in percentage, business.

Clustered Bar Capability Maturity Matrix Ppt PowerPoint Presentation Summary Show
This is a clustered bar capability maturity matrix ppt powerpoint presentation summary show. This is a three stage process. The stages in this process are clustered bar, product, year, business, marketing.

Clustered Column Capability Maturity Matrix Ppt PowerPoint Presentation Pictures Slideshow
This is a clustered column capability maturity matrix ppt powerpoint presentation pictures slideshow. This is a three stage process. The stages in this process are clustered column, product, year, business, marketing.

Stacked Column Capability Maturity Matrix Ppt PowerPoint Presentation Model Shapes
This is a stacked column capability maturity matrix ppt powerpoint presentation model shapes. This is a three stage process. The stages in this process are stacked column, product, year, finance, business.
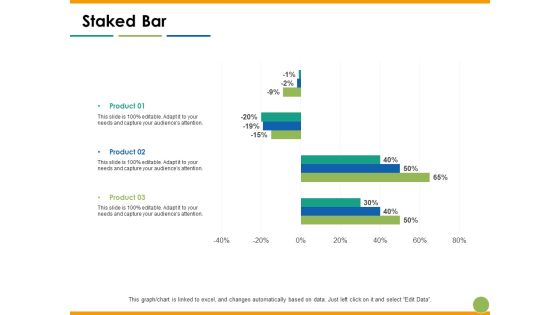
Staked Bar Capability Maturity Matrix Ppt PowerPoint Presentation Slides Outfit
This is a staked bar capability maturity matrix ppt powerpoint presentation slides outfit. This is a three stage process. The stages in this process are staked bar, product, year, finance, percentage.

Hiring Plan Positions By Quarter Ppt PowerPoint Presentation Slides Deck
This is a hiring plan positions by quarter ppt powerpoint presentation slides deck. This is a five stage process. The stages in this process are percentage, product, business, management.
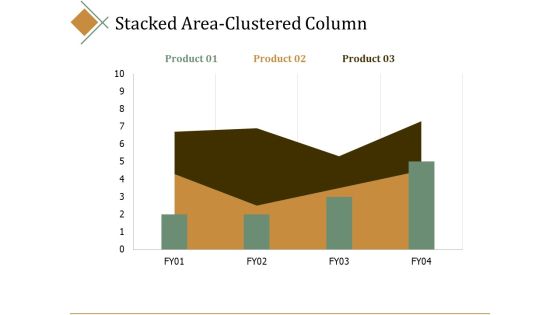
Stacked Area Clustered Column Ppt PowerPoint Presentation Infographics Portrait
This is a stacked area clustered column ppt powerpoint presentation infographics portrait. This is a three stage process. The stages in this process are percentage, product, business, management, marketing.

Clustered Bar Financial Ppt PowerPoint Presentation Gallery Designs Download
This is a clustered bar financial ppt powerpoint presentation gallery designs download. This is a three stage process. The stages in this process are percentage, product, business, management, marketing.

Clustered Column Line Financial Ppt PowerPoint Presentation Summary Slide
This is a clustered column line financial ppt powerpoint presentation summary slide. This is a three stage process. The stages in this process are business, management, marketing, product, percentage.
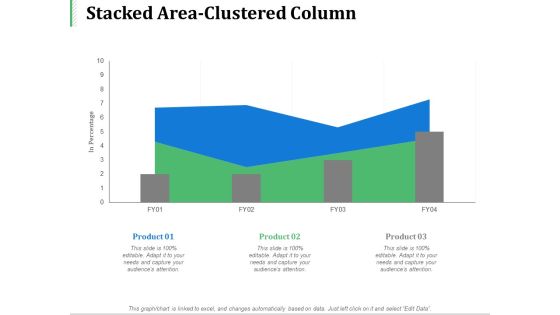
Stacked Area Clustered Column Marketing Ppt PowerPoint Presentation Infographic Template Vector
This is a stacked area clustered column marketing ppt powerpoint presentation infographic template vector. This is a three stage process. The stages in this process are business, management, marketing, product, percentage.

Employee Weekly Efficiency Dashboard Ppt PowerPoint Presentation Infographic Template Graphic Images
This is a employee weekly efficiency dashboard ppt powerpoint presentation infographic template graphic images. This is a six stage process. The stages in this process are percentage, product, business, management, marketing.
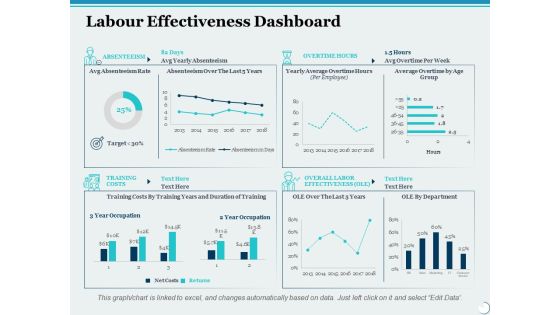
Labour Effectiveness Dashboard Ppt PowerPoint Presentation Slides File Formats
This is a labour effectiveness dashboard ppt powerpoint presentation slides file formats. This is a four stage process. The stages in this process are percentage, product, management, marketing, business.

Negative Impacts Of Workplace Stress Ppt PowerPoint Presentation Outline Slide Download
This is a negative impacts of workplace stress ppt powerpoint presentation outline slide download. This is a five stage process. The stages in this process are percentage, product, management, marketing, business.

Budgeting Planned Actual Comparison Ppt PowerPoint Presentation Visual Aids Gallery
This is a budgeting planned actual comparison ppt powerpoint presentation visual aids gallery. This is a three stage process. The stages in this process are business, management, marketing, percentage, product.

Cost Performance Index Ppt PowerPoint Presentation Inspiration Graphics Example
This is a cost performance index ppt powerpoint presentation inspiration graphics example. This is a three stage process. The stages in this process are business, management, marketing, percentage, product.

Project Health Card Resourcing Ppt PowerPoint Presentation Summary Graphics Download
This is a project health card resourcing ppt powerpoint presentation summary graphics download. This is a six stage process. The stages in this process are business, management, marketing, percentage, product.
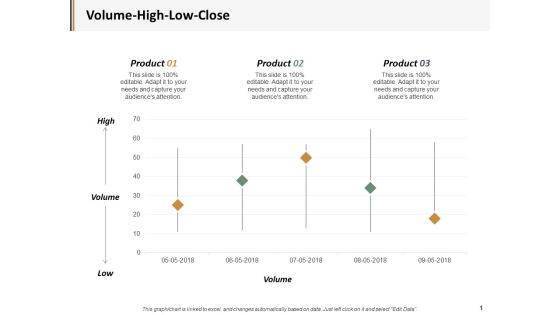
Volume High Low Close Ppt PowerPoint Presentation Ideas Example Introduction
This is a volume high low close ppt powerpoint presentation ideas example introduction. This is a three stage process. The stages in this process are business, management, marketing, percentage, product.

Budgeting Planned Actual Comparison Ppt PowerPoint Presentation Styles File Formats
This is a budgeting planned actual comparison ppt powerpoint presentation styles file formats. This is a three stage process. The stages in this process are product, percentage, business, management, marketing.

Comparison Male And Female Ppt PowerPoint Presentation Professional Skills
This is a comparison male and female ppt powerpoint presentation professional skills. This is a two stage process. The stages in this process are product, percentage, business, management, marketing.
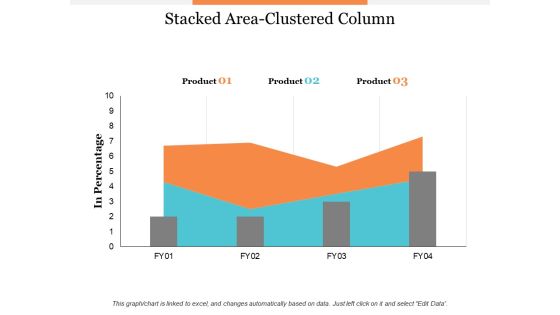
Stacked Area Clustered Column Ppt PowerPoint Presentation Infographic Template Summary
This is a stacked area clustered column ppt powerpoint presentation infographic template summary. This is a three stage process. The stages in this process are business, management, marketing, percentage, product.

Stacked Area Clustered Column Ppt PowerPoint Presentation Model Slides
This is a stacked area clustered column ppt powerpoint presentation model slides. This is a three stage process. The stages in this process are business, management, percentage, product, marketing.

Cost Performance Index Ppt PowerPoint Presentation Infographics Mockup
This is a cost performance index ppt powerpoint presentation infographics mockup. This is a three stage process. The stages in this process are finance, marketing, management, investment, product, percentage.
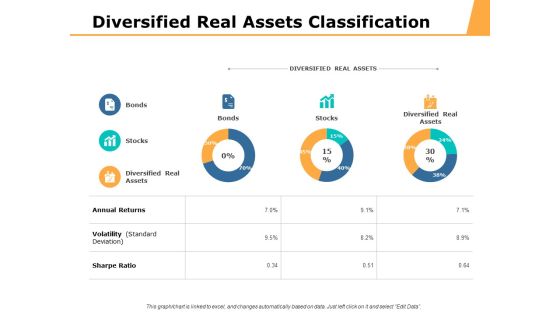
Diversified Real Assets Classification Ppt PowerPoint Presentation Ideas Tips
This is a diversified real assets classification ppt powerpoint presentation ideas tips. This is a three stage process. The stages in this process are percentage, product, business, management, marketing.

Investments In Real Assets Ppt PowerPoint Presentation Styles Pictures
This is a investments in real assets ppt powerpoint presentation styles pictures. This is a three stage process. The stages in this process are percentage, product, business, management, marketing.

Portfolio Management Securities Allocation Dashboard Ppt PowerPoint Presentation Professional Design Ideas
This is a portfolio management securities allocation dashboard ppt powerpoint presentation professional design ideas. This is a four stage process. The stages in this process are percentage product, business, management, marketing.

Portfolio Summary Management Dashboard Ppt PowerPoint Presentation File Design Templates
This is a portfolio summary management dashboard ppt powerpoint presentation file design templates. This is a five stage process. The stages in this process are percentage product, business, management, marketing.

Clustered Column Line Analysis Ppt PowerPoint Presentation Layouts Visual Aids
This is a clustered column line analysis ppt powerpoint presentation layouts visual aids. This is a three stage process. The stages in this process are percentage, product, business, management.

Determine The First Platform You Want To Build The App On Ios Or Android Ppt PowerPoint Presentation Pictures Master Slide
This is a determine the first platform you want to build the app on ios or android ppt powerpoint presentation pictures master slide. This is a two stage process. The stages in this process are business, management, marketing, percentage, product.
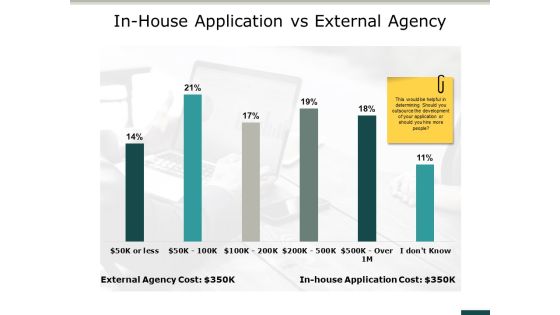
In House Application Vs External Agency Ppt PowerPoint Presentation Portfolio Images
This is a in house application vs external agency ppt powerpoint presentation portfolio images. This is a two stage process. The stages in this process are business, management, marketing, parentage, product.
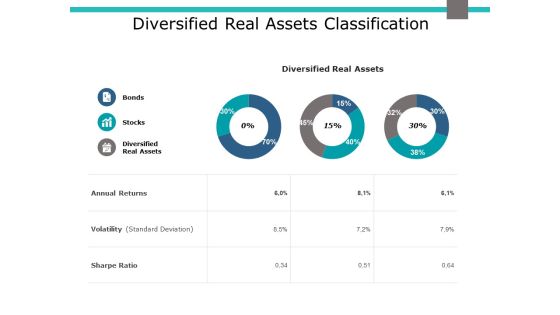
Diversified Real Assets Classification Ppt PowerPoint Presentation Slides Grid
This is a diversified real assets classification ppt powerpoint presentation slides grid. This is a three stage process. The stages in this process are business, management, marketing, percentage, product.

Customer Brand Lifecycle With Purchase And Adopt Ppt PowerPoint Presentation Gallery Visual Aids PDF
This slide exhibits customer journey automation process with evaluation and discovery management. It includes major elements such as- analyze problem, conduct combined meetings and so on. Presenting customer brand lifecycle with purchase and adopt ppt powerpoint presentation gallery visual aids pdf to dispense important information. This template comprises six stages. It also presents valuable insights into the topics including discover, evaluate, adopt. This is a completely customizable PowerPoint theme that can be put to use immediately. So, download it and address the topic impactfully.
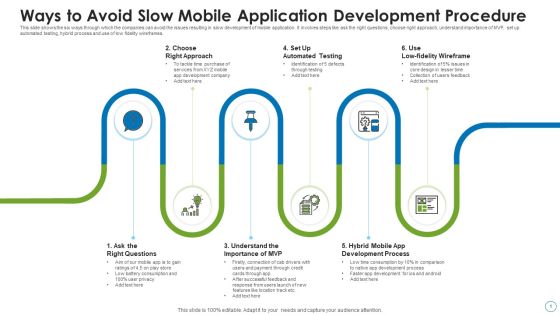
Ways To Avoid Slow Mobile Application Development Procedure Elements PDF
This slide shows the six ways through which the companies can avoid the issues resulting in slow development of mobile application. It involves steps like ask the right questions, choose right approach, understand importance of MVP, set up automated testing, hybrid process and use of low fidelity wireframes. Presenting ways to avoid slow mobile application development procedure elements pdf to dispense important information. This template comprises six stages. It also presents valuable insights into the topics including choose right approach, low fidelity wireframe, hybrid mobile app development process. This is a completely customizable PowerPoint theme that can be put to use immediately. So, download it and address the topic impactfully.
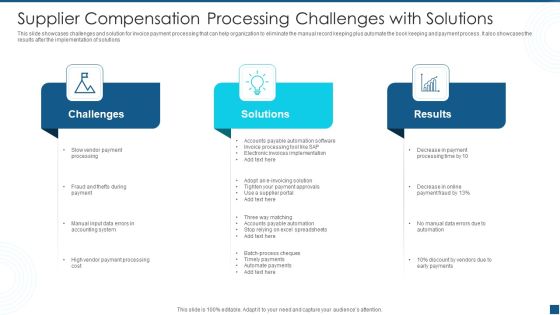
Supplier Compensation Processing Challenges With Solutions Template PDF
This slide showcases challenges and solution for invoice payment processing that can help organization to eliminate the manual record keeping plus automate the book keeping and payment process. It also showcases the results after the implementation of solutions. Presenting supplier compensation processing challenges with solutions template pdf to dispense important information. This template comprises three stages. It also presents valuable insights into the topics including challenges, solutions, results. This is a completely customizable PowerPoint theme that can be put to use immediately. So, download it and address the topic impactfully.

Logistics And Delivery Strategies With Business Objectives Rules PDF
This slide showcases the international, domestic, and city Supply Chain Management Strategy for achieving business goals. It includes connected and automated transportation, real time planning infrastructure, bundling container transport services, delivery route planning, etc. Presenting logistics and delivery strategies with business objectives rules pdf to dispense important information. This template comprises three stages. It also presents valuable insights into the topics including domestic logistics, international logistics, city logistics. This is a completely customizable PowerPoint theme that can be put to use immediately. So, download it and address the topic impactfully.

Test Computerized Framework For Software Development Elements PDF
This slide shows the test automation architecture for software development which covers test intent, business layers like pages, models and resources such as webservice utilities, loggers, custom reporters, etc. Presenting test computerized framework for software development elements pdf to dispense important information. This template comprises one stages. It also presents valuable insights into the topics including application programming, webservice utilities, resource handlers. This is a completely customizable PowerPoint theme that can be put to use immediately. So, download it and address the topic impactfully.

Human Resource Technology Evolution And Growth Over Years Roadmap Demonstration PDF
This slide shows the roadmap which represents how the use and implementation of technology in HR workforce has evolved and emerged over the years. It includes stages of automation, integration, engagement and growth. Presenting human resource technology evolution and growth over years roadmap demonstration pdf to dispense important information. This template comprises three stages. It also presents valuable insights into the topics including talent management, people management, growth. This is a completely customizable PowerPoint theme that can be put to use immediately. So, download it and address the topic impactfully.

Comprehensive Checklist For Email Marketing Techniques Ppt PowerPoint Presentation File Background Designs PDF
Mentioned slide illustrates checklist which can be used by marketer to build comprehensive email marketing strategy for the company. Services required of marketing agency, prospects shortlisted to whom emails have to be sent, requirement of automated series of email are some of the key checkpoints. Presenting comprehensive checklist for email marketing techniques ppt powerpoint presentation file background designs pdf to dispense important information. This template comprises eight stages. It also presents valuable insights into the topics including email marketing agency, marketing campaign, mobile users. This is a completely customizable PowerPoint theme that can be put to use immediately. So, download it and address the topic impactfully.
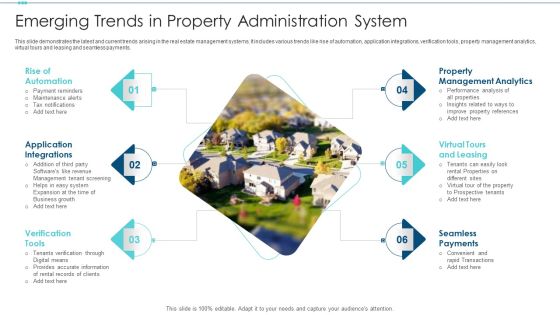
Emerging Trends In Property Administration System Inspiration PDF
This slide demonstrates the latest and current trends arising in the real estate management systems. It includes various trends like rise of automation, application integrations, verification tools, property management analytics, virtual tours and leasing and seamless payments. Presenting emerging trends in property administration system inspiration pdf to dispense important information. This template comprises six stages. It also presents valuable insights into the topics including management analytics, revenue, application. This is a completely customizable PowerPoint theme that can be put to use immediately. So, download it and address the topic impactfully.
 Home
Home