AI PPT Maker
Templates
PPT Bundles
Design Services
Business PPTs
Business Plan
Management
Strategy
Introduction PPT
Roadmap
Self Introduction
Timelines
Process
Marketing
Agenda
Technology
Medical
Startup Business Plan
Cyber Security
Dashboards
SWOT
Proposals
Education
Pitch Deck
Digital Marketing
KPIs
Project Management
Product Management
Artificial Intelligence
Target Market
Communication
Supply Chain
Google Slides
Research Services
 One Pagers
All Categories
-
Home
- Customer Favorites
- Manufacturing Icon
Manufacturing Icon

Area Chart Ppt PowerPoint Presentation Gallery Example Topics
This is a area chart ppt powerpoint presentation gallery example topics. This is a two stage process. The stages in this process are product, growth, finance, management, business.
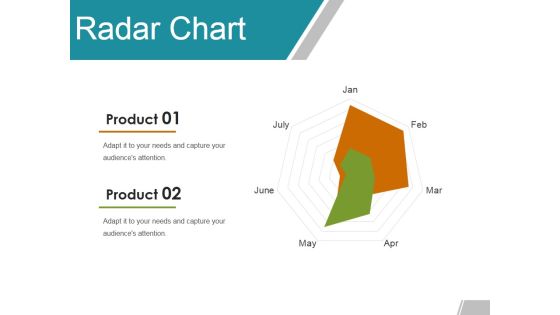
Radar Chart Ppt PowerPoint Presentation Gallery Example Topics
This is a radar chart ppt powerpoint presentation gallery example topics. This is a seven stage process. The stages in this process are product, business, marketing, shapes.

Area Chart Ppt PowerPoint Presentation Infographic Template Show
This is a area chart ppt powerpoint presentation infographic template show. This is a two stage process. The stages in this process are product, marketing, management, business, success.

Column Chart Ppt PowerPoint Presentation Infographic Template Layouts
This is a column chart ppt powerpoint presentation infographic template layouts. This is a nine stage process. The stages in this process are product, growth, success, business, graph.
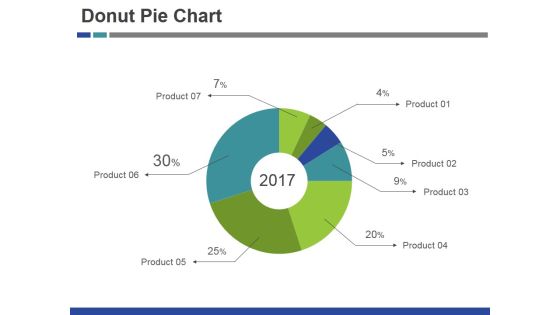
Donut Pie Chart Ppt PowerPoint Presentation Infographics Images
This is a donut pie chart ppt powerpoint presentation infographics images. This is a seven stage process. The stages in this process are product, year, pie, process, business.

Donut Pie Chart Ppt PowerPoint Presentation Slides Example
This is a donut pie chart ppt powerpoint presentation slides example. This is a five stage process. The stages in this process are product, finance, business, process.
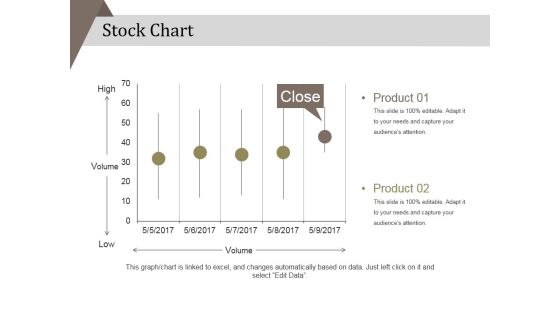
Stock Chart Ppt PowerPoint Presentation Portfolio Background Designs
This is a stock chart ppt powerpoint presentation portfolio background designs. This is a five stage process. The stages in this process are product, high, low .

Radar Chart Ppt PowerPoint Presentation Infographic Template Graphics Template
This is a radar chart ppt powerpoint presentation infographic template graphics template. This is a six stage process. The stages in this process are product, business, marketing, shapes.

Area Chart Ppt PowerPoint Presentation Gallery Clipart Images
This is a area chart ppt powerpoint presentation gallery clipart images. This is a two stage process. The stages in this process are product, profit, business, finance, marketing.

Line Chart Ppt PowerPoint Presentation Visual Aids Inspiration
This is a line chart ppt powerpoint presentation visual aids inspiration. This is a two stage process. The stages in this process are product, profit, growth, decline, success.

Column Chart Ppt PowerPoint Presentation Inspiration Design Ideas
This is a column chart ppt powerpoint presentation inspiration design ideas. This is a nine stage process. The stages in this process are product, growth, success, graph, business.
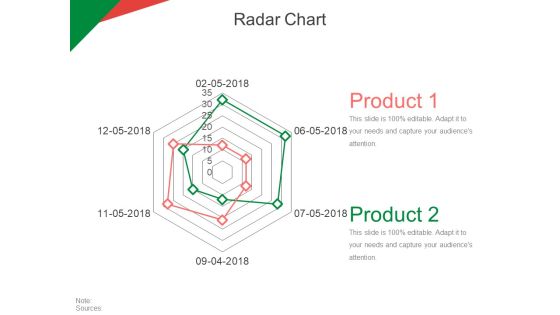
Radar Chart Ppt PowerPoint Presentation Infographic Template Slides
This is a radar chart ppt powerpoint presentation infographic template slides. This is a two stage process. The stages in this process are product, business, marketing, management, planning.

Radar Chart Ppt PowerPoint Presentation Portfolio Design Inspiration
This is a radar chart ppt powerpoint presentation portfolio design inspiration. This is a two stage process. The stages in this process are product, percentage, business, marketing, finance.

Radar Chart Ppt PowerPoint Presentation Summary Background Designs
This is a radar chart ppt powerpoint presentation summary background designs. This is a two stage process. The stages in this process are product, finance, business, marketing.

Stock Chart Ppt PowerPoint Presentation Pictures Graphics Tutorials
This is a stock chart ppt powerpoint presentation pictures graphics tutorials. This is a five stage process. The stages in this process are high, volume, low, product, business.
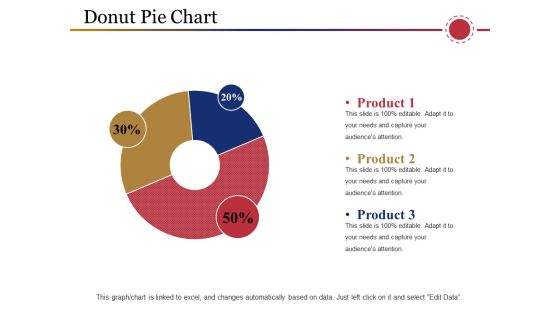
Donut Pie Chart Ppt PowerPoint Presentation Show Ideas
This is a donut pie chart ppt powerpoint presentation show ideas. This is a three stage process. The stages in this process are product, business, process, percentage, management.

Area Chart Ppt PowerPoint Presentation Model Example Topics
This is a area chart ppt powerpoint presentation model example topics. This is a two stage process. The stages in this process are product, percentage, business, marketing, finance.
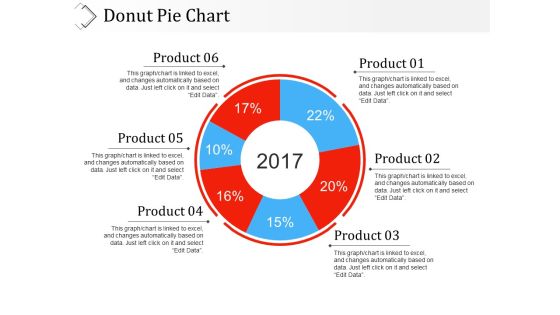
Donut Pie Chart Ppt PowerPoint Presentation Professional Slideshow
This is a donut pie chart ppt powerpoint presentation professional slideshow. This is a six stage process. The stages in this process are product, percentage, years, business, process.
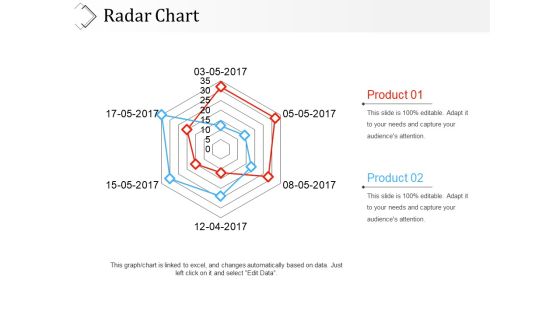
Radar Chart Ppt PowerPoint Presentation File Graphic Tips
This is a radar chart ppt powerpoint presentation file graphic tips. This is a two stage process. The stages in this process are product, finance, marketing, business.
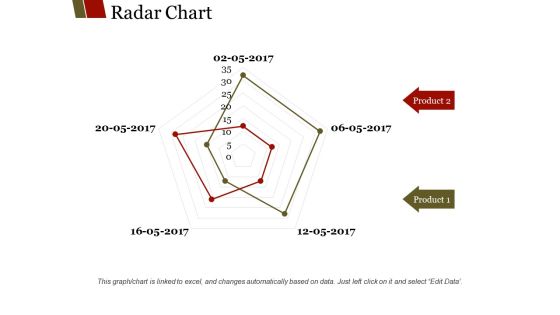
Radar Chart Ppt PowerPoint Presentation Summary Slide Portrait
This is a radar chart ppt powerpoint presentation summary slide portrait. This is a two stage process. The stages in this process are product, business, marketing, finance.
Radar Chart Ppt PowerPoint Presentation Pictures Design Templates
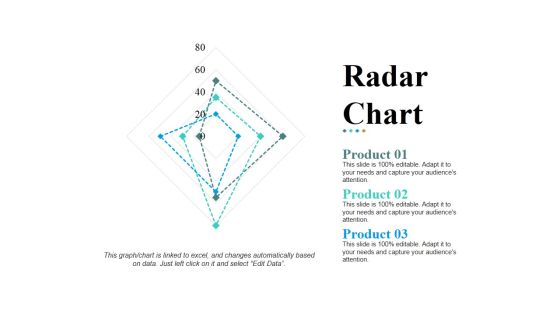
This is a radar chart ppt powerpoint presentation pictures design templates. This is a three stage process. The stages in this process are product, shapes, business, marketing, management.
Donut Pie Chart Ppt PowerPoint Presentation Pictures Background
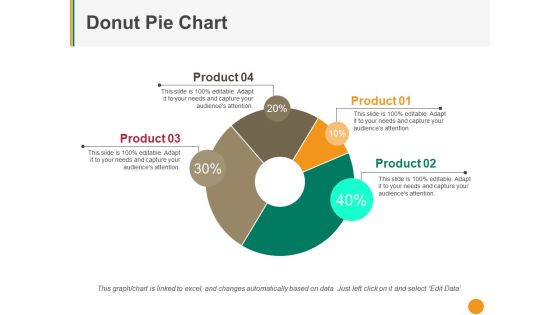
This is a donut pie chart ppt powerpoint presentation pictures background. This is a four stage process. The stages in this process are product, percentage, business, management, process.

Donut Pie Chart Ppt PowerPoint Presentation Slides Outfit
This is a donut pie chart ppt powerpoint presentation slides outfit. This is a three stage process. The stages in this process are product, percentage, business, process, management.
Donut Pie Chart Ppt PowerPoint Presentation Layouts Outfit
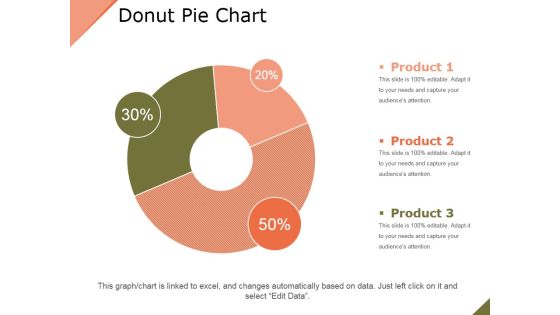
This is a donut pie chart ppt powerpoint presentation layouts outfit. This is a three stage process. The stages in this process are product, business, percentage, finance, marketing.
Scatter Chart Ppt PowerPoint Presentation Infographic Template Objects
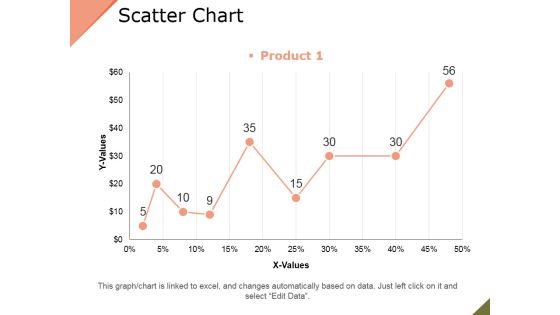
This is a scatter chart ppt powerpoint presentation infographic template objects. This is a nine stage process. The stages in this process are product, growth, success, graph.

Donut Pie Chart Ppt PowerPoint Presentation Model Pictures
This is a donut pie chart ppt powerpoint presentation model pictures. This is a six stage process. The stages in this process are product, percentage, finance, year, business.
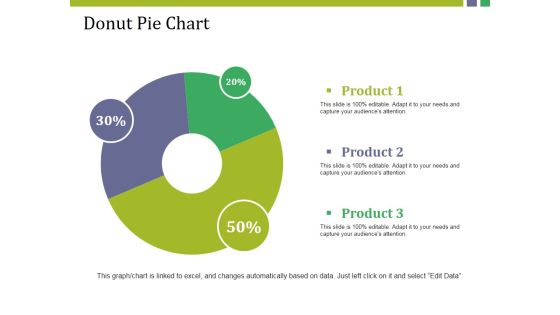
Donut Pie Chart Ppt PowerPoint Presentation Model Show
This is a donut pie chart ppt powerpoint presentation model show. This is a three stage process. The stages in this process are product, donut, percentage, finance, business.
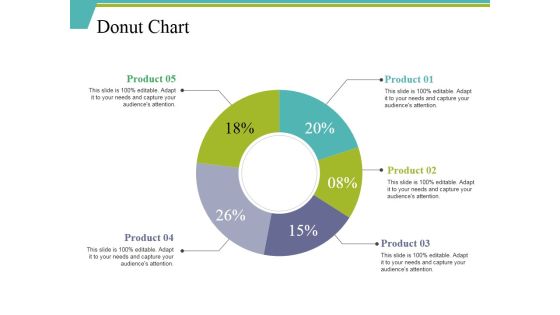
Donut Chart Ppt PowerPoint Presentation Ideas Background Designs
This is a donut chart ppt powerpoint presentation ideas background designs. This is a five stage process. The stages in this process are percentage, finance, donut, business, product.

Line Chart Ppt PowerPoint Presentation Pictures Example Introduction
This is a line chart ppt powerpoint presentation pictures example introduction. This is a two stage process. The stages in this process are product, profit, business, growth, success.
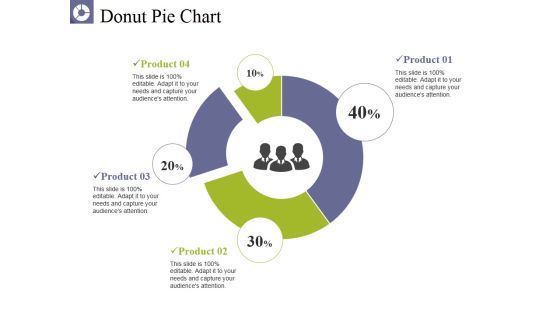
Donut Pie Chart Ppt PowerPoint Presentation Pictures Graphics
This is a donut pie chart ppt powerpoint presentation pictures graphics. This is a four stage process. The stages in this process are product, business, percentage, donut, finance.

Stock Chart Ppt PowerPoint Presentation Slides Graphics Pictures
This is a stock chart ppt powerpoint presentation slides graphics pictures. This is a two stage process. The stages in this process are product, high, volume, low, open.

Donut Pie Chart Ppt PowerPoint Presentation Outline Mockup
This is a donut pie chart ppt powerpoint presentation outline mockup. This is a four stage process. The stages in this process are product, donut, percentage, finance, business.
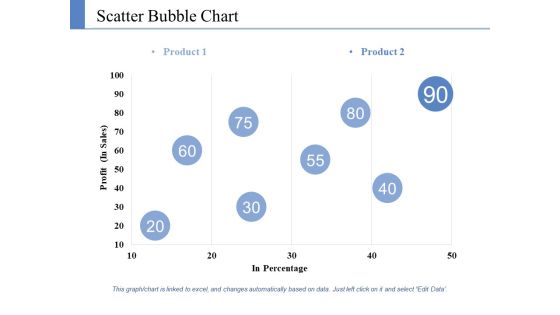
Scatter Bubble Chart Ppt PowerPoint Presentation Styles Information
This is a scatter bubble chart ppt powerpoint presentation styles information. This is a two stage process. The stages in this process are product, profit, in percentage.

Line Chart Ppt PowerPoint Presentation Inspiration Slide Download
This is a line chart ppt powerpoint presentation inspiration slide download. This is a two stage process. The stages in this process are product, in millions, business, marketing.
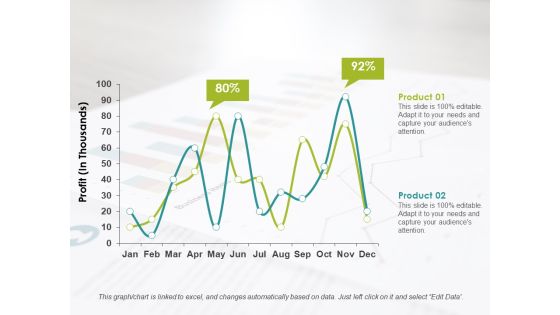
Line Chart Ppt PowerPoint Presentation Infographics Format Ideas
This is a line chart ppt powerpoint presentation infographics format ideas. This is a two stage process. The stages in this process are product, profit, business.

Column Chart Ppt PowerPoint Presentation Infographics Graphics Template
This is a column chart ppt powerpoint presentation infographics graphics template. This is a two stage process. The stages in this process are percentage, product, business, management, marketing.

Scatter Bubble Chart Ppt PowerPoint Presentation Inspiration Demonstration
This is a scatter bubble chart ppt powerpoint presentation inspiration demonstration. This is a two stage process. The stages in this process are percentage, product, business, management, marketing.

Clustered Column Chart Ppt PowerPoint Presentation Ideas Picture
This is a clustered column chart ppt powerpoint presentation ideas picture. This is a three stage process. The stages in this process are percentage, product, management, marketing.
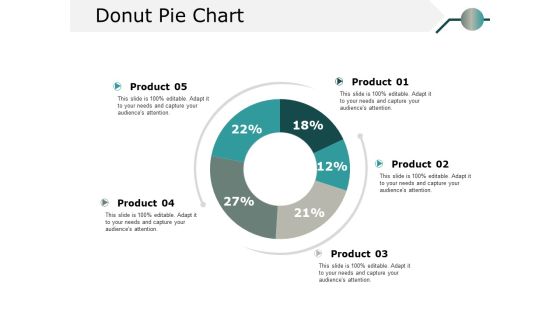
Donut Pie Chart Ppt PowerPoint Presentation Model Information
This is a donut pie chart ppt powerpoint presentation model information. This is a five stage process. The stages in this process are percentage, product, business.

Donut Pie Chart Ppt PowerPoint Presentation Model Outline
This is a donut pie chart ppt powerpoint presentation model outline. This is a four stage process. The stages in this process are percentage, product, business.

Stacked Column Chart Ppt PowerPoint Presentation Slides Files
This is a stacked column chart ppt powerpoint presentation slides files. This is a three stage process. The stages in this process are percentage, product, business, marketing.
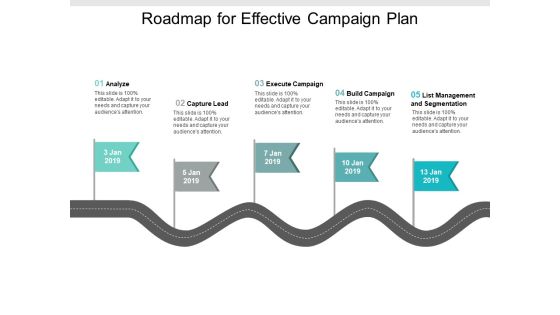
Roadmap For Effective Campaign Plan Ppt PowerPoint Presentation File Diagrams
Presenting this set of slides with name roadmap for effective campaign plan ppt powerpoint presentation file diagrams. This is a five stage process. The stages in this process are automation roadmap, testing strategy, timeline infographic. This is a completely editable PowerPoint presentation and is available for immediate download. Download now and impress your audience.
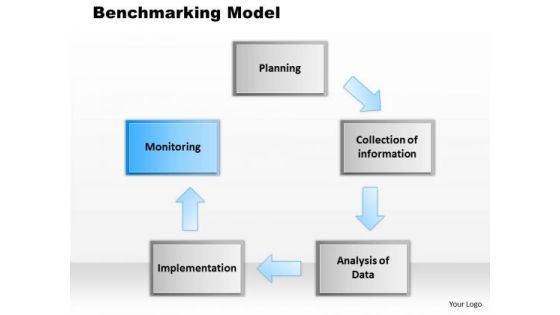
Business Framework Benchmarking Model PowerPoint Presentation
This power point diagram slide has been crafted with graphic of benchmark model. This model is a improvement model and used for risk management. This model is usable for systematic comparison of organizational processes and performance to get new standards to improve processes. Explain industrial or functional benchmarking with this B-model. Use this diagram slide for business and finance related presentations.

CIO For IT Cost Optimization Techniques Key Levers Associated To IT Cost Optimization Framework Guidelines PDF
This slide provides information regarding key levers associated to IT cost optimization framework to determine better cost optimization technique by assessing it on levers such as critical financial benefit, extent of organizational and technical risk, time and investment required and business impact. This is a CIO For IT Cost Optimization Techniques Key Levers Associated To IT Cost Optimization Framework Guidelines PDF template with various stages. Focus and dispense information on two stages using this creative set, that comes with editable features. It contains large content boxes to add your information on topics like Critical Financial Benefit, Organizational Risk, Technical Risk. You can also showcase facts, figures, and other relevant content using this PPT layout. Grab it now.
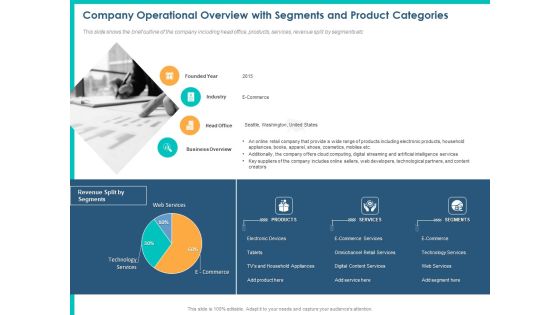
PPM Private Equity Company Operational Overview With Segments And Product Categories Ppt PowerPoint Presentation Pictures Brochure PDF
This slide shows the brief outline of the company including head office, products, services, revenue split by segments etc. Deliver and pitch your topic in the best possible manner with this ppm private equity company operational overview with segments and product categories ppt powerpoint presentation pictures brochure pdf. Use them to share invaluable insights on products, services, segments, e commerce services, omnichannel retail services, digital content services, technology service and impress your audience. This template can be altered and modified as per your expectations. So, grab it now.

Pitch Deck For Fundraising From Angel Investors Estimated Market Size For The Product Annual Income Introduction PDF
This slide shows the Total Addressable Market total market demand for the product, Served Available Market actual audience that can be reached and the Target Market basis on which the growth and marketing strategies are formulated. Deliver an awe inspiring pitch with this creative pitch deck for fundraising from angel investors estimated market size for the product annual income introduction pdf bundle. Topics like available market, cosmetic products, serviceable available market, target market, annual income can be discussed with this completely editable template. It is available for immediate download depending on the needs and requirements of the user.
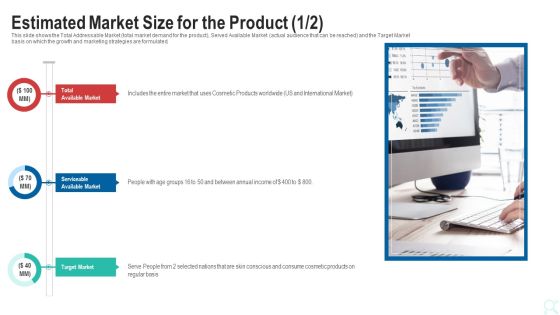
Pitch Deck To Raise New Venture Financing From Seed Investors Estimated Market Size For The Product Total Topics PDF
This slide shows the Total Addressable Market total market demand for the product, Served Available Market actual audience that can be reached and the Target Market basis on which the growth and marketing strategies are formulated. Deliver an awe inspiring pitch with this creative pitch deck to raise new venture financing from seed investors estimated market size for the product total topics pdf bundle. Topics like estimated market size for the product can be discussed with this completely editable template. It is available for immediate download depending on the needs and requirements of the user.
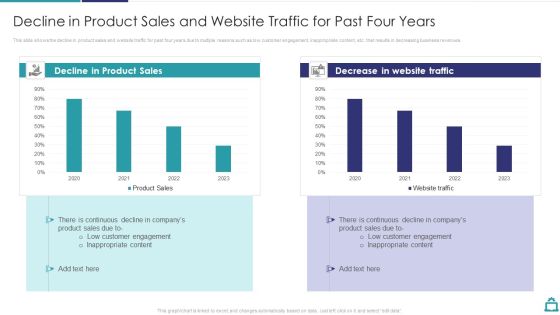
Deploying B2C Social Media Decline In Product Sales And Website Traffic For Past Four Years Slides PDF
This slide shows the decline in product sales and website traffic for past four years due to multiple reasons such as low customer engagement, inappropriate content, etc. that results in decreasing business revenues.Deliver an awe inspiring pitch with this creative Deploying B2C Social Media Decline In Product Sales And Website Traffic For Past Four Years Slides PDF bundle. Topics like Product Sales, Decrease In Website, Customer Engagement can be discussed with this completely editable template. It is available for immediate download depending on the needs and requirements of the user.
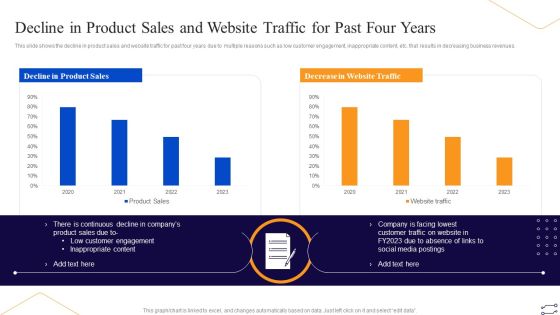
Online Marketing Tactics To Enhance Sales Decline In Product Sales And Website Traffic For Past Background PDF
This slide shows the decline in product sales and website traffic for past four years due to multiple reasons such as low customer engagement, inappropriate content, etc. that results in decreasing business revenues. Deliver an awe inspiring pitch with this creative Online Marketing Tactics To Enhance Sales Decline In Product Sales And Website Traffic For Past Background PDF bundle. Topics like Decline Product Sales, Decrease Website Traffic, 2020 To 2023 can be discussed with this completely editable template. It is available for immediate download depending on the needs and requirements of the user.
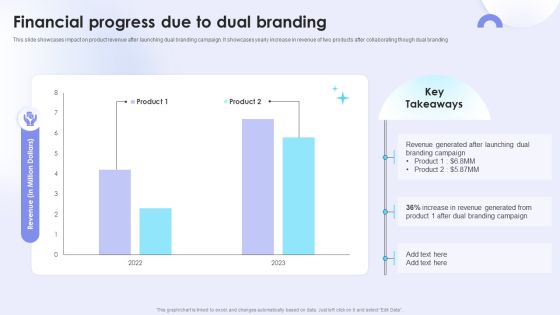
Dual Branding Campaign To Boost Sales Of Product Or Services Financial Progress Due To Dual Branding Pictures PDF
This slide showcases impact on product revenue after launching dual branding campaign. It showcases yearly increase in revenue of two products after collaborating though dual branding Take your projects to the next level with our ultimate collection of DDual Branding Campaign To Boost Sales Of Product Or Services Financial Progress Due To Dual Branding Pictures PDF. Slidegeeks has designed a range of layouts that are perfect for representing task or activity duration, keeping track of all your deadlines at a glance. Tailor these designs to your exact needs and give them a truly corporate look with your own brand colors they will make your projects stand out from the rest.
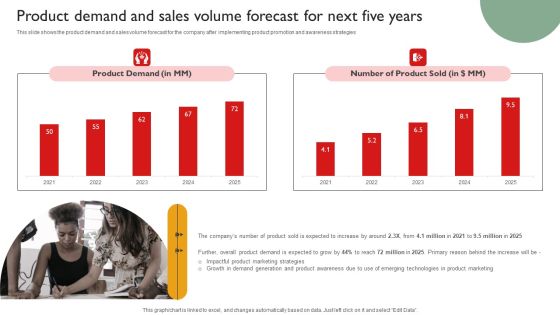
Techniques To Enhance Brand Awareness Product Demand And Sales Volume Forecast For Next Five Years Ideas PDF
This slide shows the product demand and sales volume forecast for the company after implementing product promotion and awareness strategies Find a pre designed and impeccable Techniques To Enhance Brand Awareness Product Demand And Sales Volume Forecast For Next Five Years Ideas PDF. The templates can ace your presentation without additional effort. You can download these easy to edit presentation templates to make your presentation stand out from others. So, what are you waiting for Download the template from Slidegeeks today and give a unique touch to your presentation.

Buyers Conversion Rate Of The Company Diagrams PDF
This slide shows a graph of the percentage of actual buyers that make purchase form the site once they visit the site. The rate has considerably gone down since 2020 due to reasons such as poor user interface, limited product categories, long waiting time, complex billing options etc. Deliver an awe-inspiring pitch with this creative buyers conversion rate of the company diagrams pdf. bundle. Topics like buyers conversion rate, 2016 to 2021 can be discussed with this completely editable template. It is available for immediate download depending on the needs and requirements of the user.
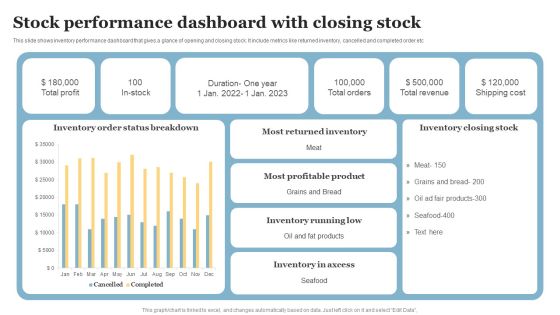
Stock Performance Dashboard With Closing Stock Diagrams PDF
This slide shows inventory performance dashboard that gives a glance of opening and closing stock. It include metrics like returned inventory, cancelled and completed order etc. Pitch your topic with ease and precision using this Stock Performance Dashboard With Closing Stock Diagrams PDF. This layout presents information on Most Returned Inventory, Most Profitable Product, Inventory Running Low. It is also available for immediate download and adjustment. So, changes can be made in the color, design, graphics or any other component to create a unique layout.

Strategies Used By Marketers For Personalizing Email Campaigns Diagrams PDF
This slide showcases various strategies that are implemented by marketers for email campaigns personalization. It includes tailored messaging, triggered emails, product recommendations in email etc. Slidegeeks is one of the best resources for PowerPoint templates. You can download easily and regulate Strategies Used By Marketers For Personalizing Email Campaigns Diagrams PDF for your personal presentations from our wonderful collection. A few clicks is all it takes to discover and get the most relevant and appropriate templates. Use our Templates to add a unique zing and appeal to your presentation and meetings. All the slides are easy to edit and you can use them even for advertisement purposes.
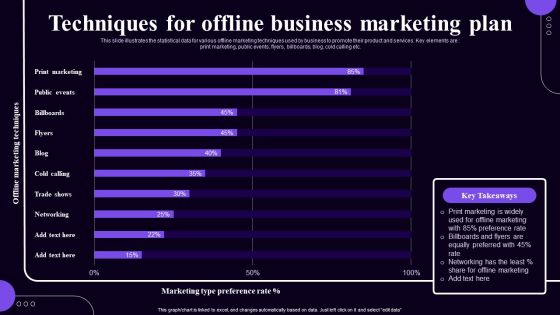
Techniques For Offline Business Marketing Plan Diagrams PDF
This slide illustrates the statistical data for various offline marketing techniques used by business to promote their product and services. Key elements are print marketing, public events, flyers, billboards, blog, cold calling etc. Showcasing this set of slides titled Techniques For Offline Business Marketing Plan Diagrams PDF. The topics addressed in these templates are Print Marketing, Public Events, Billboards. All the content presented in this PPT design is completely editable. Download it and make adjustments in color, background, font etc. as per your unique business setting.

Average Talent Attrition Cost By Profession Diagrams PDF
This slide illustrates a survey report of professionals facing high turnover cost along with the average rate of all roles. It includes professions such as human resources, research, product management, marketing and consulting. Pitch your topic with ease and precision using this Average Talent Attrition Cost By Profession Diagrams PDF. This layout presents information on Human Resource Manager, Key Highlights, Bad Management. It is also available for immediate download and adjustment. So, changes can be made in the color, design, graphics or any other component to create a unique layout.
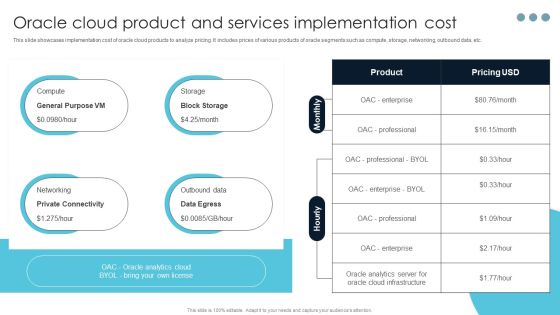
Oracle Cloud Product And Services Implementation Cost Designs PDF
This slide showcases implementation cost of oracle cloud products to analyze pricing. It includes prices of various products of oracle segments such as compute, storage, networking, outbound data, etc. If you are looking for a format to display your unique thoughts, then the professionally designed Oracle Cloud Product And Services Implementation Cost Designs PDF is the one for you. You can use it as a Google Slides template or a PowerPoint template. Incorporate impressive visuals, symbols, images, and other charts. Modify or reorganize the text boxes as you desire. Experiment with shade schemes and font pairings. Alter, share or cooperate with other people on your work. Download Oracle Cloud Product And Services Implementation Cost Designs PDF and find out how to give a successful presentation. Present a perfect display to your team and make your presentation unforgettable.

Consulting Project Team Engagement Roadmap Diagrams PDF
This slide represents the timeline showing the engagement of clients in consulting firms project. It includes details related to activities related to sales process, kick-off, engagement, closeout and engagement management.Showcasing this set of slides titled Consulting Project Team Engagement Roadmap Diagrams PDF. The topics addressed in these templates are Engagement Complete, Documented Reports, Preliminary Recommendations. All the content presented in this PPT design is completely editable. Download it and make adjustments in color, background, font etc. as per your unique business setting.

Addressing Project Coordination Meetings Schedule Diagrams PDF
This slide provides information about the meetings that will be conducted by firm to ensure the relevant information flow and synchronization with partners. Find a pre-designed and impeccable Addressing Project Coordination Meetings Schedule Diagrams PDF. The templates can ace your presentation without additional effort. You can download these easy-to-edit presentation templates to make your presentation stand out from others. So, what are you waiting for Download the template from Slidegeeks today and give a unique touch to your presentation.

10 Steps Of Visual Merchandising Product Planning Process Pictures PDF
Mentioned slide outlines basic components of merchandising planning. Product, range, price, assortment and space are the major components which will assist store manager to increase the product sales. Presenting 10 Steps Of Visual Merchandising Product Planning Process Pictures PDF to dispense important information. This template comprises five stages. It also presents valuable insights into the topics including Product, Range, Price. This is a completely customizable PowerPoint theme that can be put to use immediately. So, download it and address the topic impactfully.
