AI PPT Maker
Templates
PPT Bundles
Design Services
Business PPTs
Business Plan
Management
Strategy
Introduction PPT
Roadmap
Self Introduction
Timelines
Process
Marketing
Agenda
Technology
Medical
Startup Business Plan
Cyber Security
Dashboards
SWOT
Proposals
Education
Pitch Deck
Digital Marketing
KPIs
Project Management
Product Management
Artificial Intelligence
Target Market
Communication
Supply Chain
Google Slides
Research Services
 One Pagers
All Categories
-
Home
- Customer Favorites
- Manufacturing Icon
Manufacturing Icon

Bubble Chart Ppt PowerPoint Presentation Slides Download
This is a bubble chart ppt powerpoint presentation slides download. This is a four stage process. The stages in this process are business, marketing, bubble chart, finance, product.
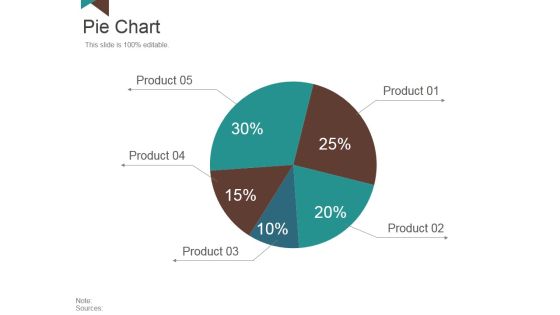
Pie Chart Ppt PowerPoint Presentation Styles Slideshow
This is a pie chart ppt powerpoint presentation styles slideshow. This is a five stage process. The stages in this process are pie chart, process, product, marketing, business.

Radar Chart Ppt PowerPoint Presentation Styles Objects
This is a radar chart ppt powerpoint presentation styles objects. This is a two stage process. The stages in this process are product radar chart, business, marketing, process.

Area Chart Ppt PowerPoint Presentation Styles Designs
This is a area chart ppt powerpoint presentation styles designs. This is a two stage process. The stages in this process are area chart, product.

Radar Chart Ppt PowerPoint Presentation Gallery Picture
This is a radar chart ppt powerpoint presentation gallery picture. This is a two stage process. The stages in this process are product, radar chart, process, business, marketing.

Radar Chart Ppt PowerPoint Presentation Styles Infographics
This is a radar chart ppt powerpoint presentation styles infographics. This is a six stage process. The stages in this process are business, marketing, product, radar chart, strategy.

Area Chart Ppt PowerPoint Presentation Inspiration Slides
This is a area chart ppt powerpoint presentation inspiration slides. This is a two stage process. The stages in this process are area chart, product, in percentage.

Combo Chart Ppt PowerPoint Presentation Professional Infographics
This is a combo chart ppt powerpoint presentation professional infographics. This is a three stage process. The stages in this process are combo chart, market size, product.

Radar Chart Ppt PowerPoint Presentation Ideas Visuals
This is a radar chart ppt powerpoint presentation ideas visuals. This is a two stage process. The stages in this process are radar chart, product.

Radar Chart Ppt PowerPoint Presentation Templates
This is a radar chart ppt powerpoint presentation templates. This is a two stage process. The stages in this process are radar chart, product, business, process, success.
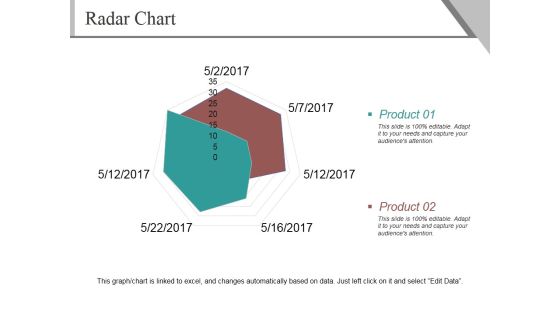
Radar Chart Ppt PowerPoint Presentation Summary Slide
This is a radar chart ppt powerpoint presentation summary slide. This is a two stage process. The stages in this process are product, radar chart, shapes, business, marketing.
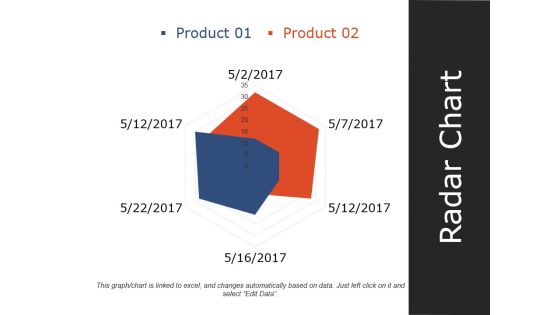
Radar Chart Ppt PowerPoint Presentation Infographics Slideshow
This is a radar chart ppt powerpoint presentation infographics slideshow. This is a two stage process. The stages in this process are product, radar chart, shape, management, marketing.

Area Chart Ppt PowerPoint Presentation Layouts Structure
This is a area chart ppt powerpoint presentation layouts structure. This is a two stage process. The stages in this process are area chart, product, business, growth, success.

Rader Chart Ppt PowerPoint Presentation Inspiration Show
This is a rader chart ppt powerpoint presentation inspiration show. This is a two stage process. The stages in this process are product, rader chart, shapes, business, marketing.

Bubble Chart Ppt PowerPoint Presentation File Professional
This is a bubble chart ppt powerpoint presentation file professional. This is a three stage process. The stages in this process are product, bubble chart, growth, business, success.

Column Chart Ppt PowerPoint Presentation Portfolio Aids
This is a column chart ppt powerpoint presentation portfolio aids. This is a two stage process. The stages in this process are product, column chart, business, marketing, step.
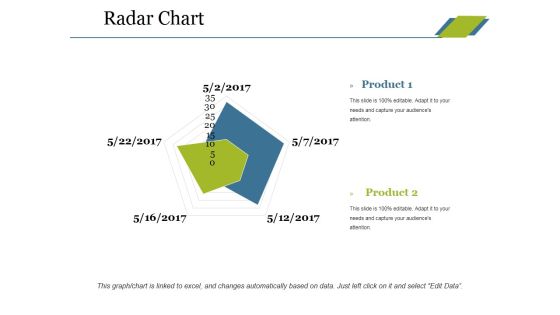
Radar Chart Ppt PowerPoint Presentation Slides Introduction
This is a radar chart ppt powerpoint presentation slides introduction. This is a two stage process. The stages in this process are product, radar chart, shape, business, marketing.
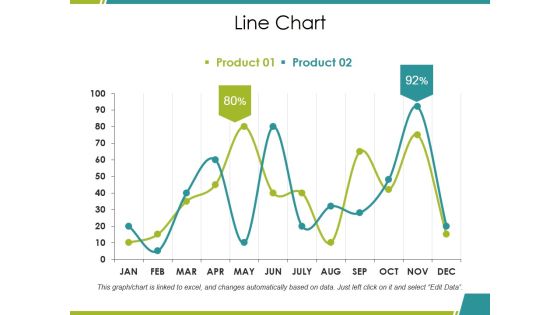
Line Chart Ppt PowerPoint Presentation Model Pictures
This is a line chart ppt powerpoint presentation model pictures. This is a two stage process. The stages in this process are product, percentage, growth, line chart, business.

Radar Chart Ppt PowerPoint Presentation Infographics Ideas
This is a radar chart ppt powerpoint presentation infographics ideas. This is a three stage process. The stages in this process are product, business, shapes, marketing, radar chart.

Radar Chart Ppt PowerPoint Presentation File Aids
This is a radar chart ppt powerpoint presentation file aids. This is a two stage process. The stages in this process are product, business, shapes, radar chart.

Area Chart Ppt PowerPoint Presentation Gallery Information
This is a area chart ppt powerpoint presentation gallery information. This is a two stage process. The stages in this process are product, area chart, business, finance, marketing.
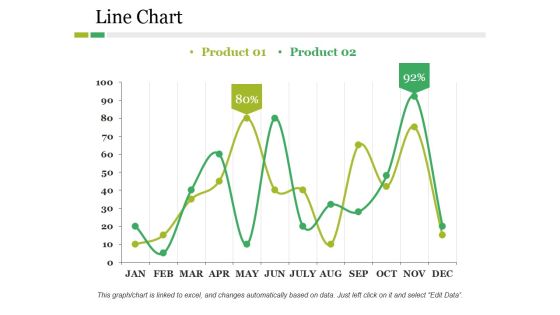
Line Chart Ppt PowerPoint Presentation Pictures Structure
This is a line chart ppt powerpoint presentation pictures structure. This is a two stage process. The stages in this process are product, business, line chart, finance, percentage.

Radar Chart Ppt PowerPoint Presentation Background Designs
This is a radar chart ppt powerpoint presentation background designs. This is a two stage process. The stages in this process are radar chart, product, finance, business, shapes.

Area Chart Ppt PowerPoint Presentation File Slides
This is a area chart ppt powerpoint presentation file slides. This is a two stage process. The stages in this process are product, area chart, business, marketing, management.

Radar Chart Ppt PowerPoint Presentation Gallery Templates
This is a radar chart ppt powerpoint presentation gallery templates. This is a two stage process. The stages in this process are radar chart, product, shape, business.
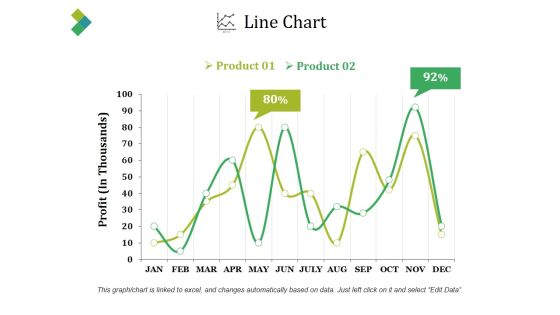
Line Chart Ppt PowerPoint Presentation Slides
This is a line chart ppt powerpoint presentation slides. This is a two stage process. The stages in this process are product, profit, percentage, finance, line chart.

Radar Chart Ppt PowerPoint Presentation Ideas Portrait
This is a radar chart ppt powerpoint presentation ideas portrait. This is a two stage process. The stages in this process are product, radar chart, finance, business, marketing.

Bubble Chart Ppt PowerPoint Presentation Infographics Images
This is a bubble chart ppt powerpoint presentation infographics images. This is a two stage process. The stages in this process are product, bubble chart, business, growth, success.
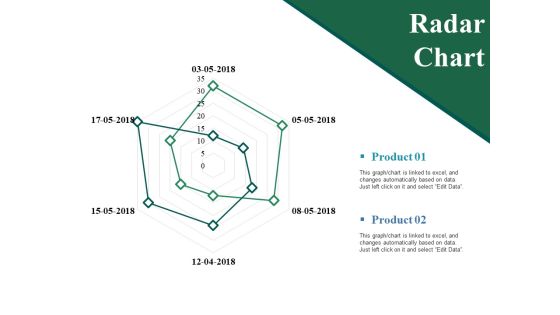
Radar Chart Ppt PowerPoint Presentation Show Guidelines
This is a radar chart ppt powerpoint presentation show guidelines. This is a two stage process. The stages in this process are product, radar chart, business, finance, marketing.

Stock Chart Ppt PowerPoint Presentation Ideas Infographics
This is a stock chart ppt powerpoint presentation ideas infographics. This is a two stage process. The stages in this process are high, volume, low, product, stock chart.
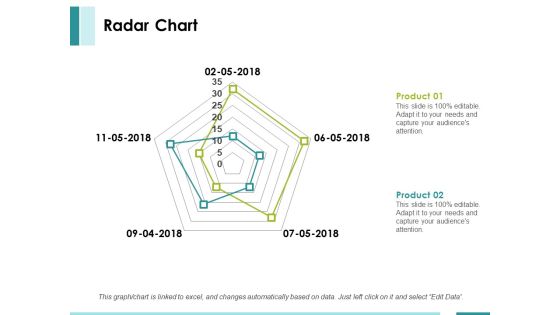
Radar Chart Ppt PowerPoint Presentation Summary Layout
This is a radar chart ppt powerpoint presentation summary layout. This is a two stage process. The stages in this process are product, finance, shape, radar chart, business.

Radar Chart Ppt PowerPoint Presentation File Rules
This is a radar chart ppt powerpoint presentation file rules. This is a two stage process. The stages in this process are product, radar chart, finance.

Column Chart Ppt PowerPoint Presentation Infographics Styles
This is a column chart ppt powerpoint presentation infographics styles. This is a two stage process. The stages in this process are product, column chart, business.

Area Chart Ppt PowerPoint Presentation Model Guidelines
This is a area chart ppt powerpoint presentation model guidelines. This is a two stage process. The stages in this process are product, area chart, sales in percentage.

Bubble Chart Ppt PowerPoint Presentation Pictures Good
This is a bubble chart ppt powerpoint presentation pictures good. This is a two stage process. The stages in this process are product, bubble chart, growth.

Bubble Chart Ppt PowerPoint Presentation Show Microsoft
This is a bubble chart ppt powerpoint presentation show microsoft. This is a two stage process. The stages in this process are bubble chart, product, business, management, marketing.
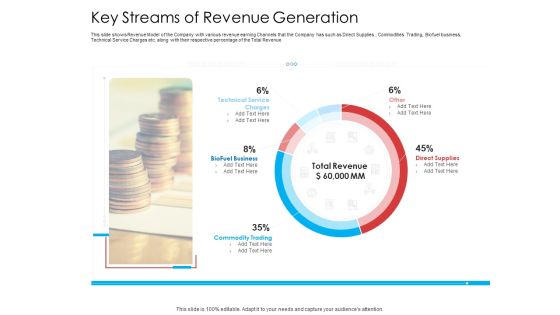
Key Streams Of Revenue Generation Clipart PDF
This slide shows Revenue Model of the Company with various revenue earning Channels that the Company has such as Direct Supplies, Commodities Trading, Biofuel business, Technical Service Charges etc. along with their respective percentage of the Total Revenue. Deliver and pitch your topic in the best possible manner with this key streams of revenue generation clipart pdf. Use them to share invaluable insights on direct supplies, commodity trading, technical service charges and impress your audience. This template can be altered and modified as per your expectations. So, grab it now.
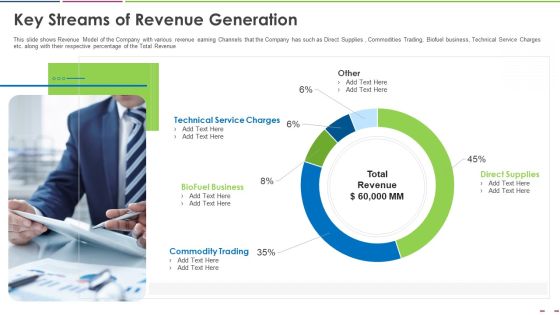
Investor Deck To Increase Grant Funds From Public Corporation Key Streams Of Revenue Generation Guidelines PDF
This slide shows Revenue Model of the Company with various revenue earning Channels that the Company has such as Direct Supplies , Commodities Trading, Biofuel business, Technical Service Charges etc. along with their respective percentage of the Total Revenue. Deliver an awe-inspiring pitch with this creative investor deck to increase grant funds from public corporation key streams of revenue generation guidelines pdf. bundle. Topics like technical service charges, biofuel business, commodity trading, direct supplies can be discussed with this completely editable template. It is available for immediate download depending on the needs and requirements of the user.

Funding Deck To Obtain Grant Facilities From Public Companies Key Streams Of Revenue Generation Graphics PDF
This slide shows Revenue Model of the Company with various revenue earning Channels that the Company has such as Direct Supplies , Commodities Trading, Biofuel business, Technical Service Charges etc. along with their respective percentage of the Total Revenue. Deliver an awe inspiring pitch with this creative funding deck to obtain grant facilities from public companies key streams of revenue generation graphics pdf bundle. Topics like technical service charges, bio fuel business, commodity trading, direct supplies can be discussed with this completely editable template. It is available for immediate download depending on the needs and requirements of the user.

Funding Deck To Procure Funds From Public Enterprises Key Streams Of Revenue Generation Elements PDF
This slide shows Revenue Model of the Company with various revenue earning Channels that the Company has such as Direct Supplies , Commodities Trading, Biofuel business, Technical Service Charges etc. along with their respective percentage of the Total Revenue. Deliver and pitch your topic in the best possible manner with this funding deck to procure funds from public enterprises key streams of revenue generation elements pdf. Use them to share invaluable insights on technical service charges, biofuel business, commodity trading, direct supplies, total revenue and impress your audience. This template can be altered and modified as per your expectations. So, grab it now.
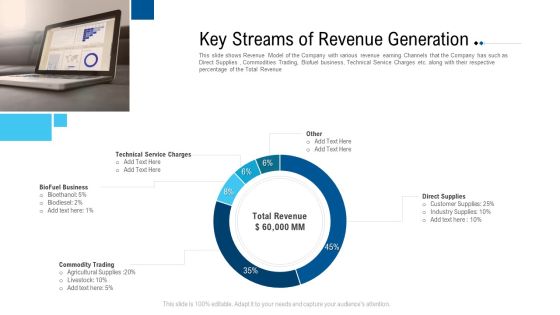
Funding Deck To Raise Grant Funds From Public Organizations Key Streams Of Revenue Generation Ideas PDF
This slide shows Revenue Model of the Company with various revenue earning Channels that the Company has such as Direct Supplies , Commodities Trading, Biofuel business, Technical Service Charges etc. along with their respective percentage of the Total Revenue. Deliver an awe inspiring pitch with this creative funding deck to raise grant funds from public organizations key streams of revenue generation ideas pdf bundle. Topics like technical service charges, revenue, key streams of revenue generation can be discussed with this completely editable template. It is available for immediate download depending on the needs and requirements of the user.

Cost Saving With Agile Methodology IT Determining Current Project Cost Pictures PDF
Following slide portrays informational stats about project cost bear by the organization while using traditional methodology. It also shows the stats about technical debt and value stream.Deliver and pitch your topic in the best possible manner with this cost saving with agile methodology it determining current project cost pictures pdf Use them to share invaluable insights on incurring technical, graph shows that cost, change is higher towards and impress your audience. This template can be altered and modified as per your expectations. So, grab it now.

Why Is Agile Cost Effective IT Projected Cost Of Project After Adopting Agile Inspiration PDF
Following slide illustrates forecasted statistics about project cost to be bear by the organization after adopting agile methodology. It also shows that technical debt will get decreased post agile adoption. Deliver an awe inspiring pitch with this creative Why Is Agile Cost Effective IT Projected Cost Of Project After Adopting Agile Inspiration PDF bundle. Topics like Project Cost, Technical Dept, Value Stream can be discussed with this completely editable template. It is available for immediate download depending on the needs and requirements of the user.

Implementing Agile Software Development Methodology For Cost Cutting IT Projected Cost Of Project Brochure PDF
Following slide illustrates forecasted statistics about project cost to be bear by the organization after adopting agile methodology. It also shows that technical debt will get decreased post agile adoption.Deliver and pitch your topic in the best possible manner with this Implementing Agile Software Development Methodology For Cost Cutting IT Projected Cost Of Project Brochure PDF Use them to share invaluable insights on Project Cost, Technical Dept, Value Stream and impress your audience. This template can be altered and modified as per your expectations. So, grab it now.

Dashboard Depicting Resource Planning Management With Departments Designs PDF
This slide focuses on the dashboard that depicts the resourcing plan which includes capacity, scheduled, unscheduled, time off and overtime hours with name of the resource, department such as creative, design, technical, etc. with capacity, scheduled and billable percentage, etc. Showcasing this set of slides titled Dashboard Depicting Resource Planning Management With Departments Designs PDF. The topics addressed in these templates are Resource, Design, Technical. All the content presented in this PPT design is completely editable. Download it and make adjustments in color, background, font etc. as per your unique business setting.

Current Challenges And Opportunities Of Digital Payments Strategy Transactions Clipart PDF
This slide provides some of the major challenges and opportunities of digital transactions for business, customers and governments bodies. It incorporates challenges such as technical and financial, loss of transactional revenue, cyberattacks etc. Showcasing this set of slides titled Current Challenges And Opportunities Of Digital Payments Strategy Transactions Clipart PDF. The topics addressed in these templates are Challenges, Opportunities, Technical And Financial. All the content presented in this PPT design is completely editable. Download it and make adjustments in color, background, font etc. as per your unique business setting.
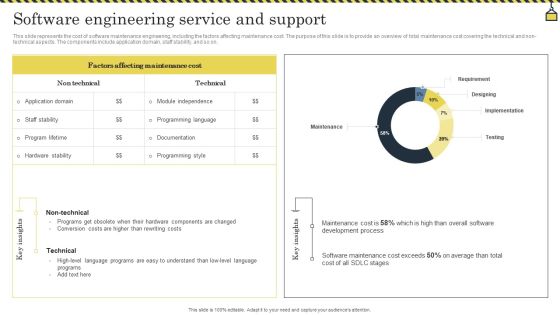
Software Engineering Service And Support Information PDF
This slide represents the cost of software maintenance engineering, including the factors affecting maintenance cost. The purpose of this slide is to provide an overview of total maintenance cost covering the technical and non technical aspects. The components include application domain, staff stability, and so on. Pitch your topic with ease and precision using this Software Engineering Service And Support Information PDF. This layout presents information on Rewriting Costs, Conversion Costs, Development Process. It is also available for immediate download and adjustment. So, changes can be made in the color, design, graphics or any other component to create a unique layout.

Social Media Global Usage Year Over Year Comparison Professional PDF
The purpose of this slide is to showcase the utilization of social media marketing worldwide with an upward trend influenced by technical advancements. The years include 2013 2023 along with the key insights. Showcasing this set of slides titled Social Media Global Usage Year Over Year Comparison Professional PDF. The topics addressed in these templates are Social Media, Technological Advancement, Technical Innovations. All the content presented in this PPT design is completely editable. Download it and make adjustments in color, background, font etc. as per your unique business setting.
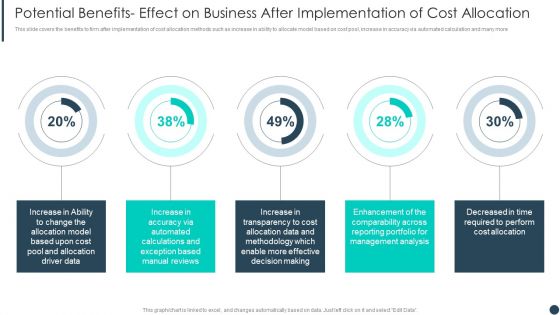
Cost Allotment Technique Potential Benefits Effect On Business After Implementation Of Cost Allocation Clipart PDF
This slide covers the benefits to firm after implementation of cost allocation methods such as increase in ability to allocate model based on cost pool, increase in accuracy via automated calculation and many more.Deliver and pitch your topic in the best possible manner with this Cost Allotment Technique Potential Benefits Effect On Business After Implementation Of Cost Allocation Clipart PDF. Use them to share invaluable insights on Allocation Model, Pool Allocation, Exception Based and impress your audience. This template can be altered and modified as per your expectations. So, grab it now.

Potential Benefits Effect On Business After Implementation Of Cost Allocation Inspiration PDF
This slide covers the benefits to firm after implementation of cost allocation methods such as increase in ability to allocate model based on cost pool, increase in accuracy via automated calculation and many more. Deliver an awe inspiring pitch with this creative Potential Benefits Effect On Business After Implementation Of Cost Allocation Inspiration PDF bundle. Topics like Methodology, Management Analysis, Driver Data can be discussed with this completely editable template. It is available for immediate download depending on the needs and requirements of the user.

Potential Benefits Effect On Business After Implementation Of Cost Allocation Information PDF
This slide covers the benefits to firm after implementation of cost allocation methods such as increase in ability to allocate model based on cost pool, increase in accuracy via automated calculation and many more.Deliver and pitch your topic in the best possible manner with this Potential Benefits Effect On Business After Implementation Of Cost Allocation Information PDF. Use them to share invaluable insights on Manual Reviews, Exception Based, Effective Decision and impress your audience. This template can be altered and modified as per your expectations. So, grab it now.

Agile Software Programming Module For Information Technology Seven Properties Of Crystal Clear Diagrams PDF
This slide covers properties of crystal clear programming such as easy access to users, personal safety, focus, agile technical environment, frequent delivery, reflection improvement, osmotic communication etc. This is a agile software programming module for information technology seven properties of crystal clear diagrams pdf template with various stages. Focus and dispense information on seven stages using this creative set, that comes with editable features. It contains large content boxes to add your information on topics like personal safety, agile technical environment, osmotic communication. You can also showcase facts, figures, and other relevant content using this PPT layout. Grab it now.

Monthly Training Schedule For Employee Skill And Work Improvement Diagrams PDF
The following slide highlights the monthly training plan for employee skill and work improvement illustrating skills training and three months to train employees for new skills development, where skills includes software training, digital training, technical training and operations training. Showcasing this set of slides titled Monthly Training Schedule For Employee Skill And Work Improvement Diagrams PDF. The topics addressed in these templates are Software Training, Digital Training, Technical Training. All the content presented in this PPT design is completely editable. Download it and make adjustments in color, background, font etc. as per your unique business setting.
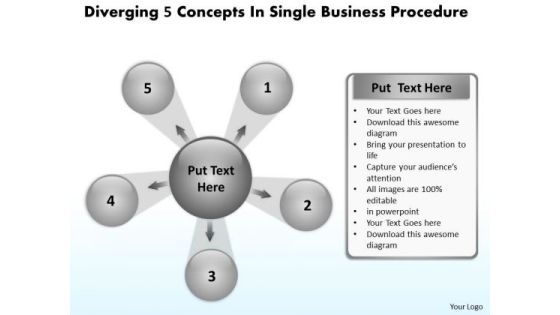
World Business PowerPoint Templates Procedure Cycle Layout Diagram
We present our world business powerpoint templates procedure Cycle Layout Diagram.Download and present our Leadership PowerPoint Templates because you know Coincidentally it will always point to the top. Use our Arrows PowerPoint Templates because this slide can help to bullet point your views. Present our Process and Flows PowerPoint Templates because they are the indicators of the path you have in mind. Download and present our Business PowerPoint Templates because the fruits of your labour are beginning to show.Enlighten them on the great plans you have for their enjoyment. Present our Circle Charts PowerPoint Templates because knowledge is power goes the popular saying.Use these PowerPoint slides for presentations relating to Arrows, Business, Chart, Circle, Company, Concept, Continuity, Continuous, Cycle, Dependency, Diagram, Direction, Dynamic, Endless, Feeds, Graph, Iteration, Iterative, Method, Path, Phase, Presentation, Process, Production, Progress, Progression, Report, Rotation, Sequence, Succession, Vector. The prominent colors used in the PowerPoint template are White, Gray, Black. Customers tell us our world business powerpoint templates procedure Cycle Layout Diagram will get their audience's attention. PowerPoint presentation experts tell us our Cycle PowerPoint templates and PPT Slides are Efficacious. We assure you our world business powerpoint templates procedure Cycle Layout Diagram are Spectacular. Customers tell us our Cycle PowerPoint templates and PPT Slides are Stylish. We assure you our world business powerpoint templates procedure Cycle Layout Diagram are Fantastic. People tell us our Chart PowerPoint templates and PPT Slides provide great value for your money. Be assured of finding the best projection to highlight your words.
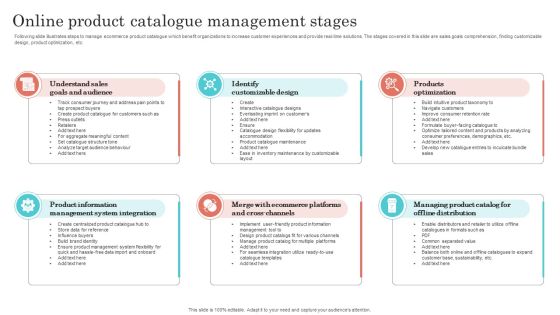
Online Product Catalogue Management Stages Portrait PDF
Following slide illustrates steps to manage ecommerce product catalogue which benefit organizations to increase customer experiences and provide real time solutions. The stages covered in this slide are sales goals comprehension, finding customizable design, product optimization, etc. Presenting Online Product Catalogue Management Stages Portrait PDF to dispense important information. This template comprises six stages. It also presents valuable insights into the topics including Identify Customizable Design, Products Optimization, Management System Integration. This is a completely customizable PowerPoint theme that can be put to use immediately. So, download it and address the topic impactfully.
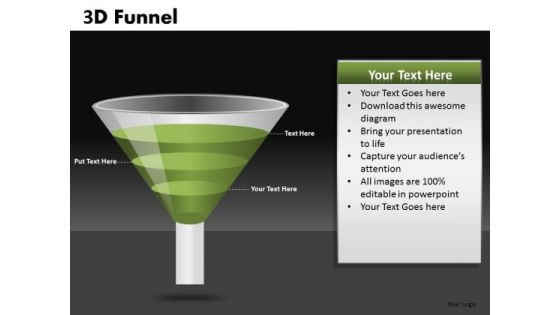
Funnel PowerPoint Diagrams Showing Conversions Ppt Slides
Funnel PowerPoint Diagrams showing Conversions PPT Slides-These high quality powerpoint pre-designed slides and powerpoint templates have been carefully created by our professional team to help you impress your audience. All slides have been created and are 100% editable in powerpoint. Each and every property of any graphic - color, size, orientation, shading, outline etc. can be modified to help you build an effective powerpoint presentation. Any text can be entered at any point in the powerpoint template or slide. Simply DOWNLOAD, TYPE and PRESENT! These PowerPoint presentation slides can be used to represent themes relating to --arrow, business, chart, choice, development, diagram, financial, flow, funnel, liquid, phase, process, product, select, separate, shape, sift, silver, spout, transparent-Funnel PowerPoint Diagrams showing Conversions PPT Slides

Liquid Funnel Diagram For Ppt Presentations
Liquid Funnel Diagram for PPT presentations-These high quality powerpoint pre-designed slides and powerpoint templates have been carefully created by our professional team to help you impress your audience. All slides have been created and are 100% editable in powerpoint. Each and every property of any graphic - color, size, orientation, shading, outline etc. can be modified to help you build an effective powerpoint presentation. Any text can be entered at any point in the powerpoint template or slide. Simply DOWNLOAD, TYPE and PRESENT! These PowerPoint presentation slides can be used to represent themes relating to --arrow, business, chart, choice, development, diagram, financial, flow, funnel, liquid, phase, process, product, select, separate, shape, sift, silver, spout, transparent-Liquid Funnel Diagram for PPT presentations
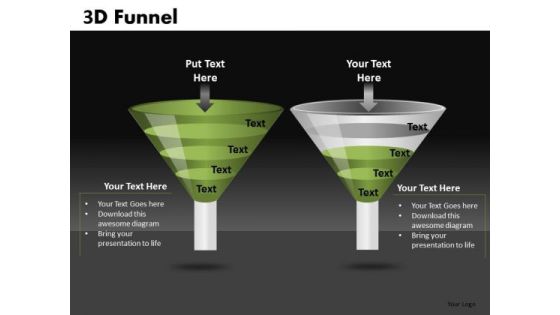
PowerPoint Funnel Diagram Comparison Slides Ppt Templates
PowerPoint Funnel Diagram Comparison Slides PPT templates-These high quality powerpoint pre-designed slides and powerpoint templates have been carefully created by our professional team to help you impress your audience. All slides have been created and are 100% editable in powerpoint. Each and every property of any graphic - color, size, orientation, shading, outline etc. can be modified to help you build an effective powerpoint presentation. Any text can be entered at any point in the powerpoint template or slide. Simply DOWNLOAD, TYPE and PRESENT! These PowerPoint presentation slides can be used to represent themes relating to --arrow, business, chart, choice, development, diagram, financial, flow, funnel, liquid, phase, process, product, select, separate, shape, sift, silver, spout, transparent-PowerPoint Funnel Diagram Comparison Slides PPT templates
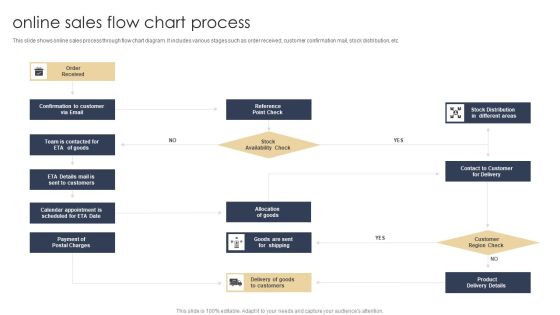
Online Sales Flow Chart Process Infographics PDF
This slide shows online sales process through flow chart diagram. It includes various stages such as order received, customer confirmation mail, stock distribution, etc. Showcasing this set of slides titled Online Sales Flow Chart Process Infographics PDF. The topics addressed in these templates are Customers, Product, Payment. All the content presented in this PPT design is completely editable. Download it and make adjustments in color, background, font etc. as per your unique business setting.
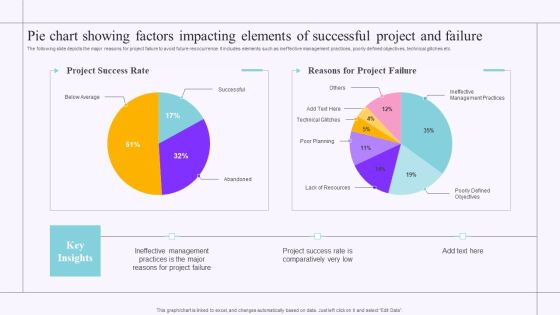
Pie Chart Showing Factors Impacting Elements Of Successful Project And Failure Graphics PDF
The following slide depicts the major reasons for project failure to avoid future reoccurrence. It includes elements such as ineffective management practices, poorly defined objectives, technical glitches etc. Showcasing this set of slides titled Pie Chart Showing Factors Impacting Elements Of Successful Project And Failure Graphics PDF. The topics addressed in these templates are Pie Chart Showing Factors, Impacting Elements, Successful Project And Failure. All the content presented in this PPT design is completely editable. Download it and make adjustments in color, background, font etc. as per your unique business setting.
