AI PPT Maker
Templates
PPT Bundles
Design Services
Business PPTs
Business Plan
Management
Strategy
Introduction PPT
Roadmap
Self Introduction
Timelines
Process
Marketing
Agenda
Technology
Medical
Startup Business Plan
Cyber Security
Dashboards
SWOT
Proposals
Education
Pitch Deck
Digital Marketing
KPIs
Project Management
Product Management
Artificial Intelligence
Target Market
Communication
Supply Chain
Google Slides
Research Services
 One Pagers
All Categories
-
Home
- Customer Favorites
- Management Icons
Management Icons

Software Data Migration Plan Process Structure PDF
Mentioned slide showcases the planning process of moving data from one application to another. It consist of various stages such as design planning, source data collection, data analysis, migration development, testing and implementation. Presenting Software Data Migration Plan Process Structure PDF to dispense important information. This template comprises six stages. It also presents valuable insights into the topics including Design Planning, Collect Source Data, Data Analysis . This is a completely customizable PowerPoint theme that can be put to use immediately. So, download it and address the topic impactfully.

Data Processing In MIS Integration Summary PDF
This slide represents tasks of marketing information system MIS to process data in useful form that helps to take marketing decisions. It includes four major points data collection, evaluation, transformation and transmission. Presenting Data Processing In MIS Integration Summary PDF to dispense important information. This template comprises four stages. It also presents valuable insights into the topics including Data Transformation, Data Transmission, Data Evaluation. This is a completely customizable PowerPoint theme that can be put to use immediately. So, download it and address the topic impactfully.
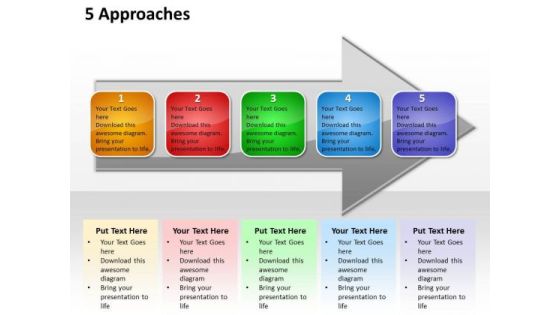
Ppt Sequential Illustration Of 5 Approaches An Arrow PowerPoint Templates
PPT sequential illustration of 5 approaches an arrow PowerPoint Templates-This PowerPoint Diagram shows you the Sequential illustration of five approaches on the Arrow. It shows the successive concepts used in a procedure. This Template will fit for Business Presentations.-PPT sequential illustration of 5 approaches an arrow PowerPoint Templates-Achieve, Achieving, Action, Advertising, Ambition, Approach, Arrow, Background, Better, Business, Career, Challenge, Commercial, Communication, Competition, Competitive, Competitor, Concept, Conceptual, Contract, Customer, Determined, Effective, Efficiency, Efficient, First, Goal, Isolated, Marketing, Movement, Objective, Opportunity, Order, Performance, Positive, Reaching, Red, Result, Succeed, Success, Symbol, Target, Trade, White, Win, Winner

Ppt Successive Abstraction Of 6 Concepts An Arrow PowerPoint Templates
PPT successive abstraction of 6 concepts an arrow PowerPoint Templates-This PowerPoint Diagram shows you the Sequential Abstraction of six concepts on the Arrow. It shows the sequential concepts used in a procedure. This Template will fit for Business Presentations.-PPT successive abstraction of 6 concepts an arrow PowerPoint Templates-Achieve, Achieving, Action, Advertising, Ambition, Approach, Arrow, Background, Better, Business, Career, Challenge, Commercial, Communication, Competition, Competitive, Competitor, Concept, Conceptual, Contract, Customer, Determined, Effective, Efficiency, Efficient, First, Goal, Isolated, Marketing, Movement, Objective, Opportunity, Order, Performance, Positive, Reaching, Red, Result, Succeed, Success, Symbol, Target, Trade, White, Win, Winner
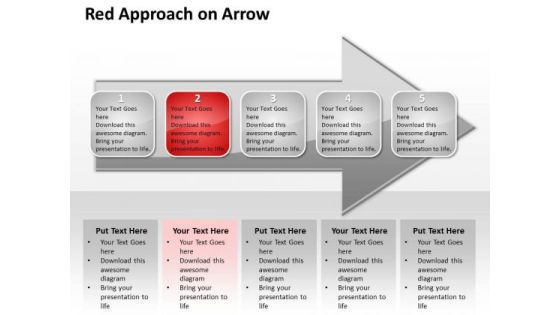
Ppt Linaer Illustration Of Red PowerPoint Background Approach An Arrow Templates
PPT linaer illustration of red powerpoint background approach an arrow Templates-This PowerPoint Diagram shows you the Sequential Abstraction of six concepts on the Arrow. It shows the sequential concepts used in a procedure. This Template will fit for Business Presentations.-PPT linaer illustration of red powerpoint background approach an arrow Templates-Achieve, Achieving, Action, Advertising, Ambition, Approach, Arrow, Background, Better, Business, Career, Challenge, Commercial, Communication, Competition, Competitive, Competitor, Concept, Conceptual, Contract, Customer, Determined, Effective, Efficiency, Efficient, First, Goal, Isolated, Marketing, Movement, Objective, Opportunity, Order, Performance, Positive, Reaching, Red, Result, Succeed, Success, Symbol, Target, Trade, White, Win, Winner
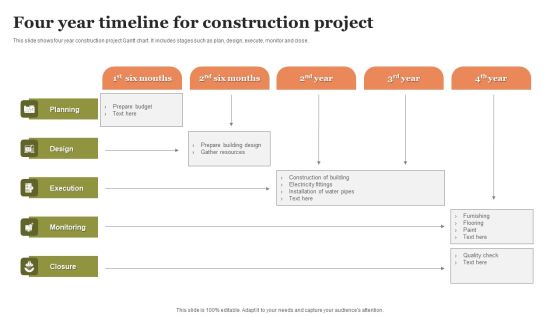
Four Year Timeline For Construction Project Sample PDF
This slide shows four year construction project Gantt chart. It includes stages such as plan, design, execute, monitor and close. Persuade your audience using this Four Year Timeline For Construction Project Sample PDF. This PPT design covers five stages, thus making it a great tool to use. It also caters to a variety of topics including Execution, Monitoring, Design, Planning. Download this PPT design now to present a convincing pitch that not only emphasizes the topic but also showcases your presentation skills.
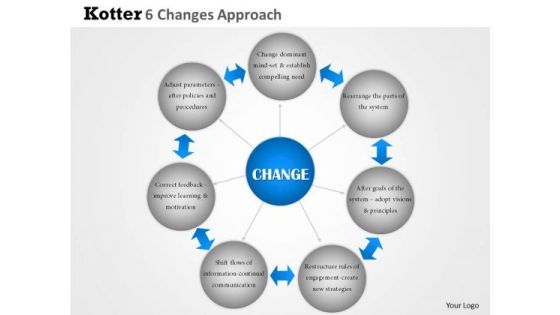
Business Framework Kotter 6 Changes Approach PowerPoint Presentation
This diagram displays framework for Kotters 6 changes approach. It contains graphics of interconnected circles. The diagram illustrates change approaches like change dominant mind-set and establish compelling need, rearrange the parts of the system, adopt visions and principles, restructure rules of engagement to create new strategies, shift flows of information for continual communication, correct feedback to improve learning and motivation, adjust parameters after policies and procedures.
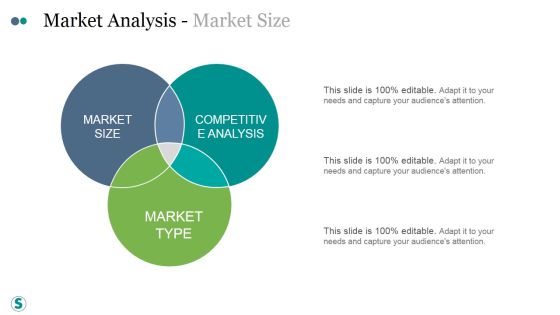
Market Analysis Market Size Ppt PowerPoint Presentation Microsoft
This is a market analysis market size ppt powerpoint presentation designs. This is a six stage process. The stages in this process are business, strategy, marketing, analysis, success, pie chart.
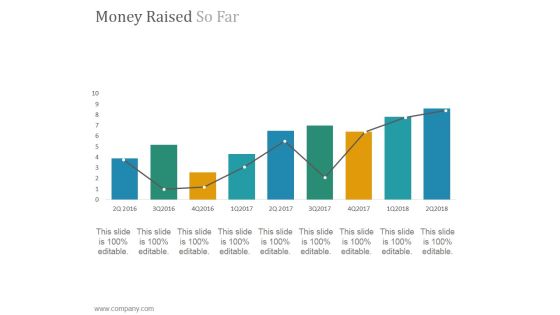
Money Raised So Far Ppt PowerPoint Presentation Layout
This is a money raised so far ppt powerpoint presentation layout. This is a nine stage process. The stages in this process are chart, bar graph, success, growth, marketing.
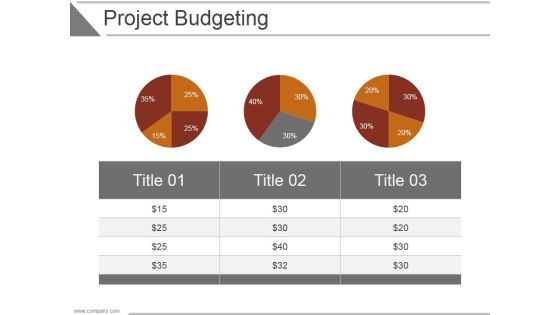
Project Budgeting Ppt PowerPoint Presentation Picture
This is a project budgeting ppt powerpoint presentation picture. This is a three stage process. The stages in this process are business, strategy, analysis, marketing, chart and graph, finance.

Bar Graph Ppt PowerPoint Presentation Infographic Template Background
This is a bar graph ppt powerpoint presentation infographic template background. This is a four stage process. The stages in this process are business, strategy, analysis, growth, chart and graph.
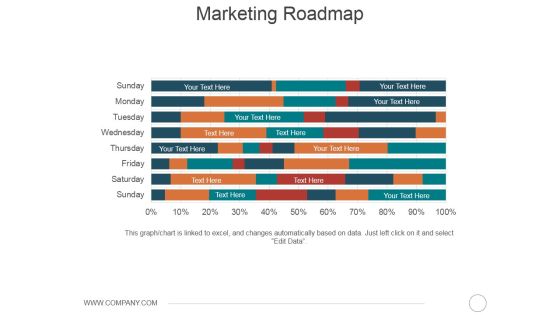
Marketing Roadmap Ppt PowerPoint Presentation Show Graphic Tips
This is a marketing roadmap ppt powerpoint presentation show graphic tips. This is a eight stage process. The stages in this process are business, marketing, strategy, analysis, bar chart.

Bar Graph Ppt PowerPoint Presentation Ideas Sample
This is a bar graph ppt powerpoint presentation ideas sample. This is a four stage process. The stages in this process are business, strategy, marketing, analysis, chart and graph, bar graph.
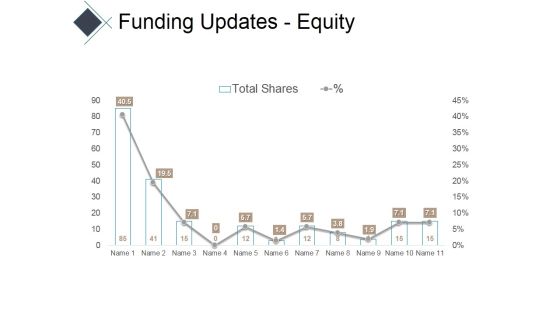
Funding Updates Equity Ppt PowerPoint Presentation Infographic Template Portfolio
This is a funding updates equity ppt powerpoint presentation infographic template portfolio. This is a eleven stage process. The stages in this process are charts, area, marketing, business, success.

Types Of Channel Promotion Used Ppt PowerPoint Presentation Outline Display
This is a types of channel promotion used ppt powerpoint presentation outline display. This is a ten stage process. The stages in this process are bar graph, business, marketing, strategy, charts.
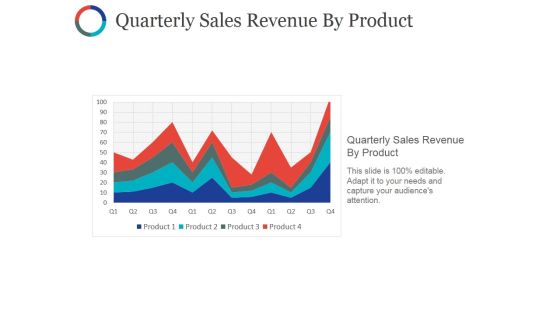
Quarterly Sales Revenue By Product Ppt PowerPoint Presentation Styles Slides
This is a quarterly sales revenue by product ppt powerpoint presentation styles slides. This is a four stage process. The stages in this process are quarterly sales revenue by product, charts, sales, business, success.

Activity Ratios Template 1 Ppt PowerPoint Presentation Portfolio Graphics
This is a activity ratios template 1 ppt powerpoint presentation portfolio graphics. This is a two stage process. The stages in this process are finance, chart graph, marketing, planning, analysis.

Activity Ratios Template 4 Ppt PowerPoint Presentation Portfolio Backgrounds
This is a activity ratios template 4 ppt powerpoint presentation portfolio backgrounds. This is a two stage process. The stages in this process are finance, chart graph, marketing, planning, analysis.

Liquidity Ratios Template Ppt PowerPoint Presentation Outline Elements
This is a liquidity ratios template ppt powerpoint presentation outline elements. This is a two stage process. The stages in this process are finance, chart graph, marketing, planning, analysis.
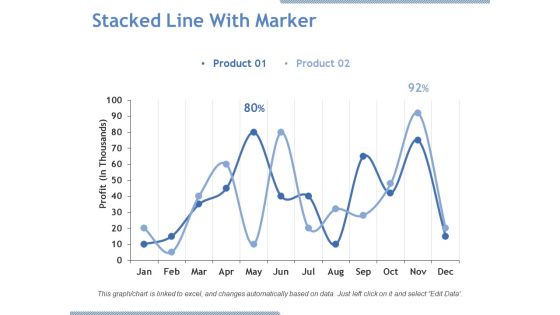
Stacked Line With Marker Ppt PowerPoint Presentation Pictures Graphics Download
This is a stacked line with marker ppt powerpoint presentation pictures graphics download. This is a two stage process. The stages in this process are product, profit, line chart, business, growth.

The Strategy Of Innovation Template 2 Ppt PowerPoint Presentation Professional Graphic Images
This is a the strategy of innovation template 2 ppt powerpoint presentation professional graphic images. This is a three stage process. The stages in this process are business, area chart, finance, marketing, strategy.

Clustered Column Line Ppt PowerPoint Presentation Inspiration Visual Aids
This is a clustered column line ppt powerpoint presentation inspiration visual aids. This is a four stage process. The stages in this process are business, marketing, strategy, planning, bar chart.

Actual Vs Target Sales Ppt PowerPoint Presentation Slides Template
This is a actual vs target sales ppt powerpoint presentation slides template. This is a seven stage process. The stages in this process are bar chart, marketing, strategy, finance, planning.
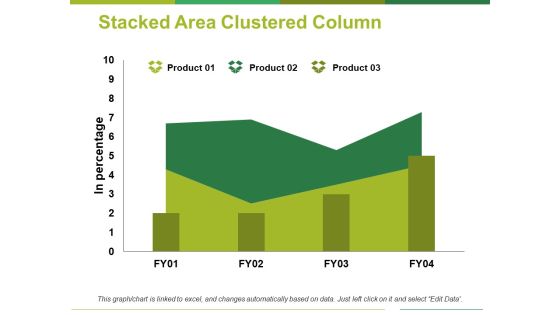
Stacked Area Clustered Column Ppt PowerPoint Presentation Professional Clipart
This is a stacked area clustered column ppt powerpoint presentation professional clipart. This is a three stage process. The stages in this process are product, in percentage, area chart.

Stacked Area Clustered Column Ppt PowerPoint Presentation Layouts Templates
This is a stacked area clustered column ppt powerpoint presentation layouts templates. This is a three stage process. The stages in this process are product, in percentage, area chart.

Stacked Line With Markers Ppt PowerPoint Presentation Pictures Background Designs
This is a stacked line with markers ppt powerpoint presentation pictures background designs. This is a two stage process. The stages in this process are line chart, marketing, strategy, planning, finance.

Stacked Bar Ppt PowerPoint Presentation Model Graphics
This is a stacked bar ppt powerpoint presentation model graphics. This is a two stage process. The stages in this process are stacked bar, product, chart and graph, finance, business.

Analyzing Bank Features Ppt PowerPoint Presentation Professional Background
This is a analyzing bank features ppt powerpoint presentation professional background. This is a six stage process. The stages in this process are comparison chart, comparison table, comparison matrix.

Business Profit And Losses Ppt PowerPoint Presentation Summary Outline
This is a business profit and losses ppt powerpoint presentation summary outline. This is a two stage process. The stages in this process are comparison chart, comparison table, comparison matrix.

Competitors Analysis Table Ppt PowerPoint Presentation Layouts Example Introduction
This is a competitors analysis table ppt powerpoint presentation layouts example introduction. This is a seven stage process. The stages in this process are comparison chart, comparison table, comparison matrix.
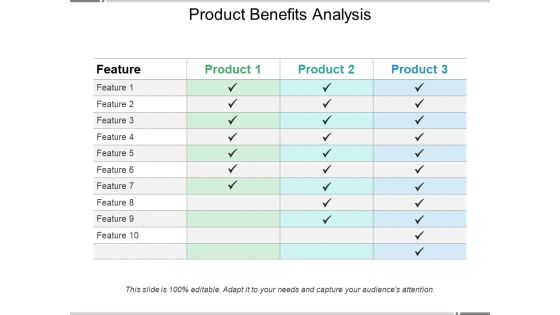
Product Benefits Analysis Ppt PowerPoint Presentation Summary Background
This is a product benefits analysis ppt powerpoint presentation summary background. This is a four stage process. The stages in this process are comparison chart, comparison table, comparison matrix.

Product Pricing Table Ppt PowerPoint Presentation File Deck
This is a product pricing table ppt powerpoint presentation file deck. This is a four stage process. The stages in this process are comparison chart, comparison table, comparison matrix.
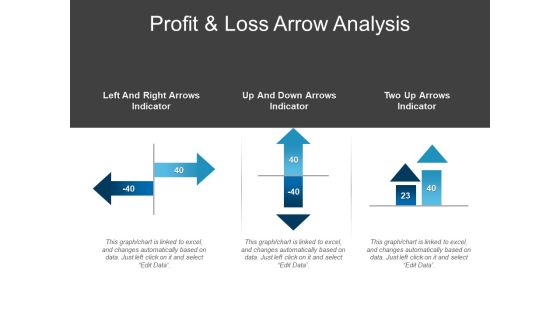
Profit And Loss Arrow Analysis Ppt PowerPoint Presentation Infographic Template Model
This is a profit and loss arrow analysis ppt powerpoint presentation infographic template model. This is a three stage process. The stages in this process are comparison chart, comparison table, comparison matrix.
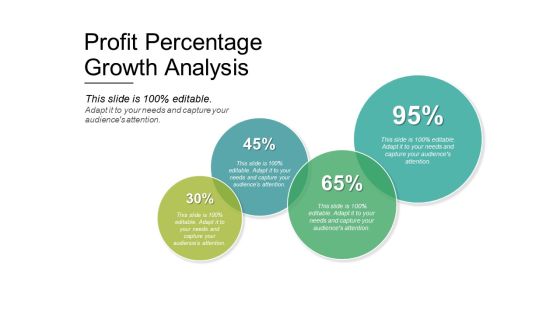
Profit Percentage Growth Analysis Ppt PowerPoint Presentation Layouts Graphics Tutorials
This is a profit percentage growth analysis ppt powerpoint presentation layouts graphics tutorials. This is a four stage process. The stages in this process are comparison chart, comparison table, comparison matrix.
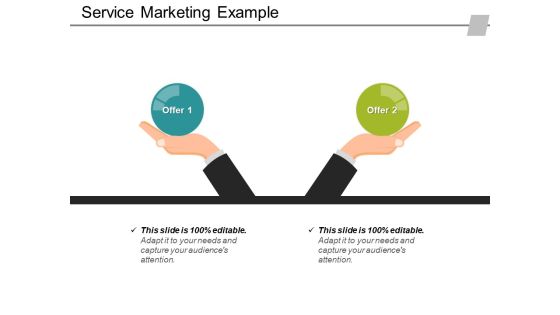
Service Marketing Example Ppt PowerPoint Presentation Styles Example File
This is a service marketing example ppt powerpoint presentation styles example file. This is a two stage process. The stages in this process are comparison chart, comparison table, comparison matrix.

Version And Features Comparison Ppt PowerPoint Presentation Portfolio Example Topics
This is a version and features comparison ppt powerpoint presentation portfolio example topics. This is a five stage process. The stages in this process are comparison chart, comparison table, comparison matrix.
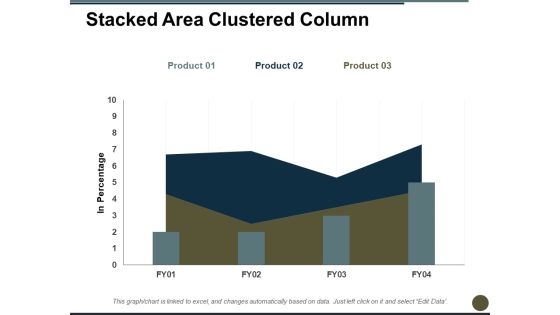
Stacked Area Clustered Column Ppt PowerPoint Presentation Professional Graphics
This is a stacked area clustered column ppt powerpoint presentation professional graphics. This is a three stage process. The stages in this process are in percentage, bar chart, product, growth, year.

Create A Weekly Schedule Ppt PowerPoint Presentation Styles Background Image
This is a create a weekly schedule ppt powerpoint presentation styles background image. This is a four stage process. The stages in this process are table, chart, task description, plan start, plan end.

Area Stacked Analysis Ppt PowerPoint Presentation Inspiration Slideshow
This is a area stacked analysis ppt powerpoint presentation inspiration slideshow. This is a two stage process. The stages in this process are area chart, finance, marketing, strategy, business.

Compare Versions Essential Deluxe And Platinum Ppt Powerpoint Presentation File Graphics Download
This is a compare versions essential deluxe and platinum ppt powerpoint presentation file graphics download. This is a four stage process. The stages in this process are comparison chart, comparison table, comparison matrix.
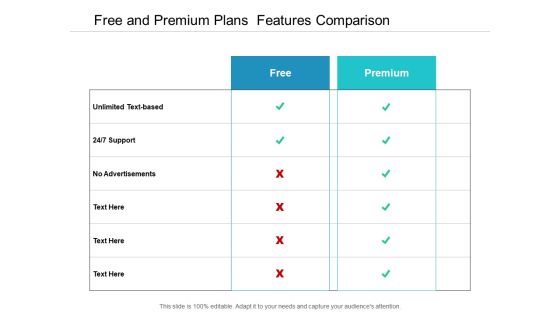
Free And Premium Plans Features Comparison Ppt Powerpoint Presentation Slides Template
This is a free and premium plans features comparison ppt powerpoint presentation slides template. This is a two stage process. The stages in this process are comparison chart, comparison table, comparison matrix.
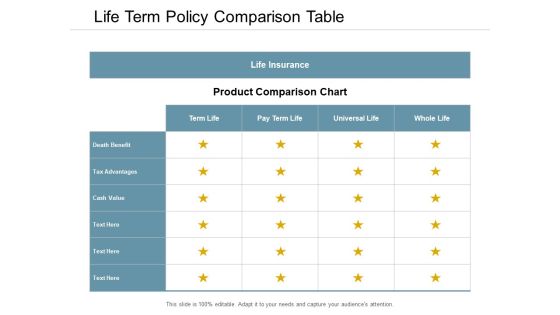
Life Term Policy Comparison Table Ppt Powerpoint Presentation Professional Images
This is a life term policy comparison table ppt powerpoint presentation professional images. This is a four stage process. The stages in this process are comparison chart, comparison table, comparison matrix.

Product Features Comparison Table Ppt Powerpoint Presentation Ideas Vector
This is a product features comparison table ppt powerpoint presentation ideas vector. This is a seven stage process. The stages in this process are comparison chart, comparison table, comparison matrix.
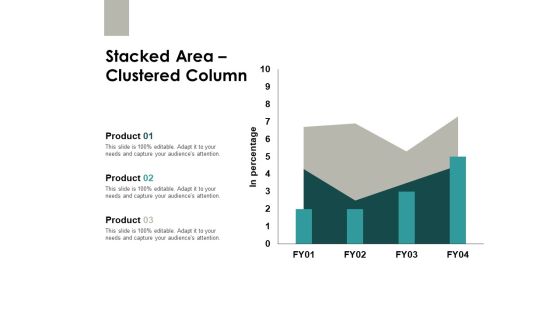
Stacked Area Clustered Column Finance Ppt PowerPoint Presentation Slides Images
This is a stacked area clustered column finance ppt powerpoint presentation slides images. This is a three stage process. The stages in this process are area chart, finance, marketing, analysis, investment.

Area Stacked Finance Ppt PowerPoint Presentation Inspiration Graphics Download
This is a area stacked finance ppt powerpoint presentation inspiration graphics download. This is a three stage process. The stages in this process are area chart, finance, marketing, analysis, investment.
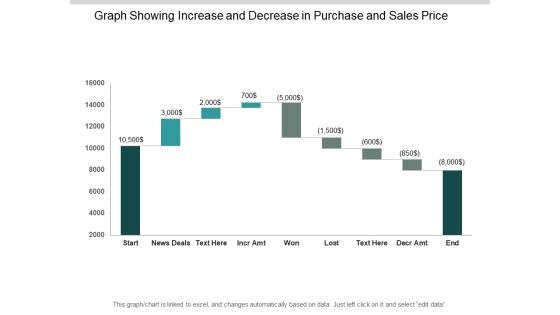
Graph Showing Increase And Decrease In Purchase And Sales Price Ppt PowerPoint Presentation Outline Gallery
This is a graph showing increase and decrease in purchase and sales price ppt powerpoint presentation outline gallery. This is a nine stage process. The stages in this process are sales waterfall, waterfall chart, business.

Sales Graph Showing Payouts Losses And Wins Ppt PowerPoint Presentation Pictures Designs Download
This is a sales graph showing payouts losses and wins ppt powerpoint presentation pictures designs download. This is a eight stage process. The stages in this process are sales waterfall, waterfall chart, business.

Waterfall Graph For Income And Expense Analysis Ppt PowerPoint Presentation File Deck
This is a waterfall graph for income and expense analysis ppt powerpoint presentation file deck. This is a eight stage process. The stages in this process are sales waterfall, waterfall chart, business.
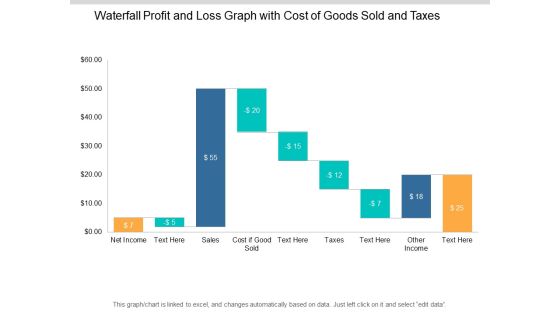
Waterfall Profit And Loss Graph With Cost Of Goods Sold And Taxes Ppt PowerPoint Presentation Show Slideshow
This is a waterfall profit and loss graph with cost of goods sold and taxes ppt powerpoint presentation show slideshow. This is a nine stage process. The stages in this process are sales waterfall, waterfall chart, business.

Algorithm Graph Pattern Matching Ppt PowerPoint Presentation Inspiration Background Images
This is a algorithm graph pattern matching ppt powerpoint presentation inspiration background images. This is a two stage process. The stages in this process are graph theory, chart theory, business.
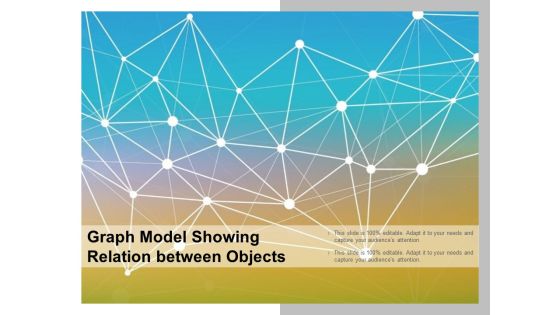
Graph Model Showing Relation Between Objects Ppt PowerPoint Presentation Summary Graphics Tutorials
This is a graph model showing relation between objects ppt powerpoint presentation summary graphics tutorials. This is a two stage process. The stages in this process are graph theory, chart theory, business.

Graph Pattern For Network Analysis Ppt PowerPoint Presentation Infographics Graphics Template
This is a graph pattern for network analysis ppt powerpoint presentation infographics graphics template. This is a two stage process. The stages in this process are graph theory, chart theory, business.
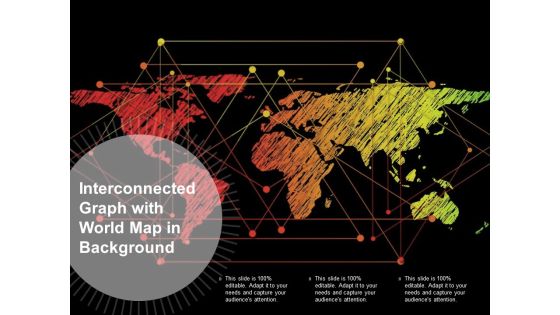
Interconnected Graph With World Map In Background Ppt PowerPoint Presentation Infographics Slide
This is a interconnected graph with world map in background ppt powerpoint presentation infographics slide. This is a three stage process. The stages in this process are graph theory, chart theory, business.
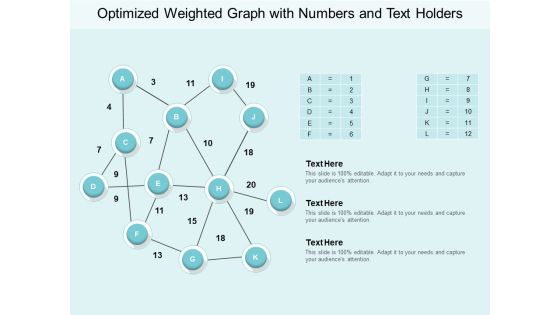
Optimized Weighted Graph With Numbers And Text Holders Ppt PowerPoint Presentation Outline Picture
This is a optimized weighted graph with numbers and text holders ppt powerpoint presentation outline picture. This is a three stage process. The stages in this process are graph theory, chart theory, business.
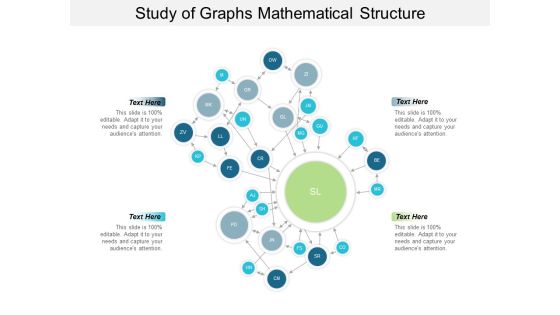
Study Of Graphs Mathematical Structure Ppt PowerPoint Presentation Gallery Background
This is a study of graphs mathematical structure ppt powerpoint presentation gallery background. This is a four stage process. The stages in this process are graph theory, chart theory, business.

Three Graphs For Path Algorithm Ppt PowerPoint Presentation Infographic Template Templates
This is a three graphs for path algorithm ppt powerpoint presentation infographic template templates. This is a three stage process. The stages in this process are graph theory, chart theory, business.
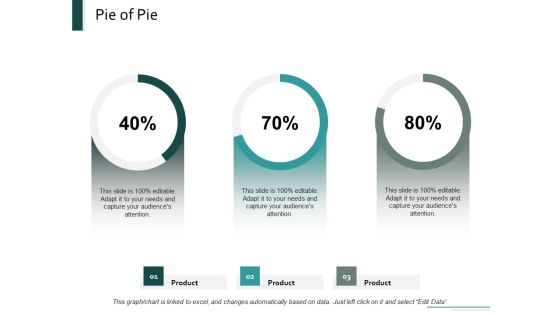
Pie Of Pie Marketing Ppt Powerpoint Presentation Inspiration Designs
This is a pie of pie marketing ppt powerpoint presentation inspiration designs. This is a three stage process. The stages in this process are finance, pie chart, product, marketing, percentage.

Intelligent Process Automation IPA Roadmap To Hyper Automation Implementation Topics PDF
This slide talks about the roadmap from simple automation to hyper-automation in the company. It includes various steps such as job automation, process automation, business operations, conversational user experience, event processing, and Intelligence. If you are looking for a format to display your unique thoughts, then the professionally designed Intelligent Process Automation IPA Roadmap To Hyper Automation Implementation Topics PDF is the one for you. You can use it as a Google Slides template or a PowerPoint template. Incorporate impressive visuals, symbols, images, and other charts. Modify or reorganize the text boxes as you desire. Experiment with shade schemes and font pairings. Alter, share or cooperate with other people on your work. Download Intelligent Process Automation IPA Roadmap To Hyper Automation Implementation Topics PDF and find out how to give a successful presentation. Present a perfect display to your team and make your presentation unforgettable.

Transformer Neural Network Architecture Of Chatgpt Brochure PDF
This slide demonstrates the architecture diagram of ChatGPT. The purpose of this slide is to represent how ChatGPT uses transformer model to create cohesive responses. The main components self-attention layers, feed-forward layers, residual connections etc. Make sure to capture your audiences attention in your business displays with our gratis customizable Transformer Neural Network Architecture Of Chatgpt Brochure PDF. These are great for business strategies, office conferences, capital raising or task suggestions. If you desire to acquire more customers for your tech business and ensure they stay satisfied, create your own sales presentation with these plain slides.
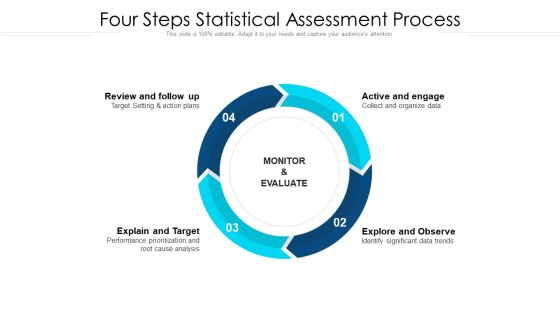
Four Steps Statistical Assessment Process Ppt Infographic Template Templates PDF
Presenting four steps statistical assessment process ppt infographic template templates pdf to dispense important information. This template comprises four stages. It also presents valuable insights into the topics including active and engage, explore and observe, explain and target, review and follow up. This is a completely customizable PowerPoint theme that can be put to use immediately. So, download it and address the topic impactfully.
