Machine Learning

Analyzing And Deploying Human Resource Analytics Key Performance Metrics Dashboard Themes PDF
This slide shows dashboard of the human resource analytics software. It includes details related to open positions, conversion ratio, offer accepted, cost of hiring by grade etc. Do you have to make sure that everyone on your team knows about any specific topic I yes, then you should give Analyzing And Deploying Human Resource Analytics Key Performance Metrics Dashboard Themes PDF a try. Our experts have put a lot of knowledge and effort into creating this impeccable Analyzing And Deploying Human Resource Analytics Key Performance Metrics Dashboard Themes PDF. You can use this template for your upcoming presentations, as the slides are perfect to represent even the tiniest detail. You can download these templates from the Slidegeeks website and these are easy to edit. So grab these today.

Toolkit For Data Science And Analytics Transition RACI Matrix For Analyzing Data In Project Diagrams PDF
The slide explains the RACI Matrix with the roles on vertical axis and tasks on horizontal axis for executing data analytics project. Explore a selection of the finest Toolkit For Data Science And Analytics Transition RACI Matrix For Analyzing Data In Project Diagrams PDF here. With a plethora of professionally designed and pre made slide templates, you can quickly and easily find the right one for your upcoming presentation. You can use our Toolkit For Data Science And Analytics Transition RACI Matrix For Analyzing Data In Project Diagrams PDF to effectively convey your message to a wider audience. Slidegeeks has done a lot of research before preparing these presentation templates. The content can be personalized and the slides are highly editable. Grab templates today from Slidegeeks.

Data Analytics Work Streams With Its Roles And Responsibilities Rules PDF
This slide highlights the key responsibilities, data work streams and. and data head roles for constructing data analytics project. Here you can discover an assortment of the finest PowerPoint and Google Slides templates. With these templates, you can create presentations for a variety of purposes while simultaneously providing your audience with an eye catching visual experience. Download Data Analytics Work Streams With Its Roles And Responsibilities Rules PDF to deliver an impeccable presentation. These templates will make your job of preparing presentations much quicker, yet still, maintain a high level of quality. Slidegeeks has experienced researchers who prepare these templates and write high quality content for you. Later on, you can personalize the content by editing the Data Analytics Work Streams With Its Roles And Responsibilities Rules PDF.

Charity Fundraising Marketing Plan Use Google Analytics To Determine Target Audience Template PDF
This slide provides an overview of the demographic derived from Google analytics to identify the target audience. Major target market includes corporate sponsors, direct beneficiaries, donors and volunteers. Do you have to make sure that everyone on your team knows about any specific topic I yes, then you should give Charity Fundraising Marketing Plan Use Google Analytics To Determine Target Audience Template PDF a try. Our experts have put a lot of knowledge and effort into creating this impeccable Charity Fundraising Marketing Plan Use Google Analytics To Determine Target Audience Template PDF. You can use this template for your upcoming presentations, as the slides are perfect to represent even the tiniest detail. You can download these templates from the Slidegeeks website and these are easy to edit. So grab these today.

Direct Response Marketing Guide Ultimate Success Analytics Dashboard To Track Mockup PDF
This slide provides an overview of the analytics dashboard that helps to measure the performance of the website. The dashboard includes visits, average session duration, bounce rate, page views and goal conversion. Find highly impressive Direct Response Marketing Guide Ultimate Success Analytics Dashboard To Track Mockup PDF on Slidegeeks to deliver a meaningful presentation. You can save an ample amount of time using these presentation templates. No need to worry to prepare everything from scratch because Slidegeeks experts have already done a huge research and work for you. You need to download Direct Response Marketing Guide Ultimate Success Analytics Dashboard To Track Mockup PDF for your upcoming presentation. All the presentation templates are 100 percent editable and you can change the color and personalize the content accordingly. Download now

Website Analytics Dashboard For Consumer Data Insights Ppt PowerPoint Presentation File Slides PDF
This slide showcases dashboard for website analytics that can help organization to gather data about visitors and formulate targeted marketing campaigns. It can also help to make individual and group buyer personas. If you are looking for a format to display your unique thoughts, then the professionally designed Website Analytics Dashboard For Consumer Data Insights Ppt PowerPoint Presentation File Slides PDF is the one for you. You can use it as a Google Slides template or a PowerPoint template. Incorporate impressive visuals, symbols, images, and other charts. Modify or reorganize the text boxes as you desire. Experiment with shade schemes and font pairings. Alter, share or cooperate with other people on your work. Download Website Analytics Dashboard For Consumer Data Insights Ppt PowerPoint Presentation File Slides PDF and find out how to give a successful presentation. Present a perfect display to your team and make your presentation unforgettable.

Guide For Marketing Analytics To Improve Decisions Social Media Marketing Channel Performance Analysis Dashboard Background PDF
The following slide showcases social media analytical dashboard to deliver best content and drive more website users. It includes elements such as post reach, sessions, organic traffic, cost per lead, page engagement, traffic through ads etc. Do you have an important presentation coming up Are you looking for something that will make your presentation stand out from the rest Look no further than Guide For Marketing Analytics To Improve Decisions Social Media Marketing Channel Performance Analysis Dashboard Background PDF. With our professional designs, you can trust that your presentation will pop and make delivering it a smooth process. And with Slidegeeks, you can trust that your presentation will be unique and memorable. So why wait Grab Guide For Marketing Analytics To Improve Decisions Social Media Marketing Channel Performance Analysis Dashboard Background PDF today and make your presentation stand out from the rest.
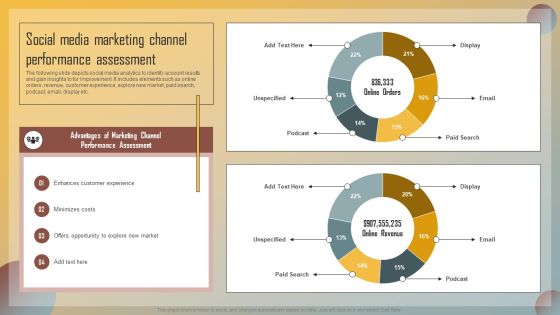
Guide For Marketing Analytics To Improve Decisions Social Media Marketing Channel Performance Assessment Pictures PDF
The following slide depicts social media analytics to identify account results and gain insights to for improvement. It includes elements such as online orders, revenue, customer experience, explore new market, paid search, podcast, email, display etc. Whether you have daily or monthly meetings, a brilliant presentation is necessary. Guide For Marketing Analytics To Improve Decisions Social Media Marketing Channel Performance Assessment Pictures PDF can be your best option for delivering a presentation. Represent everything in detail using Guide For Marketing Analytics To Improve Decisions Social Media Marketing Channel Performance Assessment Pictures PDF and make yourself stand out in meetings. The template is versatile and follows a structure that will cater to your requirements. All the templates prepared by Slidegeeks are easy to download and edit. Our research experts have taken care of the corporate themes as well. So, give it a try and see the results.
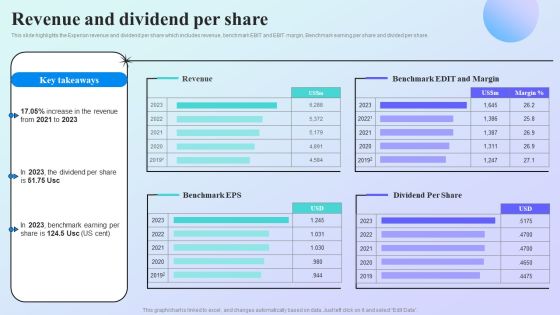
Information Analytics Company Outline Revenue And Dividend Per Share Guidelines PDF
This slide highlights the Experian revenue and dividend per share which includes revenue, benchmark EBIT and EBIT margin, Benchmark earning per share and divided per share. Presenting this PowerPoint presentation, titled Information Analytics Company Outline Revenue And Dividend Per Share Guidelines PDF, with topics curated by our researchers after extensive research. This editable presentation is available for immediate download and provides attractive features when used. Download now and captivate your audience. Presenting this Information Analytics Company Outline Revenue And Dividend Per Share Guidelines PDF. Our researchers have carefully researched and created these slides with all aspects taken into consideration. This is a completely customizable Information Analytics Company Outline Revenue And Dividend Per Share Guidelines PDF that is available for immediate downloading. Download now and make an impact on your audience. Highlight the attractive features available with our PPTs.

Website Analytics Dashboard For Consumer Data Insights Ppt Infographic Template Samples PDF
This slide showcases dashboard for website analytics that can help organization to gather data about visitors and formulate targeted marketing campaigns. It can also help to make individual and group buyer personas. Crafting an eye catching presentation has never been more straightforward. Let your presentation shine with this tasteful yet straightforward Website Analytics Dashboard For Consumer Data Insights Ppt Infographic Template Samples PDF template. It offers a minimalistic and classy look that is great for making a statement. The colors have been employed intelligently to add a bit of playfulness while still remaining professional. Construct the ideal Website Analytics Dashboard For Consumer Data Insights Ppt Infographic Template Samples PDF that effortlessly grabs the attention of your audience Begin now and be certain to wow your customers.
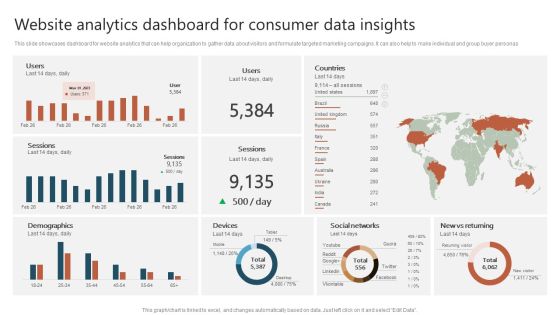
Website Analytics Dashboard For Consumer Data Insights Ppt Show Graphics Download PDF
This slide showcases dashboard for website analytics that can help organization to gather data about visitors and formulate targeted marketing campaigns. It can also help to make individual and group buyer personas. Crafting an eye catching presentation has never been more straightforward. Let your presentation shine with this tasteful yet straightforward Website Analytics Dashboard For Consumer Data Insights Ppt Show Graphics Download PDF template. It offers a minimalistic and classy look that is great for making a statement. The colors have been employed intelligently to add a bit of playfulness while still remaining professional. Construct the ideal Website Analytics Dashboard For Consumer Data Insights Ppt Show Graphics Download PDF that effortlessly grabs the attention of your audience Begin now and be certain to wow your customers.
Toolkit For Data Science And Analytics Transition Ppt PowerPoint Presentation Complete Deck With Slides
Starting a presentation on business is a decision to make. As you think about it, you realize that everything is a decision. Our Toolkit For Data Science And Analytics Transition Ppt PowerPoint Presentation Complete Deck With Slides will make all your business tasks and decisions a bit easier, with its emphasis on planning. The ninty one slide complete deck allows you to present the daily challenges of business in your own way to your team, key stakeholders, and external vendors etc. With each slide being 100 percent editable and customizable, you may decide to fiddle around with the design or the content ready nature to arrive at your own, presentation on a topic of your choosing. Download now.

Branches For Visual Analytics Branch Of Visualization Research And Development Slides PDF
This slide shows visual analytics, the last branch of visualization research, which emerged from the advancements in the other two branches and mainly focused on analytical reasoning. Want to ace your presentation in front of a live audience Our Branches For Visual Analytics Branch Of Visualization Research And Development Slides PDF can help you do that by engaging all the users towards you. Slidegeeks experts have put their efforts and expertise into creating these impeccable powerpoint presentations so that you can communicate your ideas clearly. Moreover, all the templates are customizable, and easy-to-edit and downloadable. Use these for both personal and commercial use.
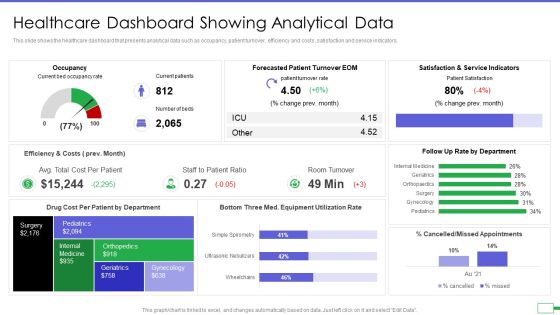
Iot And Digital Twin To Reduce Costs Post Covid Healthcare Dashboard Showing Analytical Data Elements PDF
This slide shows the healthcare dashboard that presents analytical data such as occupancy, patient turnover, efficiency and costs, satisfaction and service indicators. Deliver and pitch your topic in the best possible manner with this iot and digital twin to reduce costs post covid healthcare dashboard showing analytical data elements pdf. Use them to share invaluable insights on occupancy, patient turnover, efficiency and costs, satisfaction and service indicators and impress your audience. This template can be altered and modified as per your expectations. So, grab it now.
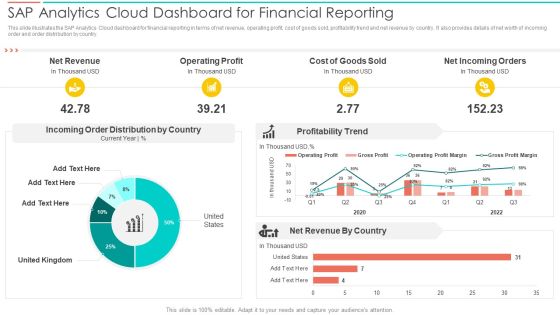
SAC Planning And Implementation SAP Analytics Cloud Dashboard For Financial Reporting Introduction PDF
This slide illustrates the SAP Analytics Cloud dashboard for financial reporting in terms of net revenue, operating profit, cost of goods sold, profitability trend and net revenue by country. It also provides details of net worth of incoming order and order distribution by country. Deliver an awe inspiring pitch with this creative SAC Planning And Implementation SAP Analytics Cloud Dashboard For Financial Reporting Introduction PDF bundle. Topics like Net Revenue, Operating Profit, Cost Goods Sold can be discussed with this completely editable template. It is available for immediate download depending on the needs and requirements of the user.
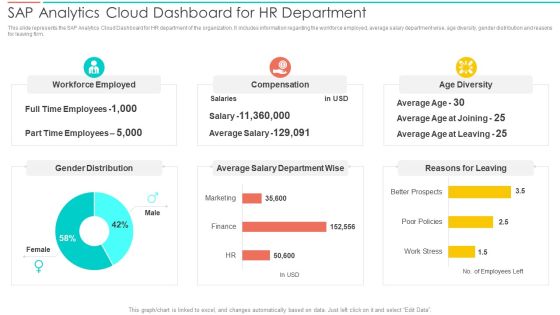
SAC Planning And Implementation SAP Analytics Cloud Dashboard For Hr Department Inspiration PDF
This slide represents the SAP Analytics Cloud Dashboard for HR department of the organization. It includes information regarding the workforce employed, average salary department wise, age diversity, gender distribution and reasons for leaving firm. Deliver and pitch your topic in the best possible manner with this SAC Planning And Implementation SAP Analytics Cloud Dashboard For Hr Department Inspiration PDF. Use them to share invaluable insights on Workforce Employed, Compensation, Age Diversity and impress your audience. This template can be altered and modified as per your expectations. So, grab it now.
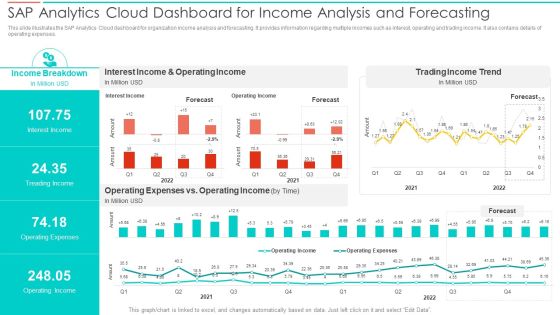
SAC Planning And Implementation SAP Analytics Cloud Dashboard For Income Analysis Summary PDF
This slide illustrates the SAP Analytics Cloud dashboard for organization income analysis and forecasting. It provides information regarding multiple incomes such as interest, operating and trading income. It also contains details of operating expenses. Deliver an awe inspiring pitch with this creative SAC Planning And Implementation SAP Analytics Cloud Dashboard For Income Analysis Summary PDF bundle. Topics like Income Breakdown, Interest Income, Operating Income, Trading Income Trend can be discussed with this completely editable template. It is available for immediate download depending on the needs and requirements of the user.
SAC Planning And Implementation SAP Analytics Cloud Dashboard For Product Sales Analysis Icons PDF
This slide illustrates the SAP Analytics Cloud dashboard to monitor product sales performance. It provides information regarding the gross margin and net revenue earned, product performance state wise and year wise. Deliver and pitch your topic in the best possible manner with this SAC Planning And Implementation SAP Analytics Cloud Dashboard For Product Sales Analysis Icons PDF. Use them to share invaluable insights on Gross Margin, Earned Quarter Wise, Gross Margin, Net Revenue and impress your audience. This template can be altered and modified as per your expectations. So, grab it now.
SAC Planning And Implementation SAP Analytics Cloud Dashboard To Asses Digital Marketing Pictures PDF
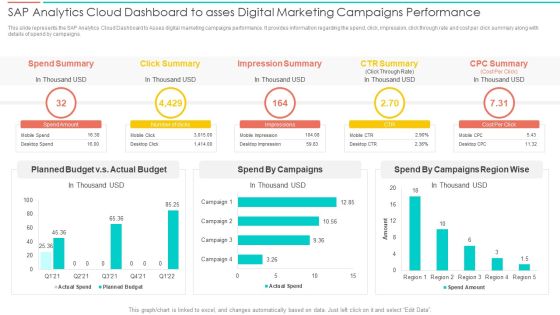
This slide represents the SAP Analytics Cloud Dashboard to Asses digital marketing campaigns performance. It provides information regarding the spend, click, impression, click through rate and cost per click summary along with details of spend by campaigns. Deliver an awe inspiring pitch with this creative SAC Planning And Implementation SAP Analytics Cloud Dashboard To Asses Digital Marketing Pictures PDF bundle. Topics like Spend Summary, Click Summary, Impression Summary, CTR Summary can be discussed with this completely editable template. It is available for immediate download depending on the needs and requirements of the user.

Landing Page Leads And Revenue Generation Analytics For User Experience Optimization Dashboard Formats PDF
This slide covers website analytics based on revenue earned. It also included leads generated, bounce rates, customer churn stats, annual and monthly recurring revenue, etc. Pitch your topic with ease and precision using this Landing Page Leads And Revenue Generation Analytics For User Experience Optimization Dashboard Formats PDF. This layout presents information on Monthly Recurring Revenue, Bounce Rate, Gross Volume. It is also available for immediate download and adjustment. So, changes can be made in the color, design, graphics or any other component to create a unique layout.
Landing Page Speed Optimization And Bounce Rate Analytics Dashboard Topics PDF
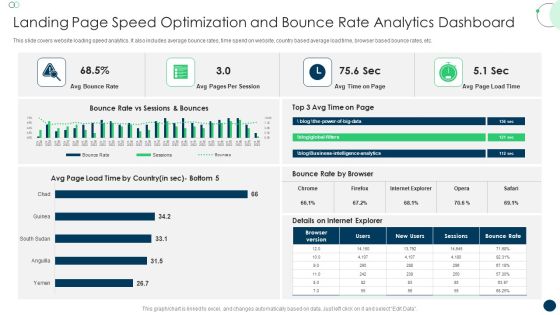
This slide covers website loading speed analytics. It also includes average bounce rates, time spend on website, country based average load time, browser based bounce rates, etc. Pitch your topic with ease and precision using this Landing Page Speed Optimization And Bounce Rate Analytics Dashboard Topics PDF. This layout presents information on Avg Bounce Rate, Avg Pages, Per Session. It is also available for immediate download and adjustment. So, changes can be made in the color, design, graphics or any other component to create a unique layout.

Sap Analytics Cloud Dashboard For Income Analysis And Forecasting Formats PDF
This slide illustrates the SAP Analytics Cloud dashboard for organization income analysis and forecasting. It provides information regarding multiple incomes such as interest, operating and trading income. It also contains details of operating expenses. The best PPT templates are a great way to save time, energy, and resources. Slidegeeks have 100 percent editable powerpoint slides making them incredibly versatile. With these quality presentation templates, you can create a captivating and memorable presentation by combining visually appealing slides and effectively communicating your message. Download Sap Analytics Cloud Dashboard To Asses Digital Marketing Campaigns Performance Ideas PDF from Slidegeeks and deliver a wonderful presentation.

Sap Analytics Cloud Dashboard To Asses Digital Marketing Campaigns Performance Ideas PDF
This slide represents the SAP Analytics Cloud Dashboard to Asses digital marketing campaigns performance. It provides information regarding the spend, click, impression, click through rate and cost per click summary along with details of spend by campaigns. The best PPT templates are a great way to save time, energy, and resources. Slidegeeks have 100 percent editable powerpoint slides making them incredibly versatile. With these quality presentation templates, you can create a captivating and memorable presentation by combining visually appealing slides and effectively communicating your message. Download Sap Analytics Cloud Dashboard To Asses Digital Marketing Campaigns Performance Ideas PDF from Slidegeeks and deliver a wonderful presentation.
Revenue And Growth Analysis Analytics Dashboard Ppt Infographic Template Brochure PDF
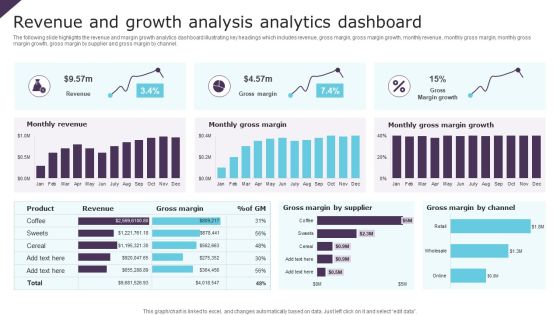
The following slide highlights the revenue and margin growth analytics dashboard illustrating key headings which includes revenue, gross margin, gross margin growth, monthly revenue, monthly gross margin, monthly gross margin growth, gross margin by supplier and gross margin by channel. Pitch your topic with ease and precision using this Revenue And Growth Analysis Analytics Dashboard Ppt Infographic Template Brochure PDF. This layout presents information on Monthly Revenue, Monthly Gross Margin, Gross Margin Growth. It is also available for immediate download and adjustment. So, changes can be made in the color, design, graphics or any other component to create a unique layout.
Implementing CRM To Optimize Dashboard Depicting Customer Retention Analytics Icons PDF
This slide shows the dashboard that depicts customer retention analytics which includes net promoter score, customer loyalty rate, customer lifetime value, customer and revenue churn, monthly recurring revenue growth, etc. Slidegeeks is one of the best resources for PowerPoint templates. You can download easily and regulate Implementing CRM To Optimize Dashboard Depicting Customer Retention Analytics Icons PDF for your personal presentations from our wonderful collection. A few clicks is all it takes to discover and get the most relevant and appropriate templates. Use our Templates to add a unique zing and appeal to your presentation and meetings. All the slides are easy to edit and you can use them even for advertisement purposes.

Cyber Security Incident Analytics Dashboard With Level Of Security Ppt Ideas Graphics Tutorials PDF
The given slide depicts the cyber threat analytics to track the attacks. It includes the no. of incidents, open and solved tickets, category wise no. of incidents along with malware type etc. Pitch your topic with ease and precision using this Cyber Security Incident Analytics Dashboard With Level Of Security Ppt Ideas Graphics Tutorials PDF. This layout presents information on Power Security Team, Open Incidents, Incidents Solved, Open Tickets. It is also available for immediate download and adjustment. So, changes can be made in the color, design, graphics or any other component to create a unique layout.

Cognitive Analytics Strategy And Techniques Determine Trends In Cognitive Computing Space Ideas PDF
This slide provides information regarding various trends existing in cognitive computing space in terms of contextual analytics and sensor generated data. Find a pre designed and impeccable Cognitive Analytics Strategy And Techniques Determine Trends In Cognitive Computing Space Ideas PDF. The templates can ace your presentation without additional effort. You can download these easy to edit presentation templates to make your presentation stand out from others. So, what are you waiting for Download the template from Slidegeeks today and give a unique touch to your presentation.

Actual Time Transaction Monitoring Software And Strategies TMS And Data Analytics Process Flow Icons PDF
This slide represents transaction monitoring system process flow. It provides information about data analytics, risk framework, alerting, ad hoc analysis, case management, external source entrance, stop list, politically exposed persons PEP, watch list, etc. There are so many reasons you need a Actual Time Transaction Monitoring Software And Strategies TMS And Data Analytics Process Flow Icons PDF. The first reason is you can not spend time making everything from scratch, Thus, Slidegeeks has made presentation templates for you too. You can easily download these templates from our website easily.

Talent Management Optimization With Workforce Staffing Talent Acquisition Analytics Framework Graphics PDF
This slide represents talent acquisition analytics framework. It includes talent outcomes, candidate quality, hiring volume, source, talent acquisition data etc. This modern and well arranged Talent Management Optimization With Workforce Staffing Talent Acquisition Analytics Framework Graphics PDF provides lots of creative possibilities. It is very simple to customize and edit with the Powerpoint Software. Just drag and drop your pictures into the shapes. All facets of this template can be edited with Powerpoint no extra software is necessary. Add your own material, put your images in the places assigned for them, adjust the colors, and then you can show your slides to the world, with an animated slide included.
Effective NPO Promotional Strategies For Recruit Volunteers Use Google Analytics To Determine Target Audience Brochure PDF
This slide provides an overview of the demographic derived from Google analytics to identify the target audience. Major target market includes corporate sponsors, direct beneficiaries, donors and volunteers. The best PPT templates are a great way to save time, energy, and resources. Slidegeeks have 100 percent editable powerpoint slides making them incredibly versatile. With these quality presentation templates, you can create a captivating and memorable presentation by combining visually appealing slides and effectively communicating your message. Download Effective NPO Promotional Strategies For Recruit Volunteers Use Google Analytics To Determine Target Audience Brochure PDF from Slidegeeks and deliver a wonderful presentation.
Effort Save Chart With Standard Analytics Ppt PowerPoint Presentation File Samples PDF
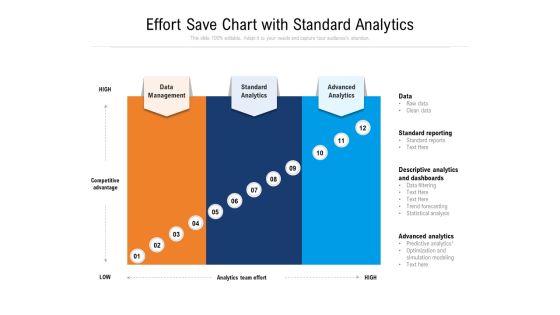
Persuade your audience using this effort save chart with standard analytics ppt powerpoint presentation file samples pdf. This PPT design covers three stages, thus making it a great tool to use. It also caters to a variety of topics including data management, standard analytics, advanced analytics. Download this PPT design now to present a convincing pitch that not only emphasizes the topic but also showcases your presentation skills.

Customer Relationship Management Marketing Aspects With Operational And Analytical Approaches Outline PDF
The mentioned slide highlights the major aspects of customer relationship management which includes the operational, analytical and collaborative CRM. Presenting customer relationship management marketing aspects with operational and analytical approaches outline pdf to dispense important information. This template comprises three stages. It also presents valuable insights into the topics including operational crm, analytical crm, collaborative crm. This is a completely customizable PowerPoint theme that can be put to use immediately. So, download it and address the topic impactfully.

Operational Analytical And Collaborative Consumer Service Strategy Software Features Infographics PDF
This slide provides information regarding the operational, analytical and collaborative software features of CRM. Presenting Operational Analytical And Collaborative Consumer Service Strategy Software Features Infographics PDF to provide visual cues and insights. Share and navigate important information on three stages that need your due attention. This template can be used to pitch topics like Operational, Analytical, Collaborative. In addtion, this PPT design contains high resolution images, graphics, etc, that are easily editable and available for immediate download.

Data Interpretation And Analysis Playbook Analytics From All The Data At Scale Challenges Structure PDF
This template covers the problems while implementing analytics from all the data, at scale in the organization. The challenges are large and complex data and analytic slowdown. This is a data interpretation and analysis playbook analytics from all the data at scale challenges structure pdf template with various stages. Focus and dispense information on two stages using this creative set, that comes with editable features. It contains large content boxes to add your information on topics like large and complex data, analytic slowdown. You can also showcase facts, figures, and other relevant content using this PPT layout. Grab it now.

Addressing Cognitive Analytics Cognitive Computing Action Plan Ppt Infographics Design Ideas PDF
This slide provides information regarding cognitive analytics architecture representing different layers such as high level data services layer, cognitive analytics layer, API layer and administration layer. This is a addressing cognitive analytics cognitive computing action plan ppt infographics design ideas pdf template with various stages. Focus and dispense information on four stages using this creative set, that comes with editable features. It contains large content boxes to add your information on topics like data services layer, cognitive analytics layer, api layer, administration layer. You can also showcase facts, figures, and other relevant content using this PPT layout. Grab it now.

Five Core Competencies To Build Effective Data Analytics Strategy Infographics PDF
This slide covers key components to create effective strategies for organising and managing data. It includes high performance data, advanced analytics, cloud computing, data integration and analytics. Presenting Five Core Competencies To Build Effective Data Analytics Strategy Infographics PDF to dispense important information. This template comprises five stages. It also presents valuable insights into the topics including High Performance Data, Advanced Analytics, Cloud Computing. This is a completely customizable PowerPoint theme that can be put to use immediately. So, download it and address the topic impactfully.
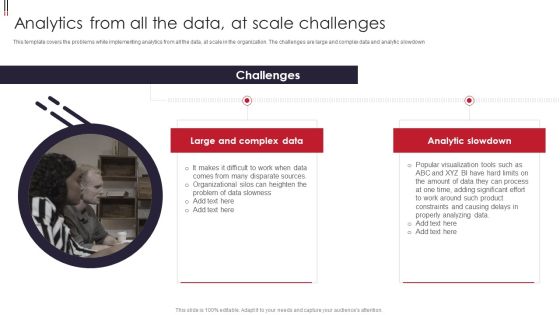
Information Visualizations Playbook Analytics From All The Data At Scale Challenges Structure PDF
This template covers the problems while implementing analytics from all the data, at scale in the organization. The challenges are large and complex data and analytic slowdown. Presenting Information Visualizations Playbook Analytics From All The Data At Scale Challenges Structure PDF to provide visual cues and insights. Share and navigate important information on two stages that need your due attention. This template can be used to pitch topics like Complex Data, Analytic Slowdown. In addtion, this PPT design contains high resolution images, graphics, etc, that are easily editable and available for immediate download.

Information Transformation Process Toolkit Key Phases Of Data Analytics Project Summary PDF
The slide explains the key phases of data analytics management. It includes multiple functions like data integration, data governance and repository management to accomplish data analytical results. This is a Information Transformation Process Toolkit Key Phases Of Data Analytics Project Summary PDF template with various stages. Focus and dispense information on four stages using this creative set, that comes with editable features. It contains large content boxes to add your information on topics like Data Integration, Data Repository Management, Data Analytics. You can also showcase facts, figures, and other relevant content using this PPT layout. Grab it now.

Marketing Success Metrics Pre And Post Market Analytics Implementation Information PDF
This slide covers a graphical representation of marketing analytics impact on various business aspects such as customer lifetime value, employee engagement, improvement in customer effort score, and average profit margin Per customer. Do you know about Slidesgeeks Marketing Success Metrics Pre And Post Market Analytics Implementation Information PDF These are perfect for delivering any kind od presentation. Using it, create PowerPoint presentations that communicate your ideas and engage audiences. Save time and effort by using our pre-designed presentation templates that are perfect for a wide range of topic. Our vast selection of designs covers a range of styles, from creative to business, and are all highly customizable and easy to edit. Download as a PowerPoint template or use them as Google Slides themes.
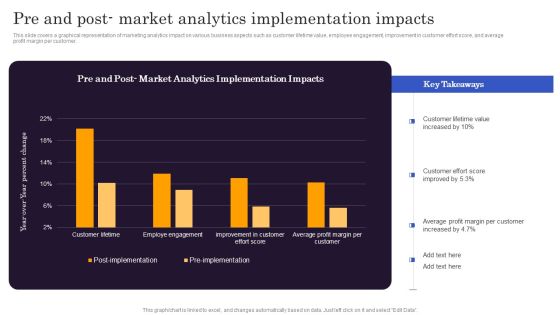
Marketers Guide To Data Analysis Optimization Pre And Post Market Analytics Implementation Impacts Formats PDF
This slide covers a graphical representation of marketing analytics impact on various business aspects such as customer lifetime value, employee engagement, improvement in customer effort score, and average profit margin per customer. Do you know about Slidesgeeks Marketers Guide To Data Analysis Optimization Pre And Post Market Analytics Implementation Impacts Formats PDF. These are perfect for delivering any kind od presentation. Using it, create PowerPoint presentations that communicate your ideas and engage audiences. Save time and effort by using our pre designed presentation templates that are perfect for a wide range of topic. Our vast selection of designs covers a range of styles, from creative to business, and are all highly customizable and easy to edit. Download as a PowerPoint template or use them as Google Slides themes.
Information Technology In A Supply Chain Analytical Applications Ppt PowerPoint Presentation Icon Graphics Design
This is a information technology in a supply chain analytical applications ppt powerpoint presentation icon graphics design. This is a three stage process. The stages in this process are strategic, planning, operational, supplier apps, dem plan.

Information Technology In A Supply Chain Analytical Applications Ppt PowerPoint Presentation Infographic Template Skills
This is a information technology in a supply chain analytical applications ppt powerpoint presentation infographic template skills. This is a three stage process. The stages in this process are strategic, planning, operational, supplier apps.

Communication Plan Monitoring Analytics And Reporting Ppt PowerPoint Presentation Infographics Layouts
This is a communication plan monitoring analytics and reporting ppt powerpoint presentation infographics layouts. This is a five stage process. The stages in this process are communication strategy, communication planning, communication management.

Customer Analytics Collect Internal And External Data Ppt PowerPoint Presentation Portfolio Skills
This is a customer analytics collect internal and external data ppt powerpoint presentation portfolio skills. This is a four stage process. The stages in this process are employee performance review, job evaluation, customer 360.
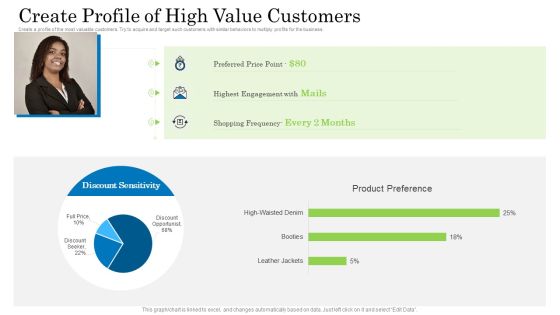
Customer Behavioral Data And Analytics Create Profile Of High Value Customers Professional PDF
Create a profile of the most valuable customers. Try to acquire and target such customers with similar behaviors to multiply profits for the business. Deliver an awe inspiring pitch with this creative customer behavioral data and analytics create profile of high value customers professional pdf bundle. Topics like create profile of high value customers can be discussed with this completely editable template. It is available for immediate download depending on the needs and requirements of the user.

Oracle Cloud Data Analytics Administration IT Oracle Smart View For Microsoft Excel Information PDF
This slide depicts the oracle smart view for Microsoft Excel and allows users to examine, import, modify, distribute and share data across Microsoft Office interfaces. Deliver an awe inspiring pitch with this creative oracle cloud data analytics administration it oracle smart view for microsoft excel information pdf bundle. Topics like enterprise, performance, management, business, intelligence can be discussed with this completely editable template. It is available for immediate download depending on the needs and requirements of the user.
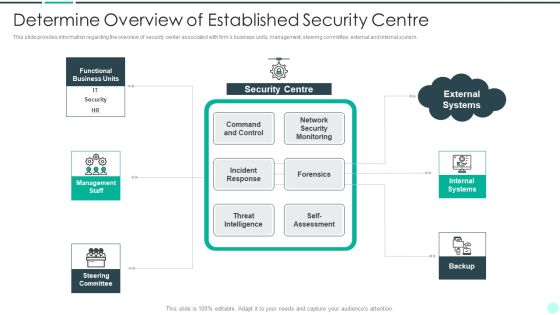
Executing Advance Data Analytics At Workspace Determine Overview Of Established Topics PDF
This slide provides information regarding the overview of security center associated with firms business units, management, steering committee, external and internal system. Deliver an awe inspiring pitch with this creative executing advance data analytics at workspace determine overview of established topics pdf bundle. Topics like determine overview of established security centre can be discussed with this completely editable template. It is available for immediate download depending on the needs and requirements of the user.
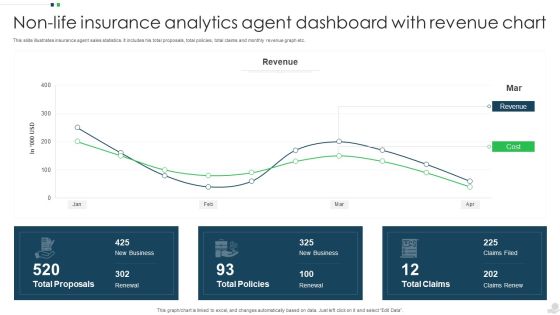
Non Life Insurance Analytics Agent Dashboard With Revenue Chart Infographics PDF
This slide illustrates insurance agent sales statistics. It includes his total proposals, total policies, total claims and monthly revenue graph etc. Showcasing this set of slides titled Non Life Insurance Analytics Agent Dashboard With Revenue Chart Infographics PDF. The topics addressed in these templates are Revenue, Cost, Total Proposals. All the content presented in this PPT design is completely editable. Download it and make adjustments in color, background, font etc. as per your unique business setting.

Procurement Analytics Tools And Strategies Sources To Collect Procurement Data Guidelines PDF
This slide covers sources of data for extraction such as suppliers provided data, transactional data, tactical data excel and SharePoint, third party proprietary data etc.Deliver and pitch your topic in the best possible manner with this Procurement Analytics Tools And Strategies Sources To Collect Procurement Data Guidelines PDF. Use them to share invaluable insights on Internal Data, External Data, Business Proprietary and impress your audience. This template can be altered and modified as per your expectations. So, grab it now.
Human Mind Of Thinking Data Analytics Strategy Ppt PowerPoint Presentation Summary Graphics Download PDF
Persuade your audience using this human mind of thinking data analytics strategy ppt powerpoint presentation summary graphics download pdf. This PPT design covers three stages, thus making it a great tool to use. It also caters to a variety of topics including human mind of thinking data analytics strategy. Download this PPT design now to present a convincing pitch that not only emphasizes the topic but also showcases your presentation skills.

Designing Great Client Experience Action Plan Customer Experience Design Roadmap Ppt Outline Summary PDF
Lay out all the measures for improved customer experience CX with a timeline to keep a track of the progress and implementation. Deliver an awe-inspiring pitch with this creative designing great client experience action plan customer experience design roadmap ppt outline summary pdf bundle. Topics like mobile, business intelligent, web analytics, content management system, user experience, information architecture, search can be discussed with this completely editable template. It is available for immediate download depending on the needs and requirements of the user.
Training Goals For Data Preparation And Storage Ppt PowerPoint Presentation Icon PDF
Showcasing this set of slides titled training goals for data preparation and storage ppt powerpoint presentation icon pdf. The topics addressed in these templates are kpis and targets, the date revolution, modelling, data preparation and storage, analytics tools, hypothesis driven thinking. All the content presented in this PPT design is completely editable. Download it and make adjustments in color, background, font etc. as per your unique business setting.

Customer Experience Design Roadmap Ppt Professional Icons PDF
Lay out all the measures for improved customer experience CX with a timeline to keep a track of the progress and implementation.Deliver an awe-inspiring pitch with this creative customer experience design roadmap ppt professional icons pdf. bundle. Topics like business intelligent and web analytics, content management, system user experience can be discussed with this completely editable template. It is available for immediate download depending on the needs and requirements of the user.

Storage Logistics Optimizing Key Functional Areas Of Warehouse Contd Download PDF
The slide demonstrates information regarding optimization of key functional areas of warehouse such as order picking and packing, real time operations and resource management. Deliver an awe inspiring pitch with this creative storage logistics optimizing key functional areas of warehouse contd download pdf bundle. Topics like order picking and packing, management, business intelligence and analytics can be discussed with this completely editable template. It is available for immediate download depending on the needs and requirements of the user.
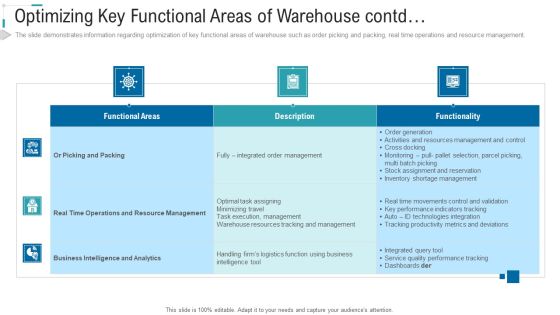
Inventory Stock Control Optimizing Key Functional Areas Of Warehouse Contd Ppt Gallery Portfolio PDF
The slide demonstrates information regarding optimization of key functional areas of warehouse such as order picking and packing, real time operations and resource management. Deliver and pitch your topic in the best possible manner with this inventory stock control optimizing key functional areas of warehouse contd ppt gallery portfolio pdf. Use them to share invaluable insights on resource, management, business, intelligence, analytics and impress your audience. This template can be altered and modified as per your expectations. So, grab it now.
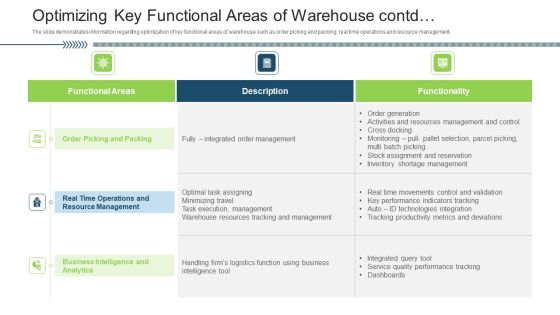
Stock Control System Optimizing Key Functional Areas Of Warehouse Contd Ppt Visual Aids Backgrounds PDF
The slide demonstrates information regarding optimization of key functional areas of warehouse such as order picking and packing, real time operations and resource management. Deliver and pitch your topic in the best possible manner with this stock control system optimizing key functional areas of warehouse contd ppt visual aids backgrounds pdf. Use them to share invaluable insights on resource, management, business, intelligence, analytics and impress your audience. This template can be altered and modified as per your expectations. So, grab it now.

Hoshin Kanri Strategy Schedule With Action Steps Ppt PowerPoint Presentation File Styles PDF
In this slide, we are tabulating the objectives, actionable steps, key deliverables and timeline for the effective strategic planning of the business. Pitch your topic with ease and precision using this hoshin kanri strategy schedule with action steps ppt powerpoint presentation file styles pdf. This layout presents information on organization objective, training, data analytics. It is also available for immediate download and adjustment. So, changes can be made in the color, design, graphics or any other component to create a unique layout.

Traditional Vs Digital Marketing Transformation Method Introduction PDF
This slide signifies the matrix on traditional vs digital marketing transformation. It includes comparison on the basis of customer engagement, data analytics, channels, conversion and promotion. Showcasing this set of slides titled traditional vs digital marketing transformation method introduction pdf. The topics addressed in these templates are customer engagement, traditional marketing, digital marketing. All the content presented in this PPT design is completely editable. Download it and make adjustments in color, background, font etc. as per your unique business setting.

Information Transformation Process Toolkit RACI Matrix For Analyzing Data In Project Portrait PDF
The slide explains the RACI Matrix with the roles on vertical axis and tasks on horizontal axis for executing data analytics project. Deliver an awe inspiring pitch with this creative Information Transformation Process Toolkit RACI Matrix For Analyzing Data In Project Portrait PDF bundle. Topics like Data Preparation, Data Visualization, Business Requirement can be discussed with this completely editable template. It is available for immediate download depending on the needs and requirements of the user.

Information Transformation Process Toolkit RACI Matrix For Data Analyzing Project With Key Responsibilities Introduction PDF
The slide shows the roles and responsibilities of data analytics project by using responsible, accountable, consulted, and informed RACI Matrix. Deliver and pitch your topic in the best possible manner with this Information Transformation Process Toolkit RACI Matrix For Data Analyzing Project With Key Responsibilities Introduction PDF. Use them to share invaluable insights on Business, Data Sources, Data Preparation and impress your audience. This template can be altered and modified as per your expectations. So, grab it now.
 Home
Home