Machine Learning
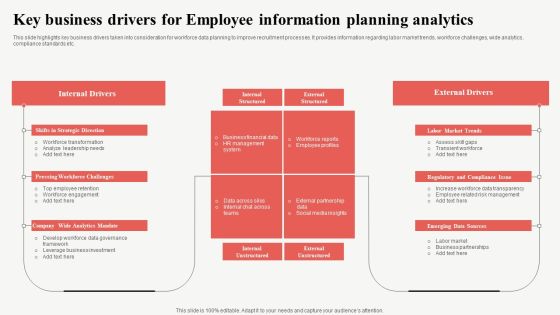
Key Business Drivers For Employee Information Planning Analytics Background PDF
This slide highlights key business drivers taken into consideration for workforce data planning to improve recruitment processes. It provides information regarding labor market trends, workforce challenges, wide analytics, compliance standards etc. Showcasing this set of slides titled Key Business Drivers For Employee Information Planning Analytics Background PDF. The topics addressed in these templates are Internal Drivers, External Drivers, Market Trends. All the content presented in this PPT design is completely editable. Download it and make adjustments in color, background, font etc. as per your unique business setting.

Data Collection Processing And Analysis Ppt PowerPoint Presentation Pictures Infographics
This is a data collection processing and analysis ppt powerpoint presentation pictures infographics. This is a five stage process. The stages in this process are data flow, data management, big data.

Integrated Quality Analytical Chemistry Ppt Slides
This is a integrated quality analytical chemistry ppt slides. This is a four stage process. The stages in this process are integrated quality, pharmaceutical manufacturing, process design, regulatory restructuring.

Business Analytics Ppt PowerPoint Presentation Complete Deck With Slides
Presenting this set of slides with name business analytics ppt powerpoint presentation complete deck with slides. The topics discussed in these slides are marketing, business, management, planning, strategy. This is a completely editable PowerPoint presentation and is available for immediate download. Download now and impress your audience.
Icons Slide For Developing Business Analytics Framework Clipart PDF
Introducing our well designed Icons Slide For Developing Business Analytics Framework Clipart PDF set of slides. The slide displays editable icons to enhance your visual presentation. The icons can be edited easily. So customize according to your business to achieve a creative edge. Download and share it with your audience.

Business Revenue And Client Retention Analytics Dashboard Brochure PDF
This slide shows dashboard of service department of firm to make business decisions using customer analytics and covers essential KPIs of customer. It includes request answered, revenue, support cost, customer satisfaction and retention, average time to solve issue. Showcasing this set of slides titled Business Revenue And Client Retention Analytics Dashboard Brochure PDF. The topics addressed in these templates are Customer Satisfaction, Customer Retention, Revenue. All the content presented in this PPT design is completely editable. Download it and make adjustments in color, background, font etc. as per your unique business setting.

Oracle Analytics Cloud Application Roles Background PDF
This slide represents the oracle analytics aloud application roles. It includes BI service administrator, BI data model author, BI content writer, BI data load, DV content writer, and DV consumer. Deliver an awe inspiring pitch with this creative oracle analytics cloud application roles background pdf bundle. Topics like administrator, content, communicate, dashboards, visualizations can be discussed with this completely editable template. It is available for immediate download depending on the needs and requirements of the user.

Online Marketing Analytics Performance Report Microsoft PDF
This slide shows the digital marketing analytics performance report such as social media, blog and public relation performance with website health.Pitch your topic with ease and precision using this Online Marketing Analytics Performance Report Microsoft PDF This layout presents information on Blog Performance, Media Performance, Effective Engagement It is also available for immediate download and adjustment. So, changes can be made in the color, design, graphics or any other component to create a unique layout.

Half Yearly Data Analytics Implementation Roadmap Demonstration
We present our half yearly data analytics implementation roadmap demonstration. This PowerPoint layout is easy-to-edit so you can change the font size, font type, color, and shape conveniently. In addition to this, the PowerPoint layout is Google Slides compatible, so you can share it with your audience and give them access to edit it. Therefore, download and save this well-researched half yearly data analytics implementation roadmap demonstration in different formats like PDF, PNG, and JPG to smoothly execute your business plan.

Six Step Data Analytic Strategy For Business Transformation Download PDF
This slide covers role of data analytics in six steps for transformation of business. It includes acquire customers, transform financial process, create business models, optimize operations, manage risks and maximise insights. Persuade your audience using this Six Step Data Analytic Strategy For Business Transformation Download PDF. This PPT design covers six stages, thus making it a great tool to use. It also caters to a variety of topics including Transform Financial Process, Acquire Customers, Create Business Models. Download this PPT design now to present a convincing pitch that not only emphasizes the topic but also showcases your presentation skills.

Business Analytics Icons Slide Technology Ppt PowerPoint Presentation Styles Outfit
Presenting this set of slides with name business analytics icons slide technology ppt powerpoint presentation styles outfit. The topics discussed in these slides are marketing, business, management, planning, strategy. This is a completely editable PowerPoint presentation and is available for immediate download. Download now and impress your audience.

Centralized Data Analytics Team Structure Clipart PDF
This slide shows the model representing the structure of the centralized data analytics team. It includes key stakeholders such as vice president, centralized data analytics team, and analysts of units A,B and C.Persuade your audience using this Centralized Data Analytics Team Structure Clipart PDF. This PPT design coversone stage, thus making it a great tool to use. It also caters to a variety of topics including Vice President, Data Analytics, Analytics Team. Download this PPT design now to present a convincing pitch that not only emphasizes the topic but also showcases your presentation skills.
Four Text Icons For Environmental Safety And Green Energy Ppt Slides Graphics
Energy generation with windmill and solar plant can be displayed with icon slide. This icon template relates to the concept of environment safety and energy production. We have used graphic icons of green tower, leafs and factory to display the concept in visual manner.

Website Analytics Dashboard To Track Business Performance Guidelines PDF
This slide exhibits visual report to track web performance metrics such as bounce rates, conversion rate, etc. It focuses on visualizing how effectively any website is converting traffic. It involves information related to number of users, page visitors, etc. Pitch your topic with ease and precision using this Website Analytics Dashboard To Track Business Performance Guidelines PDF. This layout presents information on Website Analytics, Dashboard To Track, Business Performance. It is also available for immediate download and adjustment. So, changes can be made in the color, design, graphics or any other component to create a unique layout.

Procurement Data Analytics And Business Intelligence Dashboard Pictures PDF
This slide showcases BI dashboard to help company in real time tracking of procurement KPIs. It includes information such as defect rate, supplier availability, lead time, etc. Pitch your topic with ease and precision using this Procurement Data Analytics And Business Intelligence Dashboard Pictures PDF. This layout presents information on Procurement Data Analytics, Business Intelligence Dashboard. It is also available for immediate download and adjustment. So, changes can be made in the color, design, graphics or any other component to create a unique layout.

Analytical Planning Process Business Ppt PowerPoint Presentation Complete Deck
Presenting this set of slides with name analytical planning process business ppt powerpoint presentation complete deck. The topics discussed in these slides are strategic, entrepreneurs, objective, process, business. This is a completely editable PowerPoint presentation and is available for immediate download. Download now and impress your audience.

Five Data Analytics Plan To Boost Healthcare Business Formats PDF
Showcasing this set of slides titled Five Data Analytics Plan To Boost Healthcare Business Formats PDF. The topics addressed in these templates are Shareholders Involvement, Data Security, Data Culture. All the content presented in this PPT design is completely editable. Download it and make adjustments in color, background, font etc. as per your unique business setting.

Key Business Benefits Of The Oracle Analytics Cloud Download PDF
This slide represents the key business benefits of the Oracle Analytics Cloud, and it includes reduced cost, scalable needs, accurate analysis, reduced time and efforts, and proactive analysis available on the phone. This is a key business benefits of the oracle analytics cloud download pdf template with various stages. Focus and dispense information on seven stages using this creative set, that comes with editable features. It contains large content boxes to add your information on topics like cost, ownership, business, capabilities. You can also showcase facts, figures, and other relevant content using this PPT layout. Grab it now.

Streamlining Manufacturing Processes With Workflow Automation Method To Estimate Organization Workflow Efficiency Formats PDF
This slide illustrates the method to calculate organizational workflow efficiency and provide the current workflow efficiency of organization. It includes total cycle time, value added time, wasted activity time etc. This modern and well-arranged Mike santos, Henry Nicholas, Yasir Mohamad, Donald young provides lots of creative possibilities. It is very simple to customize and edit with the Powerpoint Software. Just drag and drop your pictures into the shapes. All facets of this template can be edited with Powerpoint no extra software is necessary. Add your own material, put your images in the places assigned for them, adjust the colors, and then you can show your slides to the world, with an animated slide included.

Web Analytical Model In Business Operations Graphics PDF
Persuade your audience using this web analytical model in business operations graphics pdf. This PPT design covers four stages, thus making it a great tool to use. It also caters to a variety of topics including business, sufficiency, data insights. Download this PPT design now to present a convincing pitch that not only emphasizes the topic but also showcases your presentation skills.

Business Analytics Solution Dashboard Ppt PowerPoint Presentation File Clipart PDF
Presenting this set of slides with name business analytics solution dashboard ppt powerpoint presentation file clipart pdf. The topics discussed in these slides are aesthetic, navigation, searchability. This is a completely editable PowerPoint presentation and is available for immediate download. Download now and impress your audience.

Four Vs Of Business Analytics Ppt PowerPoint Presentation Layouts Rules
Presenting this set of slides with name four vs of business analytics ppt powerpoint presentation layouts rules. This is a four stage process. The stages in this process are volume, variety, velocity, value. This is a completely editable PowerPoint presentation and is available for immediate download. Download now and impress your audience.
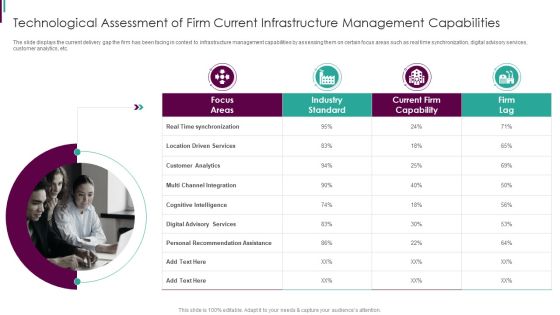
Developing Business Analytics Framework Technological Assessment Infographics PDF
The slide displays the current delivery gap the firm has been facing in context to infrastructure management capabilities by assessing them on certain focus areas such as real time synchronization, digital advisory services, customer analytics, etc.This is a Developing Business Analytics Framework Technological Assessment Infographics PDF template with various stages. Focus and dispense information on four stages using this creative set, that comes with editable features. It contains large content boxes to add your information on topics like Industry Standard, Current Capability, Recommendation You can also showcase facts, figures, and other relevant content using this PPT layout. Grab it now.

Data Analytics Impact On Business Marketing Plan Mockup PDF
This slide covers benefits of data analytics tool for building effective marketing strategies. It includes decision making, improvement in marketing, improved customer service and smooth operation. Presenting Data Analytics Impact On Business Marketing Plan Mockup PDF to dispense important information. This template comprises four stages. It also presents valuable insights into the topics including Decision Making, Improvement In Marketing, Improved Customer Service. This is a completely customizable PowerPoint theme that can be put to use immediately. So, download it and address the topic impactfully.

Pureprofile Business Overview Analytics Services Ppt Pictures Graphics PDF
The following slide highlights the reporting and analytics services offered by Pureprofile. It provides advanced data cleaning, data weighting, RIM weighting and verbatim coding. This is a Pureprofile Business Overview Analytics Services Ppt Pictures Graphics PDF template with various stages. Focus and dispense information on four stages using this creative set, that comes with editable features. It contains large content boxes to add your information on topics like Advanced Data Cleaning, Data Weighting, RIM Weighting. You can also showcase facts, figures, and other relevant content using this PPT layout. Grab it now.

Data Analytics Program Checklist Business Analysis Modification Toolkit Introduction PDF
This slide shows progress status of data analytics process which includes important key tasks that must be performed while initiating a project.This is a Data Analytics Program Checklist Business Analysis Modification Toolkit Introduction PDF template with various stages. Focus and dispense information on one stage using this creative set, that comes with editable features. It contains large content boxes to add your information on topics like Data Visualization, Data Modelling, Statistical Analysis. You can also showcase facts, figures, and other relevant content using this PPT layout. Grab it now.

Business Analytics And Statistical Science Five Year Roadmap Rules
We present our business analytics and statistical science five year roadmap rules. This PowerPoint layout is easy to edit so you can change the font size, font type, color, and shape conveniently. In addition to this, the PowerPoint layout is Google Slides compatible, so you can share it with your audience and give them access to edit it. Therefore, download and save this well researched business analytics and statistical science five year roadmap rules in different formats like PDF, PNG, and JPG to smoothly execute your business plan.
Thank You Business Analytics Ppt PowerPoint Presentation Infographic Template Icons
Presenting this set of slides with name thank you business analytics ppt powerpoint presentation infographic template icons. This is a one stage process. The stages in this process are thank you. This is a completely editable PowerPoint presentation and is available for immediate download. Download now and impress your audience.
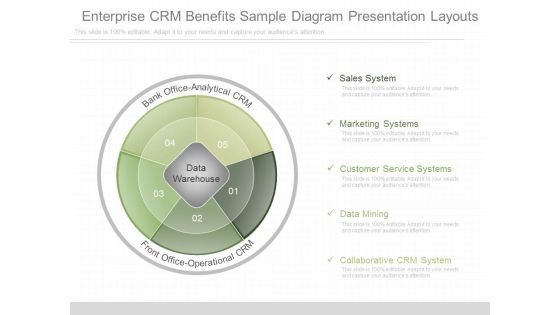
Enterprise Crm Benefits Sample Diagram Presentation Layouts
This is a e enterprise crm benefits sample diagram presentation layouts. This is a five stage process. The stages in this process are sales system, marketing systems, customer service systems, data mining, collaborative crm system, bank office analytical crm, front office operational crm, data warehouse.\n\n\n\n

Crm Operational Illustration Ppt Sample
This is a crm operational illustration ppt sample. This is a six stage process. The stages in this process are customer service systems, marketing systems, sales systems, collaborative crm system, data mining, data warehouse, front office operational crm, back office analytical crm.
Internet Data Storage Vector Icon Ppt Powerpoint Presentation Outline Backgrounds
This is a internet data storage vector icon ppt powerpoint presentation outline backgrounds. The topics discussed in this diagram are data management icon, big data icon. This is a completely editable PowerPoint presentation, and is available for immediate download.

CRM Analytics Regional Growth Rate Diagrams PDF
This slide provides the glimpse of the customer relationship management analytics regional growth rate from 2020 to 2025.This is a crm analytics regional growth rate diagrams pdf template with various stages. Focus and dispense information on three stages using this creative set, that comes with editable features. It contains large content boxes to add your information on topics like crm analytics regional growth rate. You can also showcase facts, figures, and other relevant content using this PPT layout. Grab it now.

Oracle Analytics Cloud Professional Edition Graphics PDF
This slide defines the collaboration and publishing cloud solution of Oracle Analytics and how it encourages teamwork in the organizations. Presenting oracle analytics cloud professional edition graphics pdf to provide visual cues and insights. Share and navigate important information on seven stages that need your due attention. This template can be used to pitch topics like oracle analytics cloud solutions collaboration and publishing. In addtion, this PPT design contains high resolution images, graphics, etc, that are easily editable and available for immediate download.

Analytical Incrementalism Business Performance Measurement Metrics Sales Infographics PDF
The purpose of this slide is to provide a glimpse about the business marketing performance measurement metrics after logical incrementalism approach. Deliver an awe-inspiring pitch with this creative analytical incrementalism business performance measurement metrics sales infographics pdf bundle. Topics like gross profit margin, revenue, quick ratio can be discussed with this completely editable template. It is available for immediate download depending on the needs and requirements of the user.

Analytical Incrementalism Business Performance Measurement Metrics Download PDF
The purpose of this slide is to provide a glimpse about the business marketing performance measurement metrics after logical incrementalism approach. Deliver an awe-inspiring pitch with this creative analytical incrementalism business performance measurement metrics download pdf bundle. Topics like sales revenue, new customer, sales growth, sales region performance, profit can be discussed with this completely editable template. It is available for immediate download depending on the needs and requirements of the user.

Human Resource Analytics Business Intelligence Hybrid Architecture Framework Elements PDF
This slide represents the hybrid architecture including both technologies of data mart and OLAP cubes. It includes key recommendations such as implementation of data marts as part of data security for data aggregation etc. Get a simple yet stunning designed Human Resource Analytics Business Intelligence Hybrid Architecture Framework Elements PDF. It is the best one to establish the tone in your meetings. It is an excellent way to make your presentations highly effective. So, download this PPT today from Slidegeeks and see the positive impacts. Our easy-to-edit Human Resource Analytics Business Intelligence Hybrid Architecture Framework Elements PDF can be your go-to option for all upcoming conferences and meetings. So, what are you waiting for Grab this template today.

Data Lake Architecture Future Of Data Analysis Introduction To Data Lake File Storage System Template PDF
This slide represents the data lake file storage system based on big datas five Vs such as volume, velocity, value, veracity and variety, and benefits of using this file storage system.This is a Data Lake Architecture Future Of Data Analysis Introduction To Data Lake File Storage System Template PDF template with various stages. Focus and dispense information on five stages using this creative set, that comes with editable features. It contains large content boxes to add your information on topics like Trustworthiness Authenticity, Availability Accountability, Unstructured Probabilistic. You can also showcase facts, figures, and other relevant content using this PPT layout. Grab it now.

Sales Analytics Ppt Layout Presentation Images
This is a sales analytics ppt layout presentation images. This is a five stage process. The stages in this process are sales reporting, sales portals, engine, reporter, pathfinder.

Digital Marketing Analytics Diagram Ppt Summary
This is a digital marketing analytics diagram ppt summary. This is a four stage process. The stages in this process are content strategy, usability, engineering, architecture, strategy.

Marketing Management Analytics Diagram Ppt Background Graphics
This is a marketing management analytics diagram ppt background graphics. This is a five stage process. The stages in this process are product, price, place, targeting, positioning.
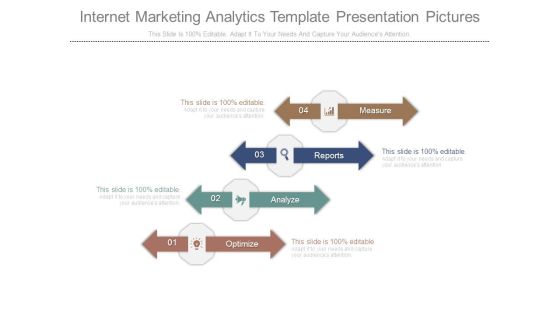
Internet Marketing Analytics Template Presentation Pictures
This is a internet marketing analytics template presentation pictures. This is a four stage process. The stages in this process are measure, reports, analyze, optimize.
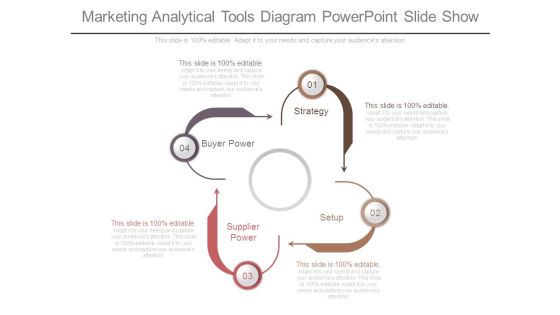
Marketing Analytical Tools Diagram Powerpoint Slide Show
This is a marketing analytical tools diagram powerpoint slide show. This is a four stage process. The stages in this process are buyer power, strategy, supplier power, setup.

Advanced Analytics Techniques Template Powerpoint Slides
This is a advanced analytics techniques template powerpoint slides. This is a six stage process. The stages in this process are reporting, strategy, collection, knowledge, information, data.

Analytical Access Example Sample Presentation Ppt
This is a analytical access example sample presentation ppt. This is a four stage process. The stages in this process are hypothesis, collect facts, optimize, measure.
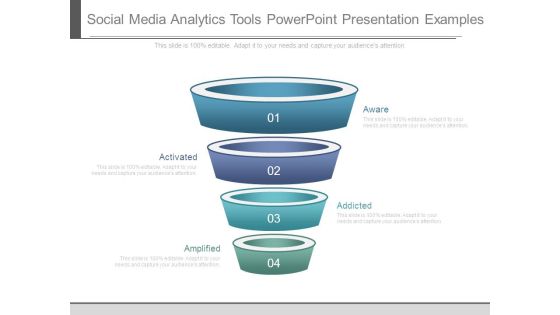
Social Media Analytics Tools Powerpoint Presentation Examples
This is a social media analytics tools powerpoint presentation examples. This is a four stage process. The stages in this process are activated, amplified, aware, addicted.

Data Driven Analytics Chart Powerpoint Presentation Templates
This is a data driven analytics chart powerpoint presentation templates. This is a five stage process. The stages in this process are category.

Technology Procedure For Business Improvement Brochure PDF
This slide presents various steps of technology design process to acquire automation in business. It includes key steps such as vision, program, specify requirement, life cycle implications and engagement with partners. Presenting Technology Procedure For Business Improvement Brochure PDF to dispense important information. This template comprises five stages. It also presents valuable insights into the topics including Vision, Program, Engagement With Partners. This is a completely customizable PowerPoint theme that can be put to use immediately. So, download it and address the topic impactfully.

Technology Licensing Operation Process Framework Summary PDF
This slide highlights a framework of operating process to acquire technology licenses to install automation in business. It include key steps such as make request, preliminary consultation, rights negotiation, authorized amount, contract signing and approving contract. Persuade your audience using this Technology Licensing Operation Process Framework Summary PDF. This PPT design covers six stages, thus making it a great tool to use. It also caters to a variety of topics including Rights Negotiation, Contract Signing, Preliminary Consultation. Download this PPT design now to present a convincing pitch that not only emphasizes the topic but also showcases your presentation skills.

Retail Analytics Example Powerpoint Presentation Templates
This is a retail analytics example powerpoint presentation templates. This is a five stage process. The stages in this process are production, shipping, stores, analyzing and forecasting, re orders.
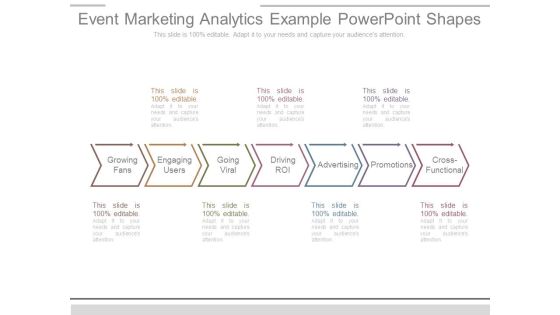
Event Marketing Analytics Example Powerpoint Shapes
This is a event marketing analytics example powerpoint shapes. This is a seven stage process. The stages in this process are growing fans, engaging users, going viral, driving roi, advertising, promotions, cross functional.

Sample Of Internet Analytics Template Powerpoint Themes
This is a sample of internet analytics template powerpoint themes. This is a six stage process. The stages in this process are improve or eliminate, analyze, action, define, measure, reinforce clarity.
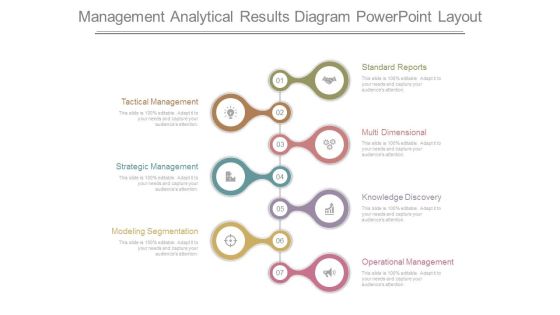
Management Analytical Results Diagram Powerpoint Layout
This is a management analytical results diagram powerpoint layout. This is a seven stage process. The stages in this process are standard reports, multi dimensional, knowledge discovery, operational management, modeling segmentation, strategic management, tactical management.

Customer Experience Analytics Example Ppt Infographic Template
This is a customer experience analytics example ppt infographic template. This is a six stage process. The stages in this process are resource fluidity, measurement, priorities, process, leadership edge, enterprise culture.
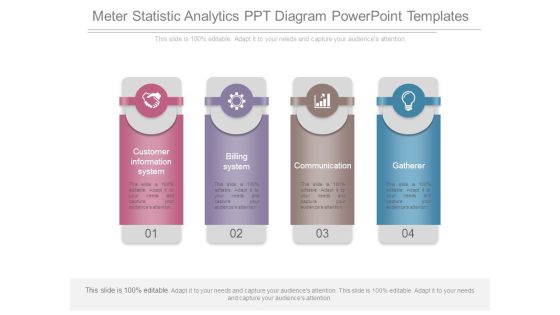
Meter Statistic Analytics Ppt Diagram Powerpoint Templates
This is a meter statistic analytics ppt diagram powerpoint templates. This is a four stage process. The stages in this process are customer information system, billing system, communication, gatherer.

Closed Loop Analytics Layout Powerpoint Slide Designs
This is a closed loop analytics layout powerpoint slide designs. This is a seven stage process. The stages in this process are results, action, decide, track, analysis, model, adjust act.

Marketing Analytics Ppt Template Powerpoint Slide Introduction
This is a marketing analytics ppt template powerpoint slide introduction. This is a six stage process. The stages in this process are reporting intelligence, acquisition, development, pricing strategy, product design, other solution.

Web Analytics Diagram Ppt Slides Themes
This is a web analytics diagram ppt slides themes. This is a three stage process. The stages in this process are build, analyse, measure, test alternatives, optimise, collect data, define goals, report, implement.
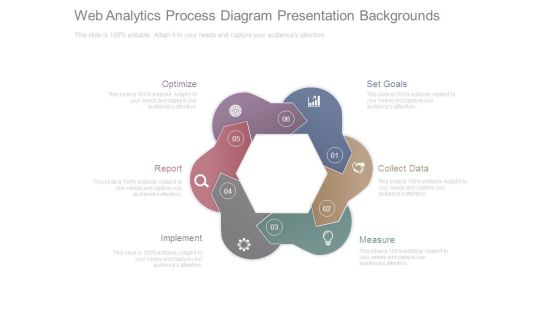
Web Analytics Process Diagram Presentation Backgrounds
This is a web analytics process diagram presentation backgrounds. This is a six stage process. The stages in this process are optimize, report, implement, measure, collect data, set goals.
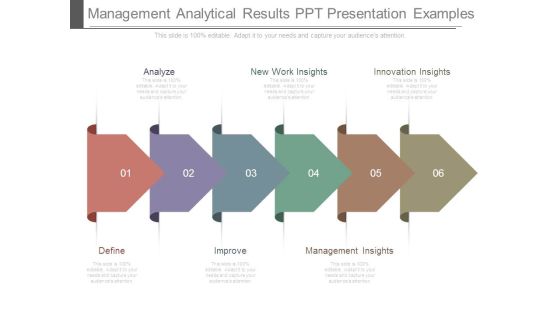
Management Analytical Results Ppt Presentation Examples
This is a management analytical results ppt presentation examples. This is a six stage process. The stages in this process are define, improve, management insights, innovation insights, new work insights, analyze.

Customized Analytical Support Diagram Powerpoint Presentation Examples
This is a customized analytical support diagram powerpoint presentation examples. This is a four stage process. The stages in this process are scope and define the problem, data gathering and investigation, develop options, recommendation report.
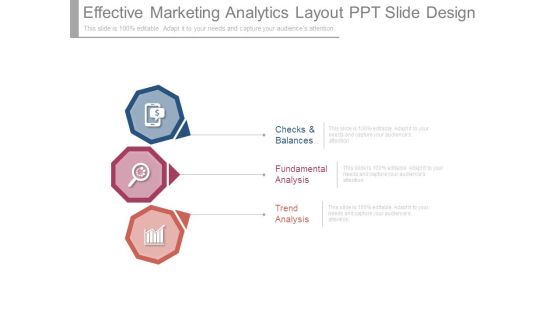
Effective Marketing Analytics Layout Ppt Slide Design
This is a effective marketing analytics layout ppt slide design. This is a three stage process. The stages in this process are checks and balances, fundamental analysis, trend analysis.

Analytical Modeling Template Powerpoint Slide Ideas
This is a analytical modeling template powerpoint slide ideas. This is a six stage process. The stages in this process are identify nodes, insight creation, data preparation, model lifecycle, operationalization, proof of value.
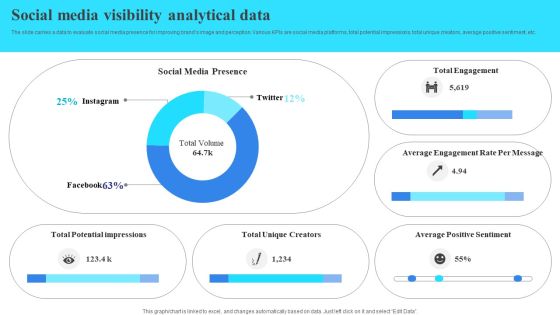
Social Media Visibility Analytical Data Inspiration PDF
The slide carries a data to evaluate social media presence for improving brands image and perception. Various KPIs are social media platforms, total potential impressions, total unique creators, average positive sentiment, etc. Showcasing this set of slides titled Social Media Visibility Analytical Data Inspiration PDF. The topics addressed in these templates are Presence, Creators, Total Engagement. All the content presented in this PPT design is completely editable. Download it and make adjustments in color, background, font etc. as per your unique business setting.

Business Analytics Application Employee Engagement Key Performance Metrics Icons PDF
This slide represents key metrics dashboard to analyze the engagement of employees in the organization. It includes details related to KPIs such as engagement score, response rate, net promoter score etc. Formulating a presentation can take up a lot of effort and time, so the content and message should always be the primary focus. The visuals of the PowerPoint can enhance the presenters message, so our Business Analytics Application Employee Engagement Key Performance Metrics Icons PDF was created to help save time. Instead of worrying about the design, the presenter can concentrate on the message while our designers work on creating the ideal templates for whatever situation is needed. Slidegeeks has experts for everything from amazing designs to valuable content, we have put everything into Business Analytics Application Employee Engagement Key Performance Metrics Icons PDF.

Testing Computerized Framework Of Application Functions Introduction PDF
This slide shows the testing automation architecture of graphical user interface which includes different layers such as test scripts, functional libraries, user interface maps, automation tools with framework utilities. Pitch your topic with ease and precision using this testing computerized framework of application functions introduction pdf. This layout presents information on automation tool, functional libraries, service. It is also available for immediate download and adjustment. So, changes can be made in the color, design, graphics or any other component to create a unique layout.

Impact Of Website Analytics On Business Firms Ideas PDF
The following slide exhibits benefits of collecting and analysing online data. It focuses on providing insights used to create better user experience for site visitors. It covers elements such as target audience, tracking business goals, etc. Showcasing this set of slides titled Impact Of Website Analytics On Business Firms Ideas PDF. The topics addressed in these templates are Business Goals, Employee Motivation, Website Efficiency, Website Optimization, Online Site Traffic. All the content presented in this PPT design is completely editable. Download it and make adjustments in color, background, font etc. as per your unique business setting.

CRM Analytical CRM Ppt Infographics Icon PDF
This is a crm analytical crm ppt infographics icon pdf template with various stages. Focus and dispense information on TWO stages using this creative set, that comes with editable features. It contains large content boxes to add your information on topics like analytical crm. You can also showcase facts, figures, and other relevant content using this PPT layout. Grab it now.

CRM Analytics Regional Growth Rate Download PDF
This is a crm analytics regional growth rate download pdf template with various stages. Focus and dispense information on three stages using this creative set, that comes with editable features. It contains large content boxes to add your information on topics like crm analytics regional growth rate. You can also showcase facts, figures, and other relevant content using this PPT layout. Grab it now.

Manpower Performance Analytics Dashboard Icon Designs PDF
Persuade your audience using this Manpower Performance Analytics Dashboard Icon Designs PDF. This PPT design covers four stages, thus making it a great tool to use. It also caters to a variety of topics including Manpower Performance, Analytics Dashboard, Icon. Download this PPT design now to present a convincing pitch that not only emphasizes the topic but also showcases your presentation skills.
Personnel Salary Analytics Dashboard Icon Elements PDF
Persuade your audience using this Personnel Salary Analytics Dashboard Icon Elements PDF. This PPT design covers three stages, thus making it a great tool to use. It also caters to a variety of topics including Dashboard Icon, Personnel Salary Analytics. Download this PPT design now to present a convincing pitch that not only emphasizes the topic but also showcases your presentation skills.

Working Capital Growth Analytics Icon Elements PDF
Presenting Working Capital Growth Analytics Icon Elements PDF to dispense important information. This template comprises three stages. It also presents valuable insights into the topics including Working Capital, Growth, Analytics This is a completely customizable PowerPoint theme that can be put to use immediately. So, download it and address the topic impactfully.

Working Capital Investment Analytics Icon Summary PDF
Persuade your audience using this Working Capital Investment Analytics Icon Summary PDF. This PPT design covers three stages, thus making it a great tool to use. It also caters to a variety of topics including Working Capital, Investment, Analytics. Download this PPT design now to present a convincing pitch that not only emphasizes the topic but also showcases your presentation skills.
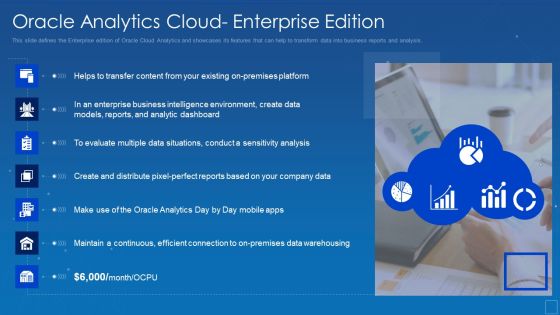
Oracle Analytics Cloud Enterprise Edition Download PDF
This slide defines the Enterprise edition of Oracle Cloud Analytics and showcases its features that can help to transform data into business reports and analysis. This is a oracle analytics cloud enterprise edition download pdf template with various stages. Focus and dispense information on six stages using this creative set, that comes with editable features. It contains large content boxes to add your information on topics like content, on premises, platform, environment, intelligence, dashboard. You can also showcase facts, figures, and other relevant content using this PPT layout. Grab it now.
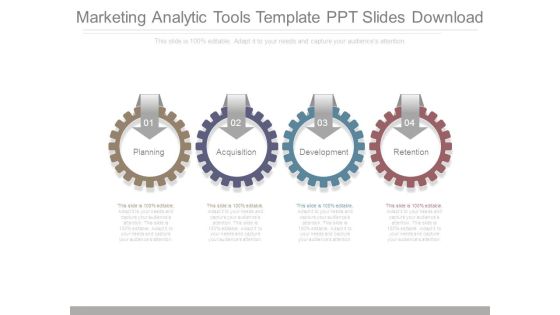
Marketing Analytic Tools Template Ppt Slides Download
This is a marketing analytic tools template ppt slides download. This is a four stage process. The stages in this process are planning, acquisition, development, retention.

Analytics Of Working Capital In Startup Business Topics PDF
This slide showcases an analysis of venture capital in startups to take the enterprise to the next level of development. It also includes business accelerator steps, requesting for funding , pitch deck presentation, etc. Presenting Analytics Of Working Capital In Startup Business Topics PDF to dispense important information. This template comprises four stages. It also presents valuable insights into the topics including Business Accelerator, Deck Presentation, Scrutinize Term Sheet This is a completely customizable PowerPoint theme that can be put to use immediately. So, download it and address the topic impactfully.
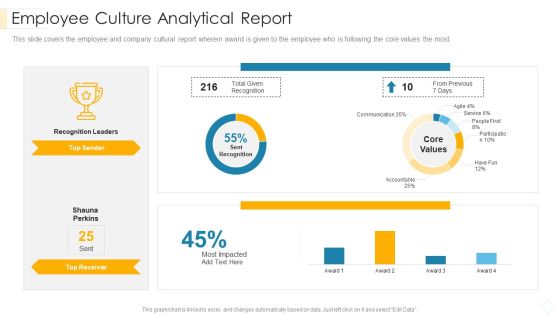
Employee Culture Analytical Report Inspiration PDF
This slide covers the employee and company cultural report wherein award is given to the employee who is following the core values the most.Deliver an awe inspiring pitch with this creative employee culture analytical report inspiration pdf bundle. Topics like recognition leaders, total given recognition, most impacted can be discussed with this completely editable template. It is available for immediate download depending on the needs and requirements of the user.

Healthcare Platform Analytics Infrastructure Framework Background PDF
This slide includes the healthcare ecosystem consisting of products and front-end and back-end services. It includes key institutions, resources, actor networks, and deliver mechanisms. Pitch your topic with ease and precision using this Healthcare Platform Analytics Infrastructure Framework Background PDF. This layout presents information on Government Regulations, Quality Control Guidelines, Data Cyber Security, Competitors Hospital. It is also available for immediate download and adjustment. So, changes can be made in the color, design, graphics or any other component to create a unique layout.

Digital Marketing Analytics Infrastructure Framework Elements PDF
This slide includes the digital marketing ecosystem with an analysis and measurement tools that allows the organization to create a digital campaign and improve brand position in the market. It includes key activities, content, and measurement and analysis. Showcasing this set of slides titled Digital Marketing Analytics Infrastructure Framework Elements PDF. The topics addressed in these templates are Key Activities, Content, Measurement And Analysis. All the content presented in this PPT design is completely editable. Download it and make adjustments in color, background, font etc. as per your unique business setting.

Client Health Score Analytical Dashboard Rules PDF
This slide gives an overview of customer health score in an organization along with net promoter score for users at various locations. It includes elements such as total customers, total monthly recurring revenue, average net promoter score etc. Showcasing this set of slides titled Client Health Score Analytical Dashboard Rules PDF. The topics addressed in these templates are Average Net Promoter, Average Customer Health, Healthy. All the content presented in this PPT design is completely editable. Download it and make adjustments in color, background, font etc. as per your unique business setting.

Creating Transaction Monitoring TMS And Data Analytics Process Flow Elements PDF
This slide represents transaction monitoring system process flow. It provides information about data analytics, risk framework, alerting, ad hoc analysis, case management, external source entrance, stop list, politically exposed persons PEP, watch list, etc. Create an editable Creating Transaction Monitoring TMS And Data Analytics Process Flow Elements PDF that communicates your idea and engages your audience. Whether youre presenting a business or an educational presentation, pre-designed presentation templates help save time. Creating Transaction Monitoring TMS And Data Analytics Process Flow Elements PDF is highly customizable and very easy to edit, covering many different styles from creative to business presentations. Slidegeeks has creative team members who have crafted amazing templates. So, go and get them without any delay.

Five Years Business Analytics Analyst Career Roadmap With Salary Summary
Presenting our innovatively-structured five years business analytics analyst career roadmap with salary summary Template. Showcase your roadmap process in different formats like PDF, PNG, and JPG by clicking the download button below. This PPT design is available in both Standard Screen and Widescreen aspect ratios. It can also be easily personalized and presented with modified font size, font type, color, and shapes to measure your progress in a clear way.

Five Years Business Analytics Career Roadmap With Skills Background
Introducing our five years business analytics career roadmap with skills background. This PPT presentation is Google Slides compatible, therefore, you can share it easily with the collaborators for measuring the progress. Also, the presentation is available in both standard screen and widescreen aspect ratios. So edit the template design by modifying the font size, font type, color, and shapes as per your requirements. As this PPT design is fully editable it can be presented in PDF, JPG and PNG formats.
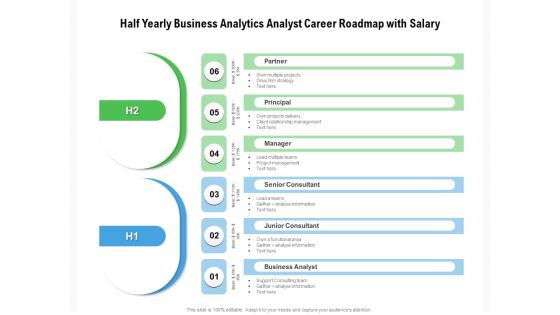
Half Yearly Business Analytics Analyst Career Roadmap With Salary Elements
Presenting our innovatively-structured half yearly business analytics analyst career roadmap with salary elements Template. Showcase your roadmap process in different formats like PDF, PNG, and JPG by clicking the download button below. This PPT design is available in both Standard Screen and Widescreen aspect ratios. It can also be easily personalized and presented with modified font size, font type, color, and shapes to measure your progress in a clear way.

Half Yearly Business Analytics Career Roadmap With Skills Summary
Introducing our half yearly business analytics career roadmap with skills summary. This PPT presentation is Google Slides compatible, therefore, you can share it easily with the collaborators for measuring the progress. Also, the presentation is available in both standard screen and widescreen aspect ratios. So edit the template design by modifying the font size, font type, color, and shapes as per your requirements. As this PPT design is fully editable it can be presented in PDF, JPG and PNG formats.

Quarterly Business Analytics Analyst Career Roadmap With Salary Formats
Presenting our innovatively-structured quarterly business analytics analyst career roadmap with salary formats Template. Showcase your roadmap process in different formats like PDF, PNG, and JPG by clicking the download button below. This PPT design is available in both Standard Screen and Widescreen aspect ratios. It can also be easily personalized and presented with modified font size, font type, color, and shapes to measure your progress in a clear way.

Quarterly Business Analytics Career Roadmap With Skills Themes
Introducing our quarterly business analytics career roadmap with skills themes. This PPT presentation is Google Slides compatible, therefore, you can share it easily with the collaborators for measuring the progress. Also, the presentation is available in both standard screen and widescreen aspect ratios. So edit the template design by modifying the font size, font type, color, and shapes as per your requirements. As this PPT design is fully editable it can be presented in PDF, JPG and PNG formats.
Quarterly Business Analytics Employee Career Roadmap With Salary Range Icons
Presenting our jaw-dropping quarterly business analytics employee career roadmap with salary range icons. You can alternate the color, font size, font type, and shapes of this PPT layout according to your strategic process. This PPT presentation is compatible with Google Slides and is available in both standard screen and widescreen aspect ratios. You can also download this well-researched PowerPoint template design in different formats like PDF, JPG, and PNG. So utilize this visually-appealing design by clicking the download button given below.

Six Months Business Analytics Analyst Career Roadmap With Salary Structure
Presenting our innovatively-structured six months business analytics analyst career roadmap with salary structure Template. Showcase your roadmap process in different formats like PDF, PNG, and JPG by clicking the download button below. This PPT design is available in both Standard Screen and Widescreen aspect ratios. It can also be easily personalized and presented with modified font size, font type, color, and shapes to measure your progress in a clear way.
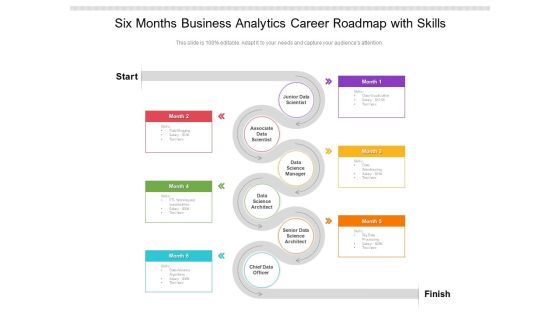
Six Months Business Analytics Career Roadmap With Skills Topics
Introducing our six months business analytics career roadmap with skills topics. This PPT presentation is Google Slides compatible, therefore, you can share it easily with the collaborators for measuring the progress. Also, the presentation is available in both standard screen and widescreen aspect ratios. So edit the template design by modifying the font size, font type, color, and shapes as per your requirements. As this PPT design is fully editable it can be presented in PDF, JPG and PNG formats.
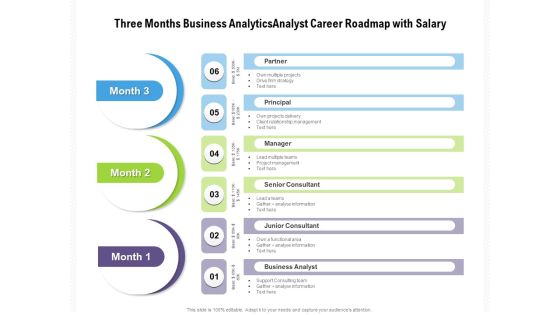
Three Months Business Analytics Analyst Career Roadmap With Salary Pictures
Presenting our innovatively-structured three months business analytics analyst career roadmap with salary pictures Template. Showcase your roadmap process in different formats like PDF, PNG, and JPG by clicking the download button below. This PPT design is available in both Standard Screen and Widescreen aspect ratios. It can also be easily personalized and presented with modified font size, font type, color, and shapes to measure your progress in a clear way.
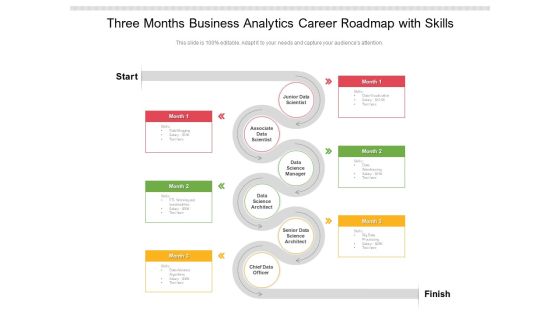
Three Months Business Analytics Career Roadmap With Skills Summary
Introducing our three months business analytics career roadmap with skills summary. This PPT presentation is Google Slides compatible, therefore, you can share it easily with the collaborators for measuring the progress. Also, the presentation is available in both standard screen and widescreen aspect ratios. So edit the template design by modifying the font size, font type, color, and shapes as per your requirements. As this PPT design is fully editable it can be presented in PDF, JPG and PNG formats.

Business Analytics And Statistical Science Half Yearly Roadmap Summary
Presenting our innovatively structured business analytics and statistical science half yearly roadmap summary Template. Showcase your roadmap process in different formats like PDF, PNG, and JPG by clicking the download button below. This PPT design is available in both Standard Screen and Widescreen aspect ratios. It can also be easily personalized and presented with modified font size, font type, color, and shapes to measure your progress in a clear way.

Business Analytics And Statistical Science Quarterly Roadmap Demonstration
Introducing our business analytics and statistical science quarterly roadmap demonstration. This PPT presentation is Google Slides compatible, therefore, you can share it easily with the collaborators for measuring the progress. Also, the presentation is available in both standard screen and widescreen aspect ratios. So edit the template design by modifying the font size, font type, color, and shapes as per your requirements. As this PPT design is fully editable it can be presented in PDF, JPG and PNG formats.

Business Analytics And Statistical Science Three Months Roadmap Demonstration
Presenting our jaw dropping business analytics and statistical science three months roadmap demonstration. You can alternate the color, font size, font type, and shapes of this PPT layout according to your strategic process. This PPT presentation is compatible with Google Slides and is available in both standard screen and widescreen aspect ratios. You can also download this well researched PowerPoint template design in different formats like PDF, JPG, and PNG. So utilize this visually appealing design by clicking the download button given below.

Playbook For Business Intelligence And Data Analytics Implementations Template
Are you tired of boring presentations that fail to captivate your audience Look no further than our Playbook For Business Intelligence And Data Analytics Implementations Template. It is designed to impress and capture attention. With 100 percent editable slides and visually-stunning graphics, you will be able to create presentations that wow. Do not settle for mediocrity, elevate your game with our A4 Playbook PPT Template.

Analytical Incrementalism Various Business Communications Channels Ppt Professional Pictures PDF
The purpose of this slide is to provide a glimpse of various channels of business communication on the basis of organizational structure, direction and way of expression. This is a analytical incrementalism various business communications channels ppt professional pictures pdf template with various stages. Focus and dispense information on six stages using this creative set, that comes with editable features. It contains large content boxes to add your information on topics like meetings, conversations, events, publications, graphics. You can also showcase facts, figures, and other relevant content using this PPT layout. Grab it now.

Analytical Incrementalism Business Resources Required In Our Company Demonstration PDF
The purpose of this slide is to provide a glimpse of business resources such as human, intellectual, financial and physical resources that will impact the sustainability of the organization along with its profitability. This is a analytical incrementalism business resources required in our company demonstration pdf template with various stages. Focus and dispense information on four stages using this creative set, that comes with editable features. It contains large content boxes to add your information on topics like financial resources, human resources, physical resources, intellectual resources. You can also showcase facts, figures, and other relevant content using this PPT layout. Grab it now.

Analytical Incrementalism Various Business Communications Channels Media Structure PDF
The purpose of this slide is to provide a glimpse of various channels of business communication on the basis of organizational structure, direction and way of expression. This is a analytical incrementalism various business communications channels media structure pdf template with various stages. Focus and dispense information on five stages using this creative set, that comes with editable features. It contains large content boxes to add your information on topics like personal communication, mobile communications, electronic communications, broadcast media communications, methods. You can also showcase facts, figures, and other relevant content using this PPT layout. Grab it now.

Developing Business Analytics Framework Determine Overview Of Established Themes PDF
This slide provides information regarding the overview of security center associated with firms business units, management, steering committee, external and internal system. This is a Developing Business Analytics Framework Determine Overview Of Established Themes PDF template with various stages. Focus and dispense information on three stages using this creative set, that comes with editable features. It contains large content boxes to add your information on topics like Command And Control, Incident Response, Threat Intelligence You can also showcase facts, figures, and other relevant content using this PPT layout. Grab it now.
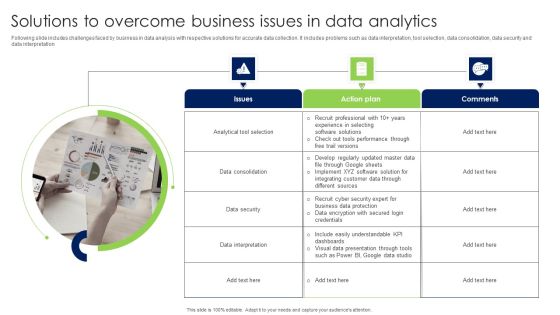
Solutions To Overcome Business Issues In Data Analytics Infographics PDF
Following slide includes challenges faced by business in data analysis with respective solutions for accurate data collection. It includes problems such as data interpretation, tool selection, data consolidation, data security and data interpretation Presenting Solutions To Overcome Business Issues In Data Analytics Infographics PDF to dispense important information. This template comprises Three stages. It also presents valuable insights into the topics including Issues, Action Plan, Comments. This is a completely customizable PowerPoint theme that can be put to use immediately. So, download it and address the topic impactfully.

Business Analytics Application Workforce Performance Analysis KPI Dashboard Template PDF
This slide represents the dashboard representing key metrics to analyze the performance of overall workforce. It includes details related to absence rate, benefits satisfaction, engagement index etc. Take your projects to the next level with our ultimate collection of Business Analytics Application Workforce Performance Analysis KPI Dashboard Template PDF. Slidegeeks has designed a range of layouts that are perfect for representing task or activity duration, keeping track of all your deadlines at a glance. Tailor these designs to your exact needs and give them a truly corporate look with your own brand colors theyll make your projects stand out from the rest.
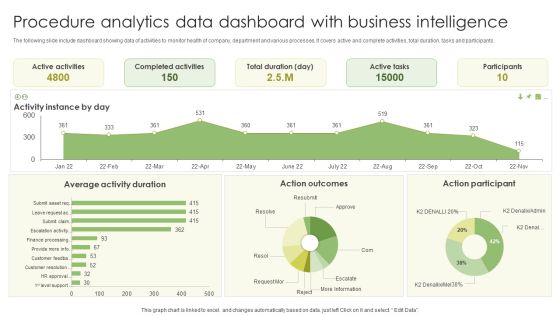
Procedure Analytics Data Dashboard With Business Intelligence Slides PDF
The following slide include dashboard showing data of activities to monitor health of company, department and various processes. It covers active and complete activities, total duration, tasks and participants. Pitch your topic with ease and precision using this Procedure Analytics Data Dashboard With Business Intelligence Slides PDF. This layout presents information on Active Activities, Completed Activities, Active Tasks . It is also available for immediate download and adjustment. So, changes can be made in the color, design, graphics or any other component to create a unique layout.

Business Impact And Large Data Ppt PowerPoint Presentation Example 2015
This is a business impact and large data ppt powerpoint presentation example 2015. This is a six stage process. The stages in this process are sports predictions, easier commutes, smartphones, personalized advertising, presidential campaigns, how is big data.
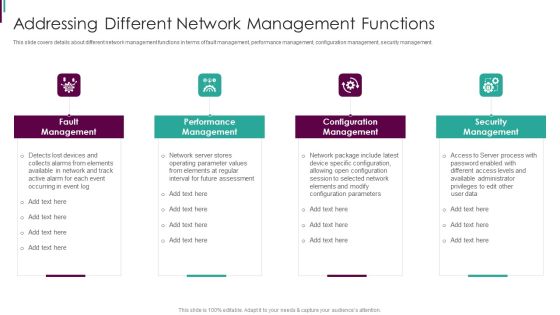
Developing Business Analytics Framework Addressing Different Network Information PDF
This slide covers details about different network management functions in terms of fault management, performance management, configuration management, security management. This is a Developing Business Analytics Framework Addressing Different Network Information PDF template with various stages. Focus and dispense information on four stages using this creative set, that comes with editable features. It contains large content boxes to add your information on topics like Fault Management , Performance Management, Configuration Management You can also showcase facts, figures, and other relevant content using this PPT layout. Grab it now.
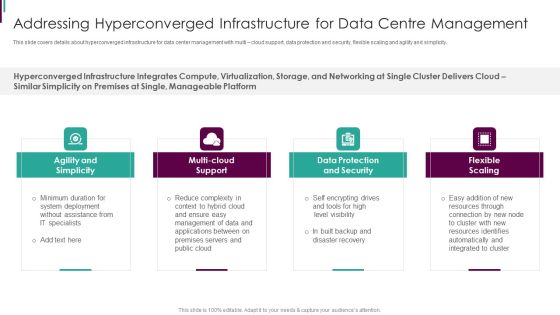
Developing Business Analytics Framework Addressing Hyperconverged Infrastructure Graphics PDF
This slide covers details about hyperconverged infrastructure for data center management with multi cloud support, data protection and security, flexible scaling and agility and simplicity. Presenting Developing Business Analytics Framework Addressing Hyperconverged Infrastructure Graphics PDF to provide visual cues and insights. Share and navigate important information on four stages that need your due attention. This template can be used to pitch topics like Flexible Scaling, Resources Through, Resources Identifies In addtion, this PPT design contains high resolution images, graphics, etc, that are easily editable and available for immediate download.

Developing Business Analytics Framework Comprehensive Network Optimization Slides PDF
This slide covers details regarding the network optimization capabilities in terms of advanced caching capabilities, TCP layer optimization, global balancing of load, etc. This is a Developing Business Analytics Framework Comprehensive Network Optimization Slides PDF template with various stages. Focus and dispense information on five stages using this creative set, that comes with editable features. It contains large content boxes to add your information on topics like Caching Capabilities, Routing Optimization, Layer Optimization You can also showcase facts, figures, and other relevant content using this PPT layout. Grab it now.

Developing Business Analytics Framework Determine Advanced Infrastructure Cont Microsoft PDF
This slide provides information regarding the areas in which firm can digitally advanced such as operation and processes, resources and organization and workflow. Firm can choose any or all the dimensions as per requirement at a time. This is a Developing Business Analytics Framework Determine Advanced Infrastructure Cont Microsoft PDF template with various stages. Focus and dispense information on three stages using this creative set, that comes with editable features. It contains large content boxes to add your information on topics like Resources Organization, Operation Processes, Determines Magnitude You can also showcase facts, figures, and other relevant content using this PPT layout. Grab it now.
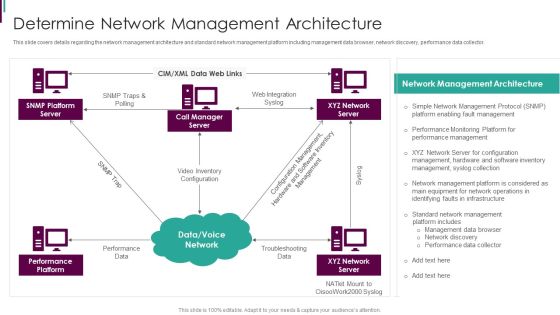
Developing Business Analytics Framework Determine Network Management Architecture Designs PDF
This slide covers details regarding the network management architecture and standard network management platform including management data browser, network discovery, performance data collector. Presenting Developing Business Analytics Framework Determine Network Management Architecture Designs PDF to provide visual cues and insights. Share and navigate important information on three stages that need your due attention. This template can be used to pitch topics like Platform Server, Manager Server, Network Server In addtion, this PPT design contains high resolution images, graphics, etc, that are easily editable and available for immediate download.

Developing Business Analytics Framework Different Categories Associated Infographics PDF
This slide covers information regarding the various categories associated to IT infrastructure management in terms of essential tasks associated with each segment such as system management, network management and storage management. Presenting Developing Business Analytics Framework Different Categories Associated Infographics PDF to provide visual cues and insights. Share and navigate important information on three stages that need your due attention. This template can be used to pitch topics like Systems Management, Network Management, Storage Management In addtion, this PPT design contains high resolution images, graphics, etc, that are easily editable and available for immediate download.
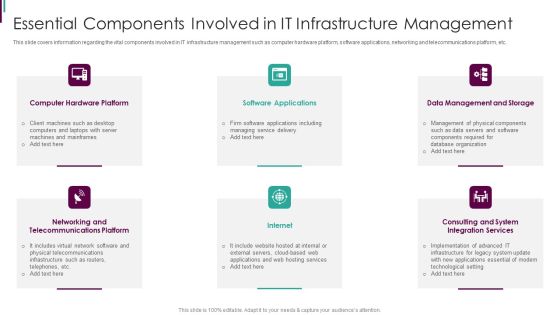
Developing Business Analytics Framework Essential Components Involved Slides PDF
This slide covers information regarding the vital components involved in IT infrastructure management such as computer hardware platform, software applications, networking and telecommunications platform, etc. This is a Developing Business Analytics Framework Essential Components Involved Slides PDF template with various stages. Focus and dispense information on six stages using this creative set, that comes with editable features. It contains large content boxes to add your information on topics like Hardware Platform, Software Applications, Telecommunications Platform You can also showcase facts, figures, and other relevant content using this PPT layout. Grab it now.

Website SEO Analytics Tools For Business Microsoft PDF
The following slide exhibits mechanism for maximizing search ranking of sites. It aims to unfold existing opportunities to stand out from queue. It includes information about tools such as SEMrush, Ahrefs, etc. Persuade your audience using this Website SEO Analytics Tools For Business Microsoft PDF. This PPT design covers four stages, thus making it a great tool to use. It also caters to a variety of topics including Optimization, Perform Website, Boost Traffic. Download this PPT design now to present a convincing pitch that not only emphasizes the topic but also showcases your presentation skills.

Strategy Formulation Analytical Framework Ppt Inspiration
This is a strategy formulation analytical framework ppt inspiration. This is a four stage process. The stages in this process are swot matrix, space matrix, bcg matrix, grand strategy matrix, stage the matching stage.\n\n\n\n\n\n\n\n\n\n

Web Analytics Process Diagram Powerpoint Images
This is a web analytics process diagram powerpoint images. This is a six stage process. The stages in this process are build kpis, define goals, implement, test alternatives, analyze data, collect data.

Web Marketing Analytics Template Example Ppt Presentation
This is a web marketing analytics template example ppt presentation. This is a six stage process. The stages in this process are consulting, conversion optimization, report integration, training, tag management, usability analysis.

Online Product Positioning Analytics Powerpoint Guide
This is a online product positioning analytics powerpoint guide. This is a four stage process. The stages in this process are sales, quantitative volume, contribution margin, cumulative share of companies.

Enterprise Analytic System Template Example Of Ppt
This is a enterprise analytic system template example of ppt. This is a five stage process. The stages in this process are point, development, system design, feasibility analysis, create and modify reports, leverage existing content.
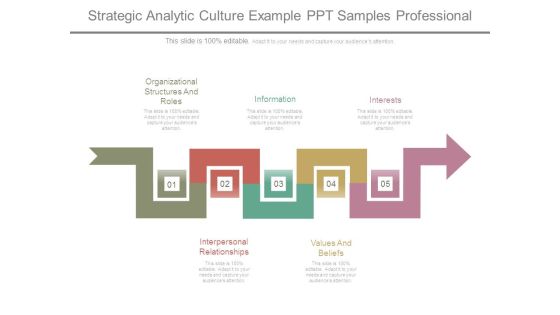
Strategic Analytic Culture Example Ppt Samples Professional
This is a strategic analytic culture example ppt samples professional. This is a five stage process. The stages in this process are organizational structures and roles, interpersonal relationships, information, values and beliefs, interests.
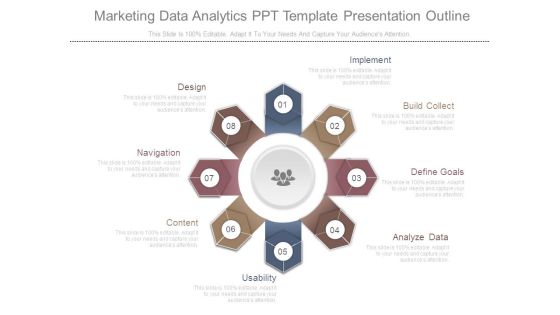
Marketing Data Analytics Ppt Template Presentation Outline
This is a marketing data analytics ppt template presentation outline. This is a eight stage process. The stages in this process are design, navigation, content, usability, analyze data, define goals, build collect, implement.

Mapping Analytics Template Ppt Examples Professional
This is a mapping analytics template ppt examples professional. This is a four stage process. The stages in this process are omni channel distribution and fulfillment, sourcing and supplier collaboration, planning and execution, retail execution.

Website Performance Analytics Ppt PowerPoint Presentation Show
This is a website performance analytics ppt powerpoint presentation show. This is a three stage process. The stages in this process are conversion rate, visits, average visit value goal, return on investment ric, total visits, cost.
 Home
Home