Machine Learning
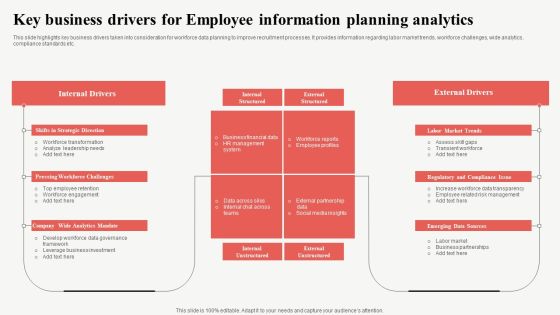
Key Business Drivers For Employee Information Planning Analytics Background PDF
This slide highlights key business drivers taken into consideration for workforce data planning to improve recruitment processes. It provides information regarding labor market trends, workforce challenges, wide analytics, compliance standards etc. Showcasing this set of slides titled Key Business Drivers For Employee Information Planning Analytics Background PDF. The topics addressed in these templates are Internal Drivers, External Drivers, Market Trends. All the content presented in this PPT design is completely editable. Download it and make adjustments in color, background, font etc. as per your unique business setting.

Data Collection Processing And Analysis Ppt PowerPoint Presentation Pictures Infographics
This is a data collection processing and analysis ppt powerpoint presentation pictures infographics. This is a five stage process. The stages in this process are data flow, data management, big data.

Integrated Quality Analytical Chemistry Ppt Slides
This is a integrated quality analytical chemistry ppt slides. This is a four stage process. The stages in this process are integrated quality, pharmaceutical manufacturing, process design, regulatory restructuring.

Business Analytics Ppt PowerPoint Presentation Complete Deck With Slides
Presenting this set of slides with name business analytics ppt powerpoint presentation complete deck with slides. The topics discussed in these slides are marketing, business, management, planning, strategy. This is a completely editable PowerPoint presentation and is available for immediate download. Download now and impress your audience.
Icons Slide For Developing Business Analytics Framework Clipart PDF
Introducing our well designed Icons Slide For Developing Business Analytics Framework Clipart PDF set of slides. The slide displays editable icons to enhance your visual presentation. The icons can be edited easily. So customize according to your business to achieve a creative edge. Download and share it with your audience.

Business Revenue And Client Retention Analytics Dashboard Brochure PDF
This slide shows dashboard of service department of firm to make business decisions using customer analytics and covers essential KPIs of customer. It includes request answered, revenue, support cost, customer satisfaction and retention, average time to solve issue. Showcasing this set of slides titled Business Revenue And Client Retention Analytics Dashboard Brochure PDF. The topics addressed in these templates are Customer Satisfaction, Customer Retention, Revenue. All the content presented in this PPT design is completely editable. Download it and make adjustments in color, background, font etc. as per your unique business setting.

Oracle Analytics Cloud Application Roles Background PDF
This slide represents the oracle analytics aloud application roles. It includes BI service administrator, BI data model author, BI content writer, BI data load, DV content writer, and DV consumer. Deliver an awe inspiring pitch with this creative oracle analytics cloud application roles background pdf bundle. Topics like administrator, content, communicate, dashboards, visualizations can be discussed with this completely editable template. It is available for immediate download depending on the needs and requirements of the user.

Online Marketing Analytics Performance Report Microsoft PDF
This slide shows the digital marketing analytics performance report such as social media, blog and public relation performance with website health.Pitch your topic with ease and precision using this Online Marketing Analytics Performance Report Microsoft PDF This layout presents information on Blog Performance, Media Performance, Effective Engagement It is also available for immediate download and adjustment. So, changes can be made in the color, design, graphics or any other component to create a unique layout.

Half Yearly Data Analytics Implementation Roadmap Demonstration
We present our half yearly data analytics implementation roadmap demonstration. This PowerPoint layout is easy-to-edit so you can change the font size, font type, color, and shape conveniently. In addition to this, the PowerPoint layout is Google Slides compatible, so you can share it with your audience and give them access to edit it. Therefore, download and save this well-researched half yearly data analytics implementation roadmap demonstration in different formats like PDF, PNG, and JPG to smoothly execute your business plan.

Six Step Data Analytic Strategy For Business Transformation Download PDF
This slide covers role of data analytics in six steps for transformation of business. It includes acquire customers, transform financial process, create business models, optimize operations, manage risks and maximise insights. Persuade your audience using this Six Step Data Analytic Strategy For Business Transformation Download PDF. This PPT design covers six stages, thus making it a great tool to use. It also caters to a variety of topics including Transform Financial Process, Acquire Customers, Create Business Models. Download this PPT design now to present a convincing pitch that not only emphasizes the topic but also showcases your presentation skills.

Business Analytics Icons Slide Technology Ppt PowerPoint Presentation Styles Outfit
Presenting this set of slides with name business analytics icons slide technology ppt powerpoint presentation styles outfit. The topics discussed in these slides are marketing, business, management, planning, strategy. This is a completely editable PowerPoint presentation and is available for immediate download. Download now and impress your audience.

Centralized Data Analytics Team Structure Clipart PDF
This slide shows the model representing the structure of the centralized data analytics team. It includes key stakeholders such as vice president, centralized data analytics team, and analysts of units A,B and C.Persuade your audience using this Centralized Data Analytics Team Structure Clipart PDF. This PPT design coversone stage, thus making it a great tool to use. It also caters to a variety of topics including Vice President, Data Analytics, Analytics Team. Download this PPT design now to present a convincing pitch that not only emphasizes the topic but also showcases your presentation skills.
Four Text Icons For Environmental Safety And Green Energy Ppt Slides Graphics
Energy generation with windmill and solar plant can be displayed with icon slide. This icon template relates to the concept of environment safety and energy production. We have used graphic icons of green tower, leafs and factory to display the concept in visual manner.

Website Analytics Dashboard To Track Business Performance Guidelines PDF
This slide exhibits visual report to track web performance metrics such as bounce rates, conversion rate, etc. It focuses on visualizing how effectively any website is converting traffic. It involves information related to number of users, page visitors, etc. Pitch your topic with ease and precision using this Website Analytics Dashboard To Track Business Performance Guidelines PDF. This layout presents information on Website Analytics, Dashboard To Track, Business Performance. It is also available for immediate download and adjustment. So, changes can be made in the color, design, graphics or any other component to create a unique layout.

Procurement Data Analytics And Business Intelligence Dashboard Pictures PDF
This slide showcases BI dashboard to help company in real time tracking of procurement KPIs. It includes information such as defect rate, supplier availability, lead time, etc. Pitch your topic with ease and precision using this Procurement Data Analytics And Business Intelligence Dashboard Pictures PDF. This layout presents information on Procurement Data Analytics, Business Intelligence Dashboard. It is also available for immediate download and adjustment. So, changes can be made in the color, design, graphics or any other component to create a unique layout.

Analytical Planning Process Business Ppt PowerPoint Presentation Complete Deck
Presenting this set of slides with name analytical planning process business ppt powerpoint presentation complete deck. The topics discussed in these slides are strategic, entrepreneurs, objective, process, business. This is a completely editable PowerPoint presentation and is available for immediate download. Download now and impress your audience.

Five Data Analytics Plan To Boost Healthcare Business Formats PDF
Showcasing this set of slides titled Five Data Analytics Plan To Boost Healthcare Business Formats PDF. The topics addressed in these templates are Shareholders Involvement, Data Security, Data Culture. All the content presented in this PPT design is completely editable. Download it and make adjustments in color, background, font etc. as per your unique business setting.

Key Business Benefits Of The Oracle Analytics Cloud Download PDF
This slide represents the key business benefits of the Oracle Analytics Cloud, and it includes reduced cost, scalable needs, accurate analysis, reduced time and efforts, and proactive analysis available on the phone. This is a key business benefits of the oracle analytics cloud download pdf template with various stages. Focus and dispense information on seven stages using this creative set, that comes with editable features. It contains large content boxes to add your information on topics like cost, ownership, business, capabilities. You can also showcase facts, figures, and other relevant content using this PPT layout. Grab it now.

Streamlining Manufacturing Processes With Workflow Automation Method To Estimate Organization Workflow Efficiency Formats PDF
This slide illustrates the method to calculate organizational workflow efficiency and provide the current workflow efficiency of organization. It includes total cycle time, value added time, wasted activity time etc. This modern and well-arranged Mike santos, Henry Nicholas, Yasir Mohamad, Donald young provides lots of creative possibilities. It is very simple to customize and edit with the Powerpoint Software. Just drag and drop your pictures into the shapes. All facets of this template can be edited with Powerpoint no extra software is necessary. Add your own material, put your images in the places assigned for them, adjust the colors, and then you can show your slides to the world, with an animated slide included.

Web Analytical Model In Business Operations Graphics PDF
Persuade your audience using this web analytical model in business operations graphics pdf. This PPT design covers four stages, thus making it a great tool to use. It also caters to a variety of topics including business, sufficiency, data insights. Download this PPT design now to present a convincing pitch that not only emphasizes the topic but also showcases your presentation skills.

Business Analytics Solution Dashboard Ppt PowerPoint Presentation File Clipart PDF
Presenting this set of slides with name business analytics solution dashboard ppt powerpoint presentation file clipart pdf. The topics discussed in these slides are aesthetic, navigation, searchability. This is a completely editable PowerPoint presentation and is available for immediate download. Download now and impress your audience.

Four Vs Of Business Analytics Ppt PowerPoint Presentation Layouts Rules
Presenting this set of slides with name four vs of business analytics ppt powerpoint presentation layouts rules. This is a four stage process. The stages in this process are volume, variety, velocity, value. This is a completely editable PowerPoint presentation and is available for immediate download. Download now and impress your audience.
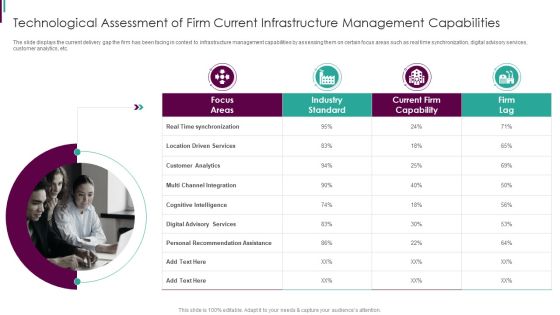
Developing Business Analytics Framework Technological Assessment Infographics PDF
The slide displays the current delivery gap the firm has been facing in context to infrastructure management capabilities by assessing them on certain focus areas such as real time synchronization, digital advisory services, customer analytics, etc.This is a Developing Business Analytics Framework Technological Assessment Infographics PDF template with various stages. Focus and dispense information on four stages using this creative set, that comes with editable features. It contains large content boxes to add your information on topics like Industry Standard, Current Capability, Recommendation You can also showcase facts, figures, and other relevant content using this PPT layout. Grab it now.

Data Analytics Impact On Business Marketing Plan Mockup PDF
This slide covers benefits of data analytics tool for building effective marketing strategies. It includes decision making, improvement in marketing, improved customer service and smooth operation. Presenting Data Analytics Impact On Business Marketing Plan Mockup PDF to dispense important information. This template comprises four stages. It also presents valuable insights into the topics including Decision Making, Improvement In Marketing, Improved Customer Service. This is a completely customizable PowerPoint theme that can be put to use immediately. So, download it and address the topic impactfully.

Pureprofile Business Overview Analytics Services Ppt Pictures Graphics PDF
The following slide highlights the reporting and analytics services offered by Pureprofile. It provides advanced data cleaning, data weighting, RIM weighting and verbatim coding. This is a Pureprofile Business Overview Analytics Services Ppt Pictures Graphics PDF template with various stages. Focus and dispense information on four stages using this creative set, that comes with editable features. It contains large content boxes to add your information on topics like Advanced Data Cleaning, Data Weighting, RIM Weighting. You can also showcase facts, figures, and other relevant content using this PPT layout. Grab it now.

Data Analytics Program Checklist Business Analysis Modification Toolkit Introduction PDF
This slide shows progress status of data analytics process which includes important key tasks that must be performed while initiating a project.This is a Data Analytics Program Checklist Business Analysis Modification Toolkit Introduction PDF template with various stages. Focus and dispense information on one stage using this creative set, that comes with editable features. It contains large content boxes to add your information on topics like Data Visualization, Data Modelling, Statistical Analysis. You can also showcase facts, figures, and other relevant content using this PPT layout. Grab it now.

Business Analytics And Statistical Science Five Year Roadmap Rules
We present our business analytics and statistical science five year roadmap rules. This PowerPoint layout is easy to edit so you can change the font size, font type, color, and shape conveniently. In addition to this, the PowerPoint layout is Google Slides compatible, so you can share it with your audience and give them access to edit it. Therefore, download and save this well researched business analytics and statistical science five year roadmap rules in different formats like PDF, PNG, and JPG to smoothly execute your business plan.
Thank You Business Analytics Ppt PowerPoint Presentation Infographic Template Icons
Presenting this set of slides with name thank you business analytics ppt powerpoint presentation infographic template icons. This is a one stage process. The stages in this process are thank you. This is a completely editable PowerPoint presentation and is available for immediate download. Download now and impress your audience.
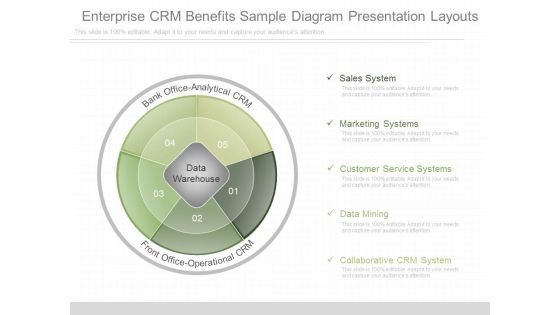
Enterprise Crm Benefits Sample Diagram Presentation Layouts
This is a e enterprise crm benefits sample diagram presentation layouts. This is a five stage process. The stages in this process are sales system, marketing systems, customer service systems, data mining, collaborative crm system, bank office analytical crm, front office operational crm, data warehouse.\n\n\n\n

Crm Operational Illustration Ppt Sample
This is a crm operational illustration ppt sample. This is a six stage process. The stages in this process are customer service systems, marketing systems, sales systems, collaborative crm system, data mining, data warehouse, front office operational crm, back office analytical crm.
Internet Data Storage Vector Icon Ppt Powerpoint Presentation Outline Backgrounds
This is a internet data storage vector icon ppt powerpoint presentation outline backgrounds. The topics discussed in this diagram are data management icon, big data icon. This is a completely editable PowerPoint presentation, and is available for immediate download.

CRM Analytics Regional Growth Rate Diagrams PDF
This slide provides the glimpse of the customer relationship management analytics regional growth rate from 2020 to 2025.This is a crm analytics regional growth rate diagrams pdf template with various stages. Focus and dispense information on three stages using this creative set, that comes with editable features. It contains large content boxes to add your information on topics like crm analytics regional growth rate. You can also showcase facts, figures, and other relevant content using this PPT layout. Grab it now.

Oracle Analytics Cloud Professional Edition Graphics PDF
This slide defines the collaboration and publishing cloud solution of Oracle Analytics and how it encourages teamwork in the organizations. Presenting oracle analytics cloud professional edition graphics pdf to provide visual cues and insights. Share and navigate important information on seven stages that need your due attention. This template can be used to pitch topics like oracle analytics cloud solutions collaboration and publishing. In addtion, this PPT design contains high resolution images, graphics, etc, that are easily editable and available for immediate download.

Analytical Incrementalism Business Performance Measurement Metrics Sales Infographics PDF
The purpose of this slide is to provide a glimpse about the business marketing performance measurement metrics after logical incrementalism approach. Deliver an awe-inspiring pitch with this creative analytical incrementalism business performance measurement metrics sales infographics pdf bundle. Topics like gross profit margin, revenue, quick ratio can be discussed with this completely editable template. It is available for immediate download depending on the needs and requirements of the user.

Analytical Incrementalism Business Performance Measurement Metrics Download PDF
The purpose of this slide is to provide a glimpse about the business marketing performance measurement metrics after logical incrementalism approach. Deliver an awe-inspiring pitch with this creative analytical incrementalism business performance measurement metrics download pdf bundle. Topics like sales revenue, new customer, sales growth, sales region performance, profit can be discussed with this completely editable template. It is available for immediate download depending on the needs and requirements of the user.

Human Resource Analytics Business Intelligence Hybrid Architecture Framework Elements PDF
This slide represents the hybrid architecture including both technologies of data mart and OLAP cubes. It includes key recommendations such as implementation of data marts as part of data security for data aggregation etc. Get a simple yet stunning designed Human Resource Analytics Business Intelligence Hybrid Architecture Framework Elements PDF. It is the best one to establish the tone in your meetings. It is an excellent way to make your presentations highly effective. So, download this PPT today from Slidegeeks and see the positive impacts. Our easy-to-edit Human Resource Analytics Business Intelligence Hybrid Architecture Framework Elements PDF can be your go-to option for all upcoming conferences and meetings. So, what are you waiting for Grab this template today.

Data Lake Architecture Future Of Data Analysis Introduction To Data Lake File Storage System Template PDF
This slide represents the data lake file storage system based on big datas five Vs such as volume, velocity, value, veracity and variety, and benefits of using this file storage system.This is a Data Lake Architecture Future Of Data Analysis Introduction To Data Lake File Storage System Template PDF template with various stages. Focus and dispense information on five stages using this creative set, that comes with editable features. It contains large content boxes to add your information on topics like Trustworthiness Authenticity, Availability Accountability, Unstructured Probabilistic. You can also showcase facts, figures, and other relevant content using this PPT layout. Grab it now.

Sales Analytics Ppt Layout Presentation Images
This is a sales analytics ppt layout presentation images. This is a five stage process. The stages in this process are sales reporting, sales portals, engine, reporter, pathfinder.

Digital Marketing Analytics Diagram Ppt Summary
This is a digital marketing analytics diagram ppt summary. This is a four stage process. The stages in this process are content strategy, usability, engineering, architecture, strategy.

Marketing Management Analytics Diagram Ppt Background Graphics
This is a marketing management analytics diagram ppt background graphics. This is a five stage process. The stages in this process are product, price, place, targeting, positioning.
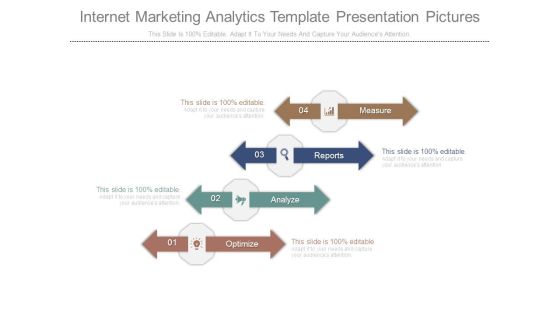
Internet Marketing Analytics Template Presentation Pictures
This is a internet marketing analytics template presentation pictures. This is a four stage process. The stages in this process are measure, reports, analyze, optimize.
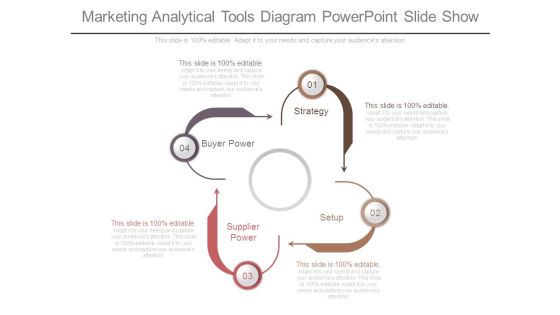
Marketing Analytical Tools Diagram Powerpoint Slide Show
This is a marketing analytical tools diagram powerpoint slide show. This is a four stage process. The stages in this process are buyer power, strategy, supplier power, setup.

Advanced Analytics Techniques Template Powerpoint Slides
This is a advanced analytics techniques template powerpoint slides. This is a six stage process. The stages in this process are reporting, strategy, collection, knowledge, information, data.

Analytical Access Example Sample Presentation Ppt
This is a analytical access example sample presentation ppt. This is a four stage process. The stages in this process are hypothesis, collect facts, optimize, measure.
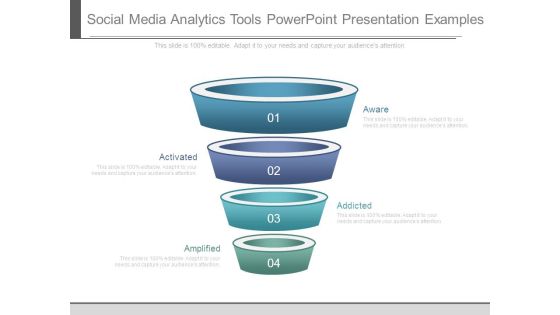
Social Media Analytics Tools Powerpoint Presentation Examples
This is a social media analytics tools powerpoint presentation examples. This is a four stage process. The stages in this process are activated, amplified, aware, addicted.

Data Driven Analytics Chart Powerpoint Presentation Templates
This is a data driven analytics chart powerpoint presentation templates. This is a five stage process. The stages in this process are category.

Technology Procedure For Business Improvement Brochure PDF
This slide presents various steps of technology design process to acquire automation in business. It includes key steps such as vision, program, specify requirement, life cycle implications and engagement with partners. Presenting Technology Procedure For Business Improvement Brochure PDF to dispense important information. This template comprises five stages. It also presents valuable insights into the topics including Vision, Program, Engagement With Partners. This is a completely customizable PowerPoint theme that can be put to use immediately. So, download it and address the topic impactfully.

Technology Licensing Operation Process Framework Summary PDF
This slide highlights a framework of operating process to acquire technology licenses to install automation in business. It include key steps such as make request, preliminary consultation, rights negotiation, authorized amount, contract signing and approving contract. Persuade your audience using this Technology Licensing Operation Process Framework Summary PDF. This PPT design covers six stages, thus making it a great tool to use. It also caters to a variety of topics including Rights Negotiation, Contract Signing, Preliminary Consultation. Download this PPT design now to present a convincing pitch that not only emphasizes the topic but also showcases your presentation skills.

Retail Analytics Example Powerpoint Presentation Templates
This is a retail analytics example powerpoint presentation templates. This is a five stage process. The stages in this process are production, shipping, stores, analyzing and forecasting, re orders.
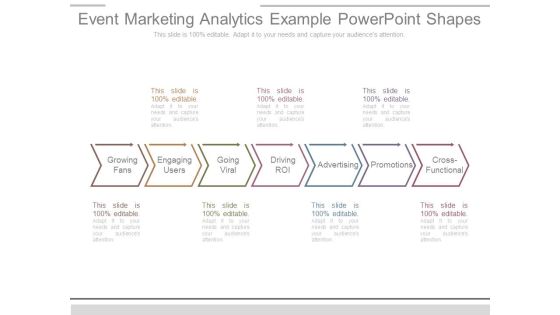
Event Marketing Analytics Example Powerpoint Shapes
This is a event marketing analytics example powerpoint shapes. This is a seven stage process. The stages in this process are growing fans, engaging users, going viral, driving roi, advertising, promotions, cross functional.

Sample Of Internet Analytics Template Powerpoint Themes
This is a sample of internet analytics template powerpoint themes. This is a six stage process. The stages in this process are improve or eliminate, analyze, action, define, measure, reinforce clarity.
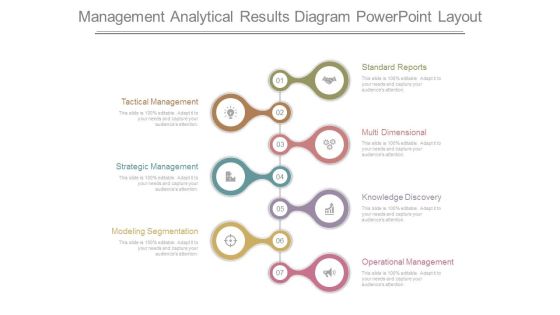
Management Analytical Results Diagram Powerpoint Layout
This is a management analytical results diagram powerpoint layout. This is a seven stage process. The stages in this process are standard reports, multi dimensional, knowledge discovery, operational management, modeling segmentation, strategic management, tactical management.

Customer Experience Analytics Example Ppt Infographic Template
This is a customer experience analytics example ppt infographic template. This is a six stage process. The stages in this process are resource fluidity, measurement, priorities, process, leadership edge, enterprise culture.
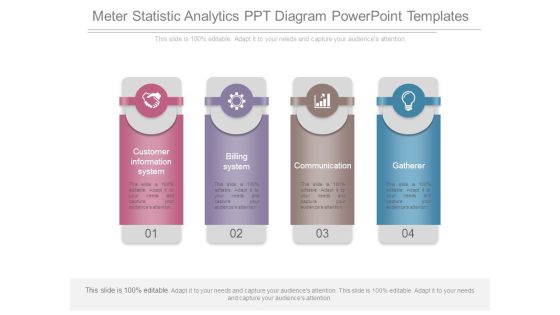
Meter Statistic Analytics Ppt Diagram Powerpoint Templates
This is a meter statistic analytics ppt diagram powerpoint templates. This is a four stage process. The stages in this process are customer information system, billing system, communication, gatherer.

Closed Loop Analytics Layout Powerpoint Slide Designs
This is a closed loop analytics layout powerpoint slide designs. This is a seven stage process. The stages in this process are results, action, decide, track, analysis, model, adjust act.

Marketing Analytics Ppt Template Powerpoint Slide Introduction
This is a marketing analytics ppt template powerpoint slide introduction. This is a six stage process. The stages in this process are reporting intelligence, acquisition, development, pricing strategy, product design, other solution.

Web Analytics Diagram Ppt Slides Themes
This is a web analytics diagram ppt slides themes. This is a three stage process. The stages in this process are build, analyse, measure, test alternatives, optimise, collect data, define goals, report, implement.
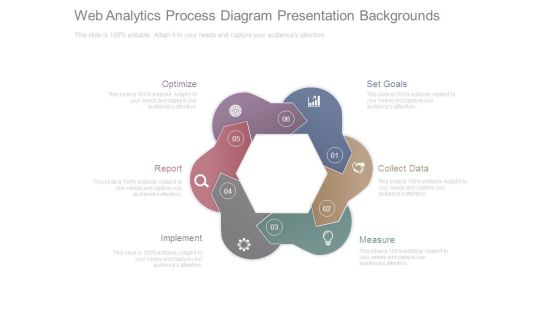
Web Analytics Process Diagram Presentation Backgrounds
This is a web analytics process diagram presentation backgrounds. This is a six stage process. The stages in this process are optimize, report, implement, measure, collect data, set goals.
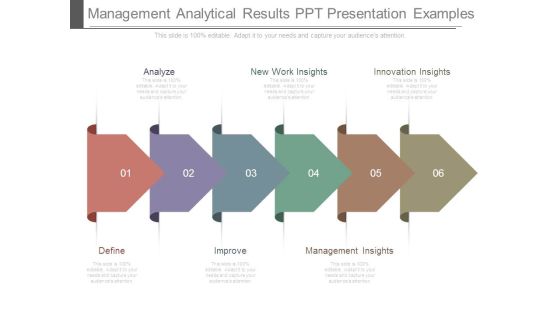
Management Analytical Results Ppt Presentation Examples
This is a management analytical results ppt presentation examples. This is a six stage process. The stages in this process are define, improve, management insights, innovation insights, new work insights, analyze.

Customized Analytical Support Diagram Powerpoint Presentation Examples
This is a customized analytical support diagram powerpoint presentation examples. This is a four stage process. The stages in this process are scope and define the problem, data gathering and investigation, develop options, recommendation report.
 Home
Home