List Of Five

Website Design And Branding Studio Company Profile Operating Profits From 2018 To 2023 Graphics PDF
This slide covers the operating profit of web design company for last five years from 2018 to 2023 which shows changes in operating profits year after year. Formulating a presentation can take up a lot of effort and time, so the content and message should always be the primary focus. The visuals of the PowerPoint can enhance the presenters message, so our Website Design And Branding Studio Company Profile Operating Profits From 2018 To 2023 Graphics PDF was created to help save time. Instead of worrying about the design, the presenter can concentrate on the message while our designers work on creating the ideal templates for whatever situation is needed. Slidegeeks has experts for everything from amazing designs to valuable content, we have put everything into Website Design And Branding Studio Company Profile Operating Profits From 2018 To 2023 Graphics PDF.
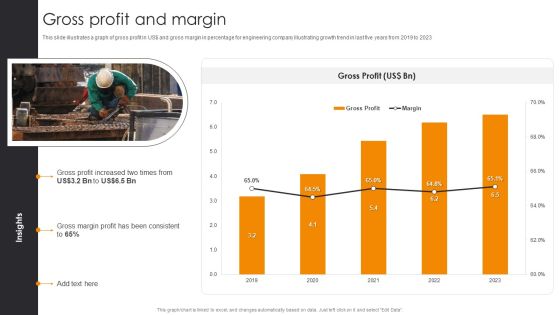
Gross Profit And Margin Engineering Company Financial Analysis Report Rules PDF
This slide illustrates a graph of gross profit in US dollar and gross margin in percentage for engineering company illustrating growth trend in last five years from 2019 to 2023. Retrieve professionally designed Gross Profit And Margin Engineering Company Financial Analysis Report Rules PDF to effectively convey your message and captivate your listeners. Save time by selecting pre-made slideshows that are appropriate for various topics, from business to educational purposes. These themes come in many different styles, from creative to corporate, and all of them are easily adjustable and can be edited quickly. Access them as PowerPoint templates or as Google Slides themes. You do not have to go on a hunt for the perfect presentation because Slidegeeks got you covered from everywhere.

Company Revenue 2019 To 2023 Engineering Company Financial Analysis Report Structure PDF
The slide shows annual revenue growth of the company with the CAGR for last five financial years from 2019 to 2023 along with key insights.Presenting this PowerPoint presentation, titled Company Revenue 2019 To 2023 Engineering Company Financial Analysis Report Structure PDF, with topics curated by our researchers after extensive research. This editable presentation is available for immediate download and provides attractive features when used. Download now and captivate your audience. Presenting this Company Revenue 2019 To 2023 Engineering Company Financial Analysis Report Structure PDF. Our researchers have carefully researched and created these slides with all aspects taken into consideration. This is a completely customizable Company Revenue 2019 To 2023 Engineering Company Financial Analysis Report Structure PDF that is available for immediate downloading. Download now and make an impact on your audience. Highlight the attractive features available with our PPTs.

Operating Profit And Margin Engineering Company Financial Analysis Report Portrait PDF
This slide illustrates a graph of operating profit in US dollar and gross margin in percentage for engineering company illustrating key insights and changes in last five years from 2019 to 2023. Here you can discover an assortment of the finest PowerPoint and Google Slides templates. With these templates, you can create presentations for a variety of purposes while simultaneously providing your audience with an eye-catching visual experience. Download Operating Profit And Margin Engineering Company Financial Analysis Report Portrait PDF to deliver an impeccable presentation. These templates will make your job of preparing presentations much quicker, yet still, maintain a high level of quality. Slidegeeks has experienced researchers who prepare these templates and write high-quality content for you. Later on, you can personalize the content by editing the Operating Profit And Margin Engineering Company Financial Analysis Report Portrait PDF.
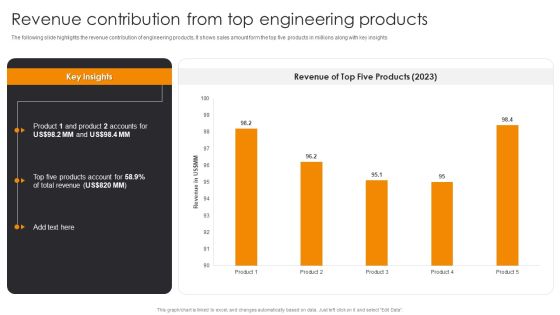
Revenue Contribution From Top Engineering Products Engineering Company Financial Analysis Report Infographics PDF
The following slide highlights the revenue contribution of engineering products, It shows sales amount form the top five products in millions along with key insights. This Revenue Contribution From Top Engineering Products Engineering Company Financial Analysis Report Infographics PDF from Slidegeeks makes it easy to present information on your topic with precision. It provides customization options, so you can make changes to the colors, design, graphics, or any other component to create a unique layout. It is also available for immediate download, so you can begin using it right away. Slidegeeks has done good research to ensure that you have everything you need to make your presentation stand out. Make a name out there for a brilliant performance.

IT Firm Financial Statement Gross Profit And Margin Summary PDF
This slide illustrates a graph of gross profit in US dollar and gross margin in percentage for IT company illustrating growth trend in last five years from 2019 to 2023. It also showcases gross profit contribution by services and solutions. Boost your pitch with our creative IT Firm Financial Statement Gross Profit And Margin Summary PDF. Deliver an awe inspiring pitch that will mesmerize everyone. Using these presentation templates you will surely catch everyones attention. You can browse the ppts collection on our website. We have researchers who are experts at creating the right content for the templates. So you do not have to invest time in any additional work. Just grab the template now and use them.
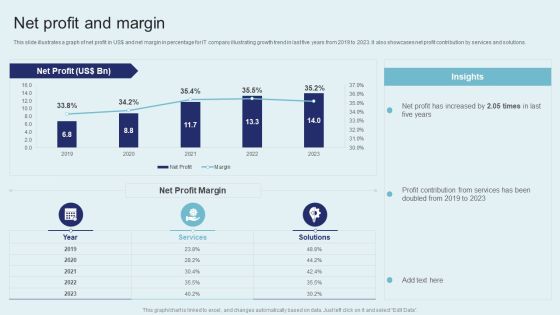
IT Firm Financial Statement Net Profit And Margin Slides PDF
This slide illustrates a graph of net profit in US dollar and net margin in percentage for IT company illustrating growth trend in last five years from 2019 to 2023. It also showcases net profit contribution by services and solutions. Do you have to make sure that everyone on your team knows about any specific topic I yes, then you should give IT Firm Financial Statement Net Profit And Margin Slides PDF a try. Our experts have put a lot of knowledge and effort into creating this impeccable IT Firm Financial Statement Net Profit And Margin Slides PDF. You can use this template for your upcoming presentations, as the slides are perfect to represent even the tiniest detail. You can download these templates from the Slidegeeks website and these are easy to edit. So grab these today.

IT Firm Financial Statement Operating Profit And Margin Formats PDF
This slide illustrates a graph of operating profit in US dollar and operating margin in percentage for IT company IT Firm Fina growth trend in last five years from 2019 to 2023. It also showcases operating profit contribution by services and solutions. Get a simple yet stunning designed IT Firm Financial Statement Operating Profit And Margin Formats PDF. It is the best one to establish the tone in your meetings. It is an excellent way to make your presentations highly effective. So, download this PPT today from Slidegeeks and see the positive impacts. Our easy to edit IT Firm Financial Statement Operating Profit And Margin Formats PDF can be your go to option for all upcoming conferences and meetings. So, what are you waiting for Grab this template today.

Sell Side M And A Pitchbook With Deal Overview Sales Deals Count Split By Sectors Portrait PDF
The slide provides the graph of number of sales deals by sector which the company has handled in last five years. It also covers key facts CAGR growth, deal value etc. related to sales deals of the company. Retrieve professionally designed Sell Side M And A Pitchbook With Deal Overview Sales Deals Count Split By Sectors Portrait PDF to effectively convey your message and captivate your listeners. Save time by selecting pre made slideshows that are appropriate for various topics, from business to educational purposes. These themes come in many different styles, from creative to corporate, and all of them are easily adjustable and can be edited quickly. Access them as PowerPoint templates or as Google Slides themes. You do not have to go on a hunt for the perfect presentation because Slidegeeks got you covered from everywhere.
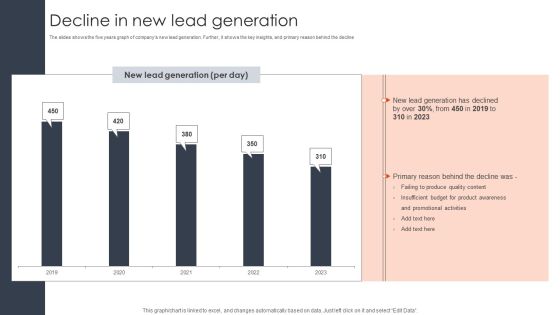
Decline In New Lead Generation Client Acquisition Techniques To Boost Sales Portrait PDF
The slides shows the five years graph of companys new lead generation. Further, it shows the key insights, and primary reason behind the decline. Get a simple yet stunning designed Decline In New Lead Generation Client Acquisition Techniques To Boost Sales Portrait PDF. It is the best one to establish the tone in your meetings. It is an excellent way to make your presentations highly effective. So, download this PPT today from Slidegeeks and see the positive impacts. Our easy-to-edit Decline In New Lead Generation Client Acquisition Techniques To Boost Sales Portrait PDF can be your go-to option for all upcoming conferences and meetings. So, what are you waiting for Grab this template today.

Website Designing Solutions Company Profile CSR Expenditure And Split Introduction PDF
This slide shows the CSR expenditure for last five years from 2018 to 2022 and split for 2022 which includes charities, healthcare, environmental initiatives, educational activities, etc. Find highly impressive Website Designing Solutions Company Profile CSR Expenditure And Split Introduction PDF on Slidegeeks to deliver a meaningful presentation. You can save an ample amount of time using these presentation templates. No need to worry to prepare everything from scratch because Slidegeeks experts have already done a huge research and work for you. You need to download Website Designing Solutions Company Profile CSR Expenditure And Split Introduction PDF for your upcoming presentation. All the presentation templates are 100 percent editable and you can change the color and personalize the content accordingly. Download now
Website Designing Solutions Company Profile Operating Profits From 2018 To 2022 Icons PDF
This slide covers the operating profit of web design company for last five years from 2018 to 2022 which shows changes in operating profits year after year. Explore a selection of the finest Website Designing Solutions Company Profile Operating Profits From 2018 To 2022 Icons PDF here. With a plethora of professionally designed and pre-made slide templates, you can quickly and easily find the right one for your upcoming presentation. You can use our Website Designing Solutions Company Profile Operating Profits From 2018 To 2022 Icons PDF to effectively convey your message to a wider audience. Slidegeeks has done a lot of research before preparing these presentation templates. The content can be personalized and the slides are highly editable. Grab templates today from Slidegeeks.
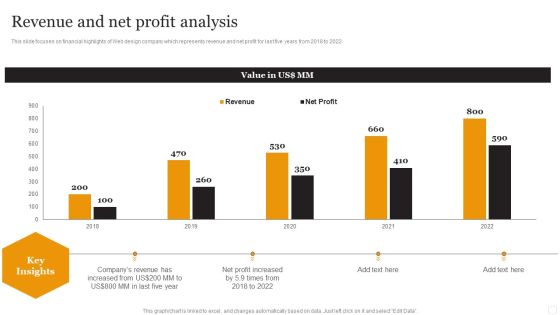
Website Designing Solutions Company Profile Revenue And Net Profit Analysis Background PDF
This slide focuses on financial highlights of Web design company which represents revenue and net profit for last five years from 2018 to 2022. Here you can discover an assortment of the finest PowerPoint and Google Slides templates. With these templates, you can create presentations for a variety of purposes while simultaneously providing your audience with an eye-catching visual experience. Download Website Designing Solutions Company Profile Revenue And Net Profit Analysis Background PDF to deliver an impeccable presentation. These templates will make your job of preparing presentations much quicker, yet still, maintain a high level of quality. Slidegeeks has experienced researchers who prepare these templates and write high-quality content for you. Later on, you can personalize the content by editing the Website Designing Solutions Company Profile Revenue And Net Profit Analysis Background PDF.

Engineering Services Company Report Net Profit And Margin Ppt PowerPoint Presentation File Aids PDF
This slide illustrates a graph of net profit in US dollar and gross margin in percentage for engineering company illustrating growth in last five years from 2018 to 2022. Present like a pro with Engineering Services Company Report Net Profit And Margin Ppt PowerPoint Presentation File Aids PDF Create beautiful presentations together with your team, using our easy-to-use presentation slides. Share your ideas in real-time and make changes on the fly by downloading our templates. So whether youre in the office, on the go, or in a remote location, you can stay in sync with your team and present your ideas with confidence. With Slidegeeks presentation got a whole lot easier. Grab these presentations today.
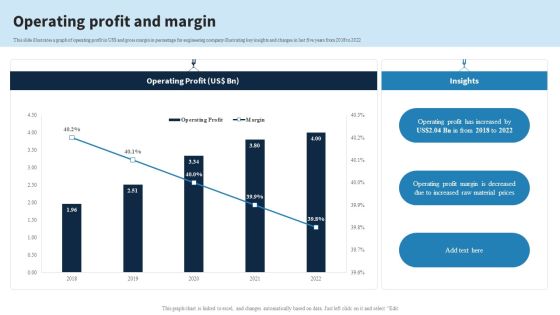
Engineering Services Company Report Operating Profit And Margin Ppt PowerPoint Presentation Gallery Show PDF
This slide illustrates a graph of operating profit in US dollar and gross margin in percentage for engineering company illustrating key insights and changes in last five years from 2018 to 2022. Do you have an important presentation coming up Are you looking for something that will make your presentation stand out from the rest Look no further than Engineering Services Company Report Operating Profit And Margin Ppt PowerPoint Presentation Gallery Show PDF. With our professional designs, you can trust that your presentation will pop and make delivering it a smooth process. And with Slidegeeks, you can trust that your presentation will be unique and memorable. So why wait Grab Engineering Services Company Report Operating Profit And Margin Ppt PowerPoint Presentation Gallery Show PDF today and make your presentation stand out from the rest.
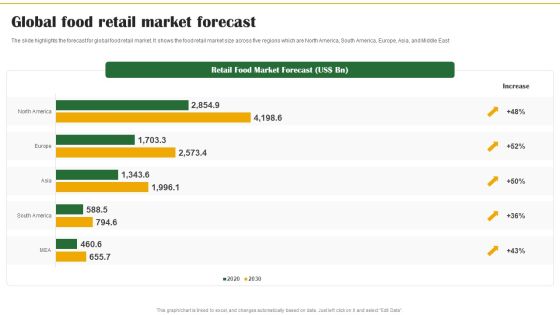
Food Organization Financial Trends Global Food Retail Market Forecast Formats PDF
The slide highlights the forecast for global food retail market. It shows the food retail market size across five regions which are North America, South America, Europe, Asia, and Middle East. Explore a selection of the finest Food Organization Financial Trends Global Food Retail Market Forecast Formats PDF here. With a plethora of professionally designed and pre-made slide templates, you can quickly and easily find the right one for your upcoming presentation. You can use our Food Organization Financial Trends Global Food Retail Market Forecast Formats PDF to effectively convey your message to a wider audience. Slidegeeks has done a lot of research before preparing these presentation templates. The content can be personalized and the slides are highly editable. Grab templates today from Slidegeeks.
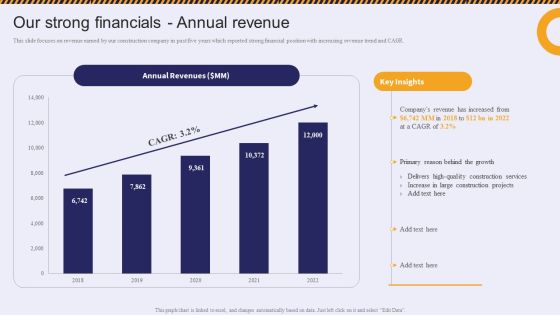
Our Strong Financials Annual Revenue Residential And Commercial Building Construction Topics PDF
This slide focuses on revenue earned by our construction company in past five years which reported strong financial position with increasing revenue trend and CAGR.This Our Strong Financials Annual Revenue Residential And Commercial Building Construction Topics PDF from Slidegeeks makes it easy to present information on your topic with precision. It provides customization options, so you can make changes to the colors, design, graphics, or any other component to create a unique layout. It is also available for immediate download, so you can begin using it right away. Slidegeeks has done good research to ensure that you have everything you need to make your presentation stand out. Make a name out there for a brilliant performance.
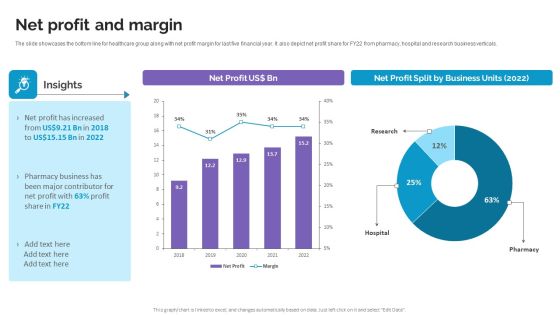
Net Profit And Margin Life Science And Healthcare Solutions Company Profile Inspiration PDF
The slide showcases the bottom line for healthcare group along with net profit margin for last five financial year. It also depict net profit share for FY22 from pharmacy, hospital and research business verticals. Get a simple yet stunning designed Net Profit And Margin Life Science And Healthcare Solutions Company Profile Inspiration PDF. It is the best one to establish the tone in your meetings. It is an excellent way to make your presentations highly effective. So, download this PPT today from Slidegeeks and see the positive impacts. Our easy-to-edit Net Profit And Margin Life Science And Healthcare Solutions Company Profile Inspiration PDF can be your go-to option for all upcoming conferences and meetings. So, what are you waiting for Grab this template today.
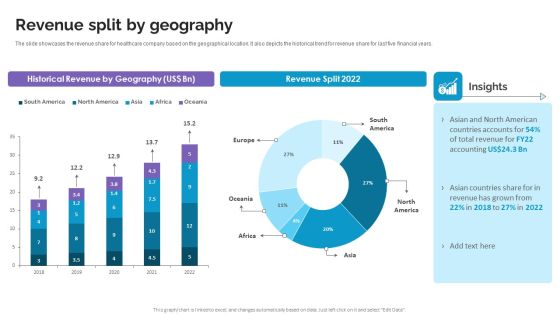
Revenue Split By Geography Life Science And Healthcare Solutions Company Profile Brochure PDF
The slide showcases the revenue share for healthcare company based on the geographical location. It also depicts the historical trend for revenue share for last five financial years. Are you in need of a template that can accommodate all of your creative concepts This one is crafted professionally and can be altered to fit any style. Use it with Google Slides or PowerPoint. Include striking photographs, symbols, depictions, and other visuals. Fill, move around, or remove text boxes as desired. Test out color palettes and font mixtures. Edit and save your work, or work with colleagues. Download Revenue Split By Geography Life Science And Healthcare Solutions Company Profile Brochure PDF and observe how to make your presentation outstanding. Give an impeccable presentation to your group and make your presentation unforgettable.
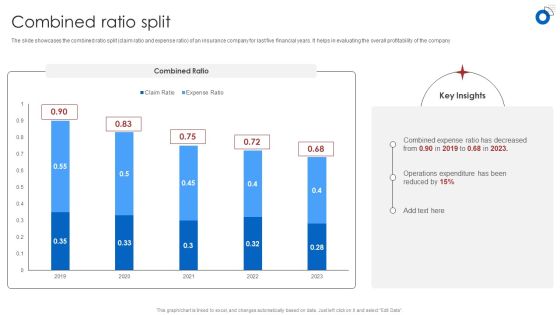
Insurance Business Financial Analysis Combined Ratio Split Ppt Slides Clipart Images PDF
The slide showcases the combined ratio split claim ratio and expense ratio of an insurance company for last five financial years. It helps in evaluating the overall profitability of the company. Are you in need of a template that can accommodate all of your creative concepts This one is crafted professionally and can be altered to fit any style. Use it with Google Slides or PowerPoint. Include striking photographs, symbols, depictions, and other visuals. Fill, move around, or remove text boxes as desired. Test out color palettes and font mixtures. Edit and save your work, or work with colleagues. Download Insurance Business Financial Analysis Combined Ratio Split Ppt Slides Clipart Images PDF and observe how to make your presentation outstanding. Give an impeccable presentation to your group and make your presentation unforgettable.

Insurance Business Financial Analysis Historical Revenue Ppt Styles Graphics PDF
The slide showcases company revenue for last five years along with yearly on year growth. It also depicts CAGR and key insights for revenue analysis. Crafting an eye-catching presentation has never been more straightforward. Let your presentation shine with this tasteful yet straightforward Insurance Business Financial Analysis Historical Revenue Ppt Styles Graphics PDF template. It offers a minimalistic and classy look that is great for making a statement. The colors have been employed intelligently to add a bit of playfulness while still remaining professional. Construct the ideal Insurance Business Financial Analysis Historical Revenue Ppt Styles Graphics PDF that effortlessly grabs the attention of your audience Begin now and be certain to wow your customers.
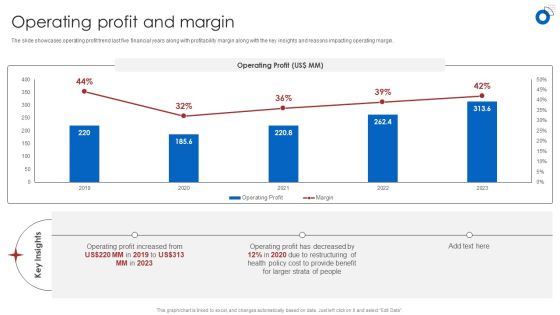
Insurance Business Financial Analysis Operating Profit And Margin Ppt Styles Structure PDF
The slide showcases operating profit trend last five financial years along with profitability margin along with the key insights and reasons impacting operating margin. Formulating a presentation can take up a lot of effort and time, so the content and message should always be the primary focus. The visuals of the PowerPoint can enhance the presenters message, so our Insurance Business Financial Analysis Operating Profit And Margin Ppt Styles Structure PDF was created to help save time. Instead of worrying about the design, the presenter can concentrate on the message while our designers work on creating the ideal templates for whatever situation is needed. Slidegeeks has experts for everything from amazing designs to valuable content, we have put everything into Insurance Business Financial Analysis Operating Profit And Margin Ppt Styles Structure PDF.
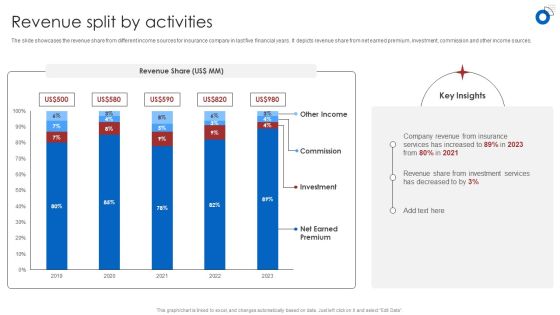
Insurance Business Financial Analysis Revenue Split By Activities Ppt Infographic Template Design Inspiration PDF
The slide showcases the revenue share from different income sources for insurance company in last five financial years. It depicts revenue share from net earned premium, investment, commission and other income sources. Coming up with a presentation necessitates that the majority of the effort goes into the content and the message you intend to convey. The visuals of a PowerPoint presentation can only be effective if it supplements and supports the story that is being told. Keeping this in mind our experts created Insurance Business Financial Analysis Revenue Split By Activities Ppt Infographic Template Design Inspiration PDF to reduce the time that goes into designing the presentation. This way, you can concentrate on the message while our designers take care of providing you with the right template for the situation.

Insurance Business Financial Analysis Sources Of Revenue Ppt Model Ideas PDF
The slide showcases the revenue earned by the insurance company from different income sources. It depicts revenue earned from net earned premium, investment, commission and other income sources for last five financial years. This modern and well-arranged Insurance Business Financial Analysis Sources Of Revenue Ppt Model Ideas PDF provides lots of creative possibilities. It is very simple to customize and edit with the Powerpoint Software. Just drag and drop your pictures into the shapes. All facets of this template can be edited with Powerpoint, no extra software is necessary. Add your own material, put your images in the places assigned for them, adjust the colors, and then you can show your slides to the world, with an animated slide included.
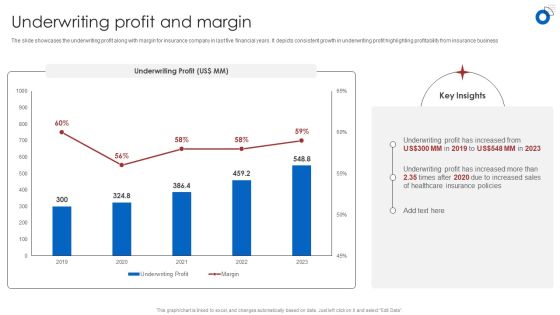
Insurance Business Financial Analysis Underwriting Profit And Margin Ppt Portfolio Sample PDF
The slide showcases the underwriting profit along with margin for insurance company in last five financial years. It depicts consistent growth in underwriting profit highlighting profitability from insurance business. This Insurance Business Financial Analysis Underwriting Profit And Margin Ppt Portfolio Sample PDF is perfect for any presentation, be it in front of clients or colleagues. It is a versatile and stylish solution for organizing your meetings. The Insurance Business Financial Analysis Underwriting Profit And Margin Ppt Portfolio Sample PDF features a modern design for your presentation meetings. The adjustable and customizable slides provide unlimited possibilities for acing up your presentation. Slidegeeks has done all the homework before launching the product for you. So, dont wait, grab the presentation templates today.

Pharmaceutical Company Financial Summary Hospital Business Annual Profit Template PDF
The slide highlights the comparison of annual revenue and profit growth of the hospital business. It compares yearly profit and revenue change in percentage over the period of five years. Do you know about Slidesgeeks Pharmaceutical Company Financial Summary Hospital Business Annual Profit Template PDF These are perfect for delivering any kind od presentation. Using it, create PowerPoint presentations that communicate your ideas and engage audiences. Save time and effort by using our pre-designed presentation templates that are perfect for a wide range of topic. Our vast selection of designs covers a range of styles, from creative to business, and are all highly customizable and easy to edit. Download as a PowerPoint template or use them as Google Slides themes.
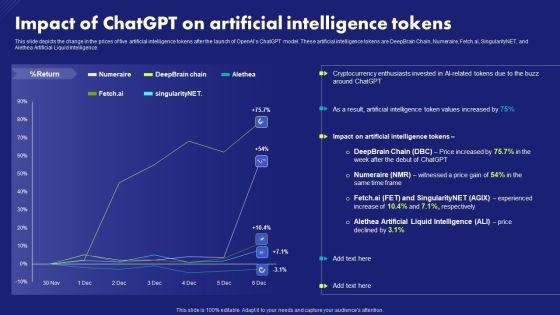
Impact Of Chatgpt On Artificial Intelligence Tokens Chat Generative Pre Trained Transformer Guidelines PDF
This slide depicts the change in the prices of five artificial intelligence tokens after the launch of OpenAIs ChatGPT model. These artificial intelligence tokens are DeepBrain Chain, Numeraire, Fetch.ai, SingularityNET, and Alethea Artificial Liquid Intelligence. This modern and well-arranged Impact Of Chatgpt On Artificial Intelligence Tokens Chat Generative Pre Trained Transformer Guidelines PDF provides lots of creative possibilities. It is very simple to customize and edit with the Powerpoint Software. Just drag and drop your pictures into the shapes. All facets of this template can be edited with Powerpoint no extra software is necessary. Add your own material, put your images in the places assigned for them, adjust the colors, and then you can show your slides to the world, with an animated slide included.

Creating Employee Value Proposition Key Components Of Employee Value Proposition Diagrams PDF
The following slide highlighting five key areas to focus while creating an employee value proposition. It includes key elements such as compensation, benefits, environment, career development and culture. Retrieve professionally designed Creating Employee Value Proposition Key Components Of Employee Value Proposition Diagrams PDF to effectively convey your message and captivate your listeners. Save time by selecting pre-made slideshows that are appropriate for various topics, from business to educational purposes. These themes come in many different styles, from creative to corporate, and all of them are easily adjustable and can be edited quickly. Access them as PowerPoint templates or as Google Slides themes. You dont have to go on a hunt for the perfect presentation because Slidegeeks got you covered from everywhere.

Buy Side Merger And Acquisition Advisory Mergers And Acquisitions By Sector Inspiration PDF
The slide illustrates the graph of number of merger and acquisition deals by sector that the company has completed in last five years. It also covers key facts CAGR growth, deal value etc. related to merger and acquisition deals of the company. This Buy Side Merger And Acquisition Advisory Mergers And Acquisitions By Sector Inspiration PDF from Slidegeeks makes it easy to present information on your topic with precision. It provides customization options, so you can make changes to the colors, design, graphics, or any other component to create a unique layout. It is also available for immediate download, so you can begin using it right away. Slidegeeks has done good research to ensure that you have everything you need to make your presentation stand out. Make a name out there for a brilliant performance.

Target Consumers And Market Valuation Overview Business Overview Of The Target Company Information PDF
The slide provides the business overview of the target company the purchasing company.Business overview includes business introduction, mission and vision statement, financials highlights and non-performing assets for five years. Are you in need of a template that can accommodate all of your creative concepts This one is crafted professionally and can be altered to fit any style. Use it with Google Slides or PowerPoint. Include striking photographs, symbols, depictions, and other visuals. Fill, move around, or remove text boxes as desired. Test out color palettes and font mixtures. Edit and save your work, or work with colleagues. Download Target Consumers And Market Valuation Overview Business Overview Of The Target Company Information PDF and observe how to make your presentation outstanding. Give an impeccable presentation to your group and make your presentation unforgettable.

Target Consumers And Market Valuation Overview Sales Deals Count Split By Sectors Rules PDF
The slide provides the graph of number of sales deals by sector which the company has handled in last five years. It also covers key facts CAGR growth, deal value etc. related to sales deals of the company. Retrieve professionally designed Target Consumers And Market Valuation Overview Sales Deals Count Split By Sectors Rules PDF to effectively convey your message and captivate your listeners. Save time by selecting pre made slideshows that are appropriate for various topics, from business to educational purposes. These themes come in many different styles, from creative to corporate, and all of them are easily adjustable and can be edited quickly. Access them as PowerPoint templates or as Google Slides themes. You do not have to go on a hunt for the perfect presentation because Slidegeeks got you covered from everywhere.
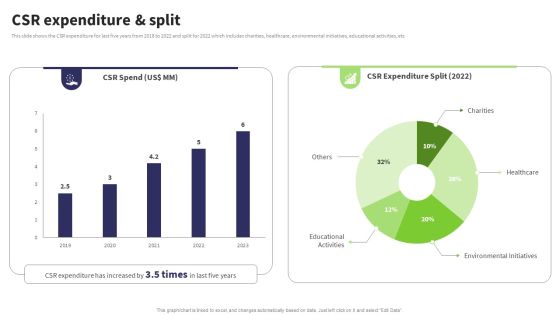
Website Design And Development Services Company Profile Csr Expenditure Infographics PDF
This slide shows the CSR expenditure for last five years from 2018 to 2022 and split for 2022 which includes charities, healthcare, environmental initiatives, educational activities, etc. Presenting this PowerPoint presentation, titled Website Design And Development Services Company Profile Csr Expenditure Infographics PDF, with topics curated by our researchers after extensive research. This editable presentation is available for immediate download and provides attractive features when used. Download now and captivate your audience. Presenting this Website Design And Development Services Company Profile Csr Expenditure Infographics PDF. Our researchers have carefully researched and created these slides with all aspects taken into consideration. This is a completely customizable Website Design And Development Services Company Profile Csr Expenditure Infographics PDF that is available for immediate downloading. Download now and make an impact on your audience. Highlight the attractive features available with our PPTs.
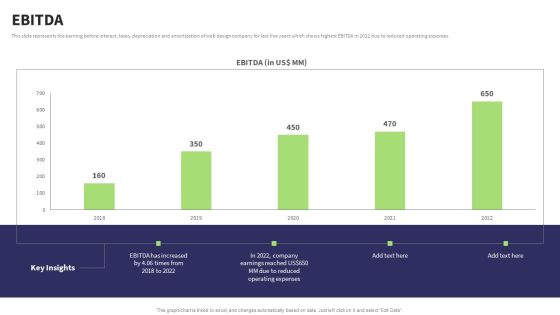
Website Design And Development Services Company Profile EBITDA Sample PDF
This slide represents the earning before interest, taxes, depreciation and amortization of web design company for last five years which shows highest EBITDA in 2022 due to reduced operating expenses. Here you can discover an assortment of the finest PowerPoint and Google Slides templates. With these templates, you can create presentations for a variety of purposes while simultaneously providing your audience with an eye catching visual experience. Download Website Design And Development Services Company Profile EBITDA Sample PDF to deliver an impeccable presentation. These templates will make your job of preparing presentations much quicker, yet still, maintain a high level of quality. Slidegeeks has experienced researchers who prepare these templates and write high quality content for you. Later on, you can personalize the content by editing the Website Design And Development Services Company Profile EBITDA Sample PDF.
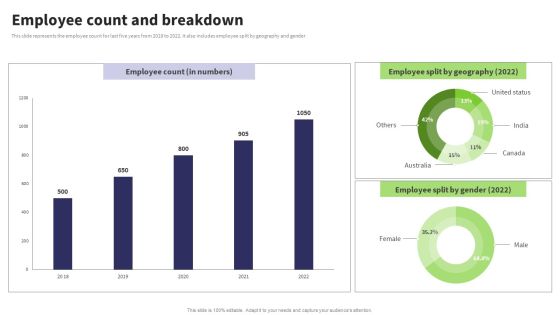
Website Design And Development Services Company Profile Employee Count And Breakdown Clipart PDF
This slide represents the employee count for last five years from 2018 to 2022. It also includes employee split by geography and gender. This Website Design And Development Services Company Profile Employee Count And Breakdown Clipart PDF from Slidegeeks makes it easy to present information on your topic with precision. It provides customization options, so you can make changes to the colors, design, graphics, or any other component to create a unique layout. It is also available for immediate download, so you can begin using it right away. Slidegeeks has done good research to ensure that you have everything you need to make your presentation stand out. Make a name out there for a brilliant performance.
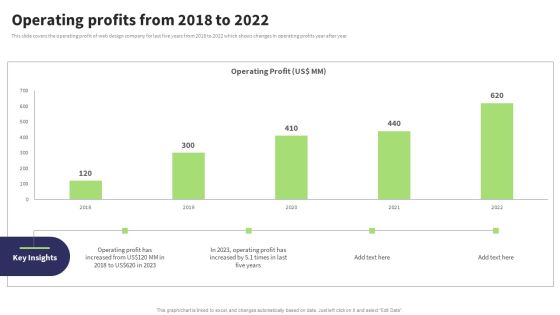
Website Design And Development Services Company Profile Operating Profits From 2018 To 2022 Information PDF
This slide covers the operating profit of web design company for last five years from 2018 to 2022 which shows changes in operating profits year after year. Do you know about Slidesgeeks Website Design And Development Services Company Profile Operating Profits From 2018 To 2022 Information PDF These are perfect for delivering any kind od presentation. Using it, create PowerPoint presentations that communicate your ideas and engage audiences. Save time and effort by using our pre designed presentation templates that are perfect for a wide range of topic. Our vast selection of designs covers a range of styles, from creative to business, and are all highly customizable and easy to edit. Download as a PowerPoint template or use them as Google Slides themes.
Metrics For Tracking Effectiveness Of Safety Measures In The Organization Ppt PowerPoint Presentation File Diagrams PDF
The following slide showcases five safety metrics to monitor the effectiveness of current safety measures. Key KPIs inluded here are reported incidents, accident free days, cases of near misses, audit acore, BBS score etc. Want to ace your presentation in front of a live audience Our Metrics For Tracking Effectiveness Of Safety Measures In The Organization Ppt PowerPoint Presentation File Diagrams PDF can help you do that by engaging all the users towards you. Slidegeeks experts have put their efforts and expertise into creating these impeccable powerpoint presentations so that you can communicate your ideas clearly. Moreover, all the templates are customizable, and easy to edit and downloadable. Use these for both personal and commercial use.
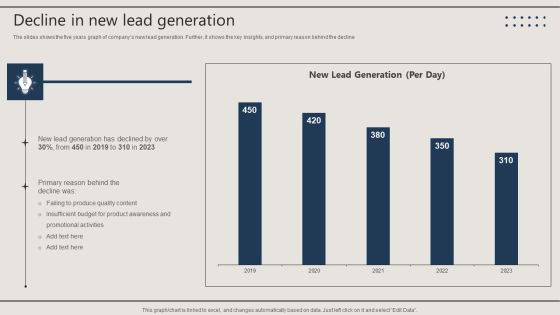
Promotion Techniques Used By B2B Firms Decline In New Lead Generation Guidelines PDF
The slides shows the five years graph of companys new lead generation. Further, it shows the key insights, and primary reason behind the decline. Get a simple yet stunning designed Promotion Techniques Used By B2B Firms Decline In New Lead Generation Guidelines PDF. It is the best one to establish the tone in your meetings. It is an excellent way to make your presentations highly effective. So, download this PPT today from Slidegeeks and see the positive impacts. Our easy to edit Promotion Techniques Used By B2B Firms Decline In New Lead Generation Guidelines PDF can be your go to option for all upcoming conferences and meetings. So, what are you waiting for Grab this template today.
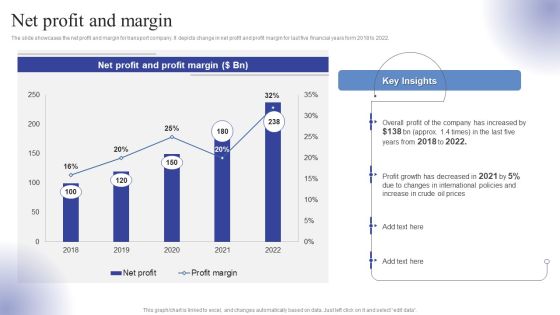
Logistics Transport Company Financial Report Net Profit And Margin Ppt Layouts Graphics Tutorials PDF
The slide showcases the net profit and margin for transport company. It depicts change in net profit and profit margin for last five financial years form 2018 to 2022. Slidegeeks is here to make your presentations a breeze with Logistics Transport Company Financial Report Net Profit And Margin Ppt Layouts Graphics Tutorials PDF With our easy-to-use and customizable templates, you can focus on delivering your ideas rather than worrying about formatting. With a variety of designs to choose from, you are sure to find one that suits your needs. And with animations and unique photos, illustrations, and fonts, you can make your presentation pop. So whether you are giving a sales pitch or presenting to the board, make sure to check out Slidegeeks first

Ebitda Earning Before Interest Taxes Depreciation And Amortization Topics PDF
This slide represents the earning before interest, taxes, depreciation and amortization of Netflix for last five years from 2018 to 2022. Presenting this PowerPoint presentation, titled Ebitda Earning Before Interest Taxes Depreciation And Amortization Topics PDF, with topics curated by our researchers after extensive research. This editable presentation is available for immediate download and provides attractive features when used. Download now and captivate your audience. Presenting this Ebitda Earning Before Interest Taxes Depreciation And Amortization Topics PDF. Our researchers have carefully researched and created these slides with all aspects taken into consideration. This is a completely customizable Ebitda Earning Before Interest Taxes Depreciation And Amortization Topics PDF that is available for immediate downloading. Download now and make an impact on your audience. Highlight the attractive features available with our PPTs.
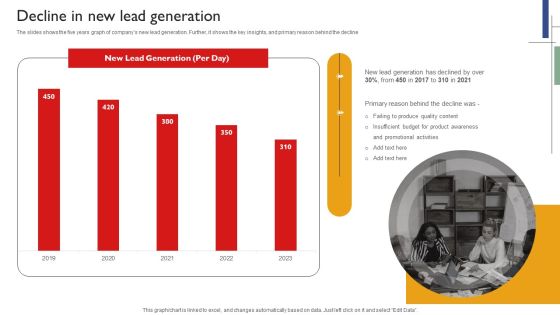
Techniques To Enhance Brand Awareness Decline In New Lead Generation Portrait PDF
The slides shows the five years graph of companys new lead generation. Further, it shows the key insights, and primary reason behind the decline Crafting an eye catching presentation has never been more straightforward. Let your presentation shine with this tasteful yet straightforward Techniques To Enhance Brand Awareness Decline In New Lead Generation Portrait PDF template. It offers a minimalistic and classy look that is great for making a statement. The colors have been employed intelligently to add a bit of playfulness while still remaining professional. Construct the ideal Techniques To Enhance Brand Awareness Decline In New Lead Generation Portrait PDF that effortlessly grabs the attention of your audience. Begin now and be certain to wow your customers.

Coffee Cafe Company Profile Coffee Yearly Gross Profit With Margin Mockup PDF
Following slide provides insights into Starbucks business gross profits from previous five years. It includes yearly gross profit, and key takeaways. Do you have an important presentation coming up Are you looking for something that will make your presentation stand out from the rest Look no further than Coffee Cafe Company Profile Coffee Yearly Gross Profit With Margin Mockup PDF. With our professional designs, you can trust that your presentation will pop and make delivering it a smooth process. And with Slidegeeks, you can trust that your presentation will be unique and memorable. So why wait Grab Coffee Cafe Company Profile Coffee Yearly Gross Profit With Margin Mockup PDF today and make your presentation stand out from the rest.

Profit And Loss Account Statement Summary Of Revenue Cost And Expenses Portrait PDF
The slides provide a glimpse of the projected profit and loss statement to visualize the platforms financial performance for the next five years. The key components are total revenue from operations, gross profit, EBITDA, etc. Do you have to make sure that everyone on your team knows about any specific topic I yes, then you should give Profit And Loss Account Statement Summary Of Revenue Cost And Expenses Portrait PDF a try. Our experts have put a lot of knowledge and effort into creating this impeccable Profit And Loss Account Statement Summary Of Revenue Cost And Expenses Portrait PDF. You can use this template for your upcoming presentations, as the slides are perfect to represent even the tiniest detail. You can download these templates from the Slidegeeks website and these are easy to edit. So grab these today.
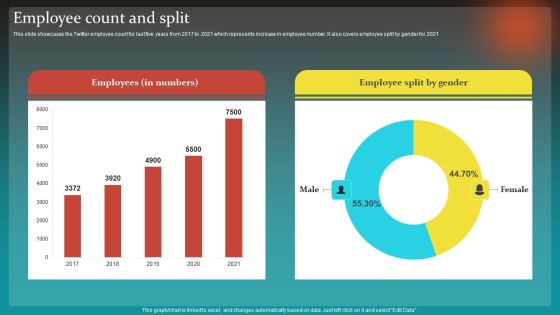
Social Network Business Summary Employee Count And Split Download PDF
This slide showcases the Twitter employee count for last five years from 2017 to 2021 which represents increase in employee number. It also covers employee split by gender for 2021 Do you know about Slidesgeeks Social Network Business Summary Employee Count And Split Download PDF. These are perfect for delivering any kind od presentation. Using it, create PowerPoint presentations that communicate your ideas and engage audiences. Save time and effort by using our pre designed presentation templates that are perfect for a wide range of topic. Our vast selection of designs covers a range of styles, from creative to business, and are all highly customizable and easy to edit. Download as a PowerPoint template or use them as Google Slides themes.
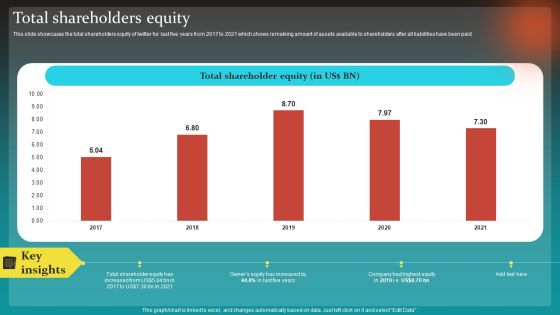
Social Network Business Summary Total Shareholders Equity Infographics PDF
This slide showcases the total shareholders equity of twitter for last five years from 2017 to 2021 which shows remaining amount of assets available to shareholders after all liabilities have been paid Do you have to make sure that everyone on your team knows about any specific topic I yes, then you should give Social Network Business Summary Total Shareholders Equity Infographics PDF a try. Our experts have put a lot of knowledge and effort into creating this impeccable Social Network Business Summary Total Shareholders Equity Infographics PDF. You can use this template for your upcoming presentations, as the slides are perfect to represent even the tiniest detail. You can download these templates from the Slidegeeks website and these are easy to edit. So grab these today.

Social Media Advertising Through Twitter Performance Analysis Dashboard For Twitter Marketing Introduction PDF
This slide represents the dashboard to analysis the performance of twitter advertising campaign. It provides information regarding total followers gained and lost, impressions, engagement rate. It also covers details of top five used and best performing hashtags performance. Are you in need of a template that can accommodate all of your creative concepts This one is crafted professionally and can be altered to fit any style. Use it with Google Slides or PowerPoint. Include striking photographs, symbols, depictions, and other visuals. Fill, move around, or remove text boxes as desired. Test out color palettes and font mixtures. Edit and save your work, or work with colleagues. Download Social Media Advertising Through Twitter Performance Analysis Dashboard For Twitter Marketing Introduction PDF and observe how to make your presentation outstanding. Give an impeccable presentation to your group and make your presentation unforgettable.

Revenue And Net Profit Trend For Brand Ideas PDF
This slide represents revenue and net profit for five years for the company. It showcase increase in revenue due to product recognition in market and gaining competitive edge in market. Formulating a presentation can take up a lot of effort and time, so the content and message should always be the primary focus. The visuals of the PowerPoint can enhance the presenters message, so our Revenue And Net Profit Trend For Brand Ideas PDF was created to help save time. Instead of worrying about the design, the presenter can concentrate on the message while our designers work on creating the ideal templates for whatever situation is needed. Slidegeeks has experts for everything from amazing designs to valuable content, we have put everything into Revenue And Net Profit Trend For Brand Ideas PDF.
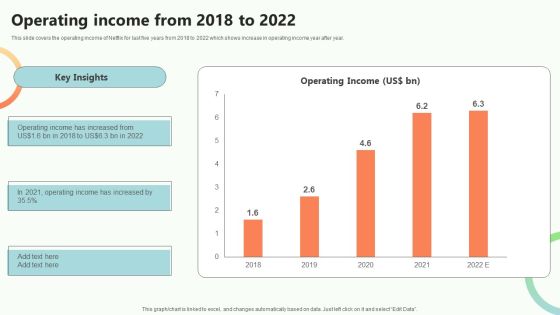
Online Video Content Provider Business Profile Operating Income From 2018 To 2022 Inspiration PDF
This slide covers the operating income of Netflix for last five years from 2018 to 2022 which shows increase in operating income year after year. This Online Video Content Provider Business Profile Operating Income From 2018 To 2022 Inspiration PDF is perfect for any presentation, be it in front of clients or colleagues. It is a versatile and stylish solution for organizing your meetings. The Online Video Content Provider Business Profile Operating Income From 2018 To 2022 Inspiration PDF features a modern design for your presentation meetings. The adjustable and customizable slides provide unlimited possibilities for acing up your presentation. Slidegeeks has done all the homework before launching the product for you. So, do not wait, grab the presentation templates today
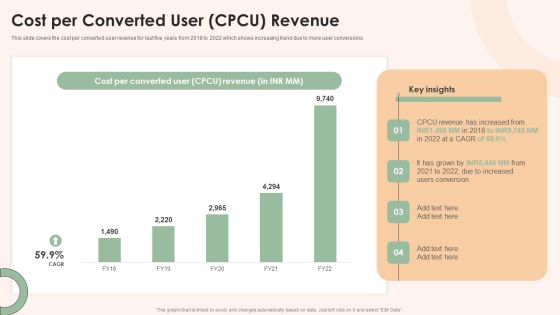
Online Advertising Firm Business Profile Cost Per Converted User CPCU Revenue Information PDF
This slide covers the cost per converted user revenue for last five years from 2018 to 2022 which shows increasing trend due to more user conversions Get a simple yet stunning designed Online Advertising Firm Business Profile Cost Per Converted User CPCU Revenue Information PDF. It is the best one to establish the tone in your meetings. It is an excellent way to make your presentations highly effective. So, download this PPT today from Slidegeeks and see the positive impacts. Our easy to edit Online Advertising Firm Business Profile Cost Per Converted User CPCU Revenue Information PDF can be your go to option for all upcoming conferences and meetings. So, what are you waiting for Grab this template today.
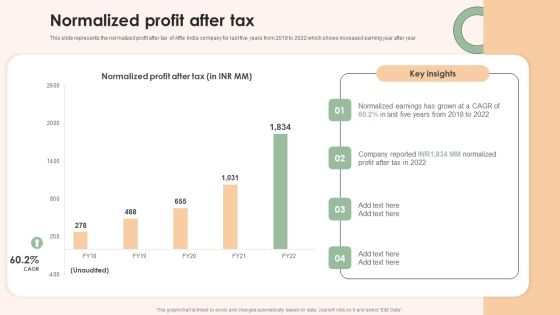
Online Advertising Firm Business Profile Normalized Profit After Tax Microsoft PDF
This slide represents the normalized profit after tax of Affle India company for last five years from 2018 to 2022 which shows increased earning year after year Formulating a presentation can take up a lot of effort and time, so the content and message should always be the primary focus. The visuals of the PowerPoint can enhance the presenters message, so our Online Advertising Firm Business Profile Normalized Profit After Tax Microsoft PDF was created to help save time. Instead of worrying about the design, the presenter can concentrate on the message while our designers work on creating the ideal templates for whatever situation is needed. Slidegeeks has experts for everything from amazing designs to valuable content, we have put everything into Online Advertising Firm Business Profile Normalized Profit After Tax Microsoft PDF
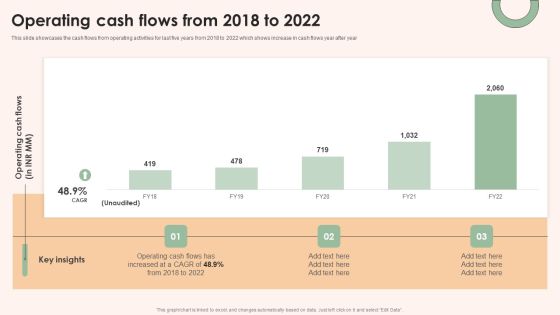
Online Advertising Firm Business Profile Operating Cash Flows From 2018 To 2022 Designs PDF
This slide showcases the cash flows from operating activities for last five years from 2018 to 2022 which shows increase in cash flows year after year Coming up with a presentation necessitates that the majority of the effort goes into the content and the message you intend to convey. The visuals of a PowerPoint presentation can only be effective if it supplements and supports the story that is being told. Keeping this in mind our experts created Online Advertising Firm Business Profile Operating Cash Flows From 2018 To 2022 Designs PDF to reduce the time that goes into designing the presentation. This way, you can concentrate on the message while our designers take care of providing you with the right template for the situation.
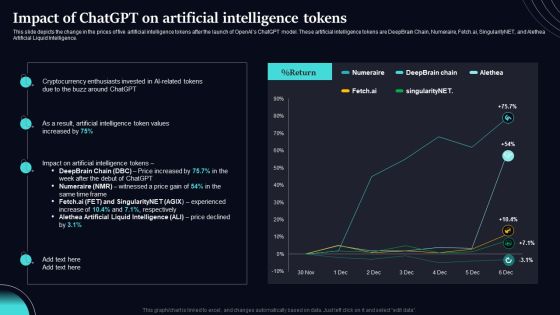
Regenerative Artificial Intelligence Systems Impact Of Chatgpt On Artificial Intelligence Tokens Diagrams PDF
This slide depicts the change in the prices of five artificial intelligence tokens after the launch of OpenAIs ChatGPT model. These artificial intelligence tokens are DeepBrain Chain, Numeraire, Fetch.ai, SingularityNET, and Alethea Artificial Liquid Intelligence. Coming up with a presentation necessitates that the majority of the effort goes into the content and the message you intend to convey. The visuals of a PowerPoint presentation can only be effective if it supplements and supports the story that is being told. Keeping this in mind our experts created Regenerative Artificial Intelligence Systems Impact Of Chatgpt On Artificial Intelligence Tokens Diagrams PDF to reduce the time that goes into designing the presentation. This way, you can concentrate on the message while our designers take care of providing you with the right template for the situation.

Chatgpt Incorporation Into Web Apps Impact Of Chatgpt On Artificial Intelligence Tokens Topics PDF
This slide depicts the change in the prices of five artificial intelligence tokens after the launch of OpenAIs ChatGPT model. These artificial intelligence tokens are DeepBrain Chain, Numeraire, Fetch.ai, SingularityNET, and Alethea Artificial Liquid Intelligence. Slidegeeks is one of the best resources for PowerPoint templates. You can download easily and regulate Chatgpt Incorporation Into Web Apps Impact Of Chatgpt On Artificial Intelligence Tokens Topics PDF for your personal presentations from our wonderful collection. A few clicks is all it takes to discover and get the most relevant and appropriate templates. Use our Templates to add a unique zing and appeal to your presentation and meetings. All the slides are easy to edit and you can use them even for advertisement purposes.

Kubler Ross Framework For Managing Change Effectively Rules PDF
This slide provides glimpse about Kubler Ross framework that can help business in minimizing resistance to change management. It includes five stages such as denial, anger, bargaining, depression, acceptance, etc. Coming up with a presentation necessitates that the majority of the effort goes into the content and the message you intend to convey. The visuals of a PowerPoint presentation can only be effective if it supplements and supports the story that is being told. Keeping this in mind our experts created Kubler Ross Framework For Managing Change Effectively Rules PDF to reduce the time that goes into designing the presentation. This way, you can concentrate on the message while our designers take care of providing you with the right template for the situation.

SEO Audit Process Of The SEO Audit Procedure And Strategies Ppt Professional Example PDF
The slide shows the steps and procedure involved in the successful SEO Audit Process of the company that must be followed and implemented in order to develop a prioritized action plan to improve organic search results. This is a SEO Audit Process Of The SEO Audit Procedure And Strategies Ppt Professional Example PDF template with various stages. Focus and dispense information on five stages using this creative set, that comes with editable features. It contains large content boxes to add your information on topics like Benchmark Rankings Understand, Inspect Duplicate Version, Check Manual Actions, Analyze Sites Speed. You can also showcase facts, figures, and other relevant content using this PPT layout. Grab it now.
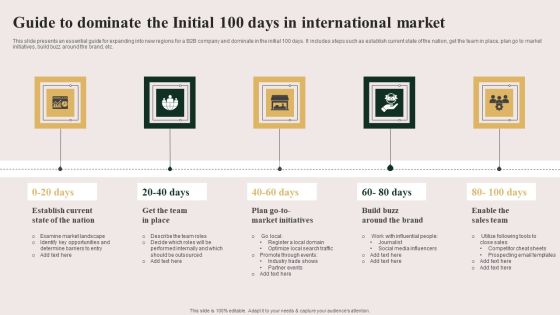
Guide To Dominate The Initial 100 Days In International Market Infographics PDF
This slide presents an essential guide for expanding into new regions for a B2B company and dominate in the initial 100 days. It includes steps such as establish current state of the nation, get the team in place, plan go to market initiatives, build buzz around the brand, etc. Persuade your audience using this Guide To Dominate The Initial 100 Days In International Market Infographics PDF. This PPT design covers five stages, thus making it a great tool to use. It also caters to a variety of topics including Place, Nation, Initiatives. Download this PPT design now to present a convincing pitch that not only emphasizes the topic but also showcases your presentation skills.

Social Networks Marketing Agency Investor Financing Elevator Pitch Deck One Stop Solution Ideas PDF
Purpose of the following slide is to show the solution for multiple problems that are identified by the organization , these solution can be creating engaging software for organization, having team of experienced professionals and providing customer with integrated solutionThis is a social networks marketing agency investor financing elevator pitch deck one stop solution ideas pdf template with various stages. Focus and dispense information on five stages using this creative set, that comes with editable features. It contains large content boxes to add your information on topics like engaging and analytical, website engagement, experience in digital marketing You can also showcase facts, figures, and other relevant content using this PPT layout. Grab it now.
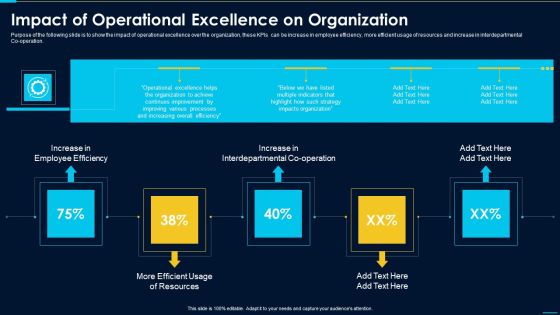
Impact Of Operational Excellence On Organization Background PDF
Increase in Employee Efficiency, Increase in Interdepartmental, Co operation Efficient Purpose of the following slide is to show the impact of operational excellence over the organization, these KPIs can be increase in employee efficiency, more efficient usage of resources and increase in interdepartmental Co operation.This is a impact of operational excellence on organization background pdf template with various stages. Focus and dispense information on five stages using this creative set, that comes with editable features. It contains large content boxes to add your information on topics like identify gaps in the strategy, decide upon strategies, defining key metrics You can also showcase facts, figures, and other relevant content using this PPT layout. Grab it now.

Internal Promotion Strategy To Enhance Brand Awareness Internal Marketing Strategy Development Process Professional PDF
This slide shows flowchart which can be used by the organizations to develop internal marketing strategy. It includes five stages such as identify stakeholders, determine marketing message, formulate internal marketing tactics, etc Are you in need of a template that can accommodate all of your creative concepts This one is crafted professionally and can be altered to fit any style. Use it with Google Slides or PowerPoint. Include striking photographs, symbols, depictions, and other visuals. Fill, move around, or remove text boxes as desired. Test out color palettes and font mixtures. Edit and save your work, or work with colleagues. Download Internal Promotion Strategy To Enhance Brand Awareness Internal Marketing Strategy Development Process Professional PDF and observe how to make your presentation outstanding. Give an impeccable presentation to your group and make your presentation unforgettable.
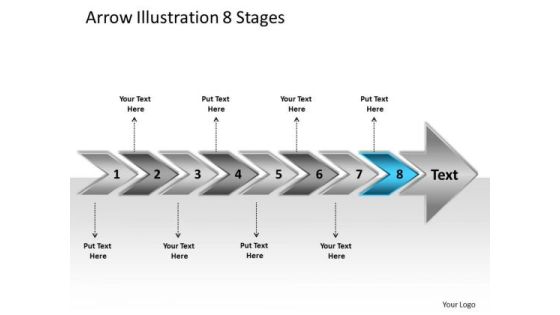
Arrow Illustration 8 Stages Online Flowchart PowerPoint Templates
We present our arrow illustration 8 stages online flowchart PowerPoint templates. Use our Arrows PowerPoint Templates because; Break it all down to Key Result Areas. Use our Business PowerPoint Templates because, you have what it takes to grow. Use our Shapes PowerPoint Templates because, Expound on how you plan to gain their confidence and assure them of continued and consistent excellence in quality of service. Use our Finance PowerPoint Templates because, Bullet-point your thoughts and ideas to profitably accomplish every step of every stage along the way. Use our Process and Flows PowerPoint Templates because, Activities which in themselves have many inherent business opportunities. Use these PowerPoint slides for presentations relating to 3d arrow background bullet business chart checkmark chevron diagram drop eps10 financial five glass graphic gray icon illustration management point process project reflection set shadow stage text transparency vector white. The prominent colors used in the PowerPoint template are Blue, Gray, and Black

Arrow Illustration 8 Stages Open Source Flowchart PowerPoint Slides
We present our arrow illustration 8 stages open source flowchart PowerPoint Slides. Use our Arrows PowerPoint Templates because, coincidentally it always points to the top. Use our Business PowerPoint Templates because; now funnel your marketing strategies down the cone, stage by stage, refining as you go along. Use our Shapes PowerPoint Templates because, Amplify on your plans to have dedicated sub groups working on related but distinct tasks. Use our Finance PowerPoint Templates because, There are different paths to gain the necessary knowledge to achieved it. Use our Process and Flows PowerPoint Templates because; Take your team along by explaining your plans. Use these PowerPoint slides for presentations relating to 3d arrow background bullet business chart checkmark chevron diagram drop eps10 financial five glass graphic gray icon illustration management point process project reflection set shadow stage text transparency vector white. The prominent colors used in the PowerPoint template are Purple, Gray, and Black
 Home
Home