AI PPT Maker
Templates
PPT Bundles
Design Services
Business PPTs
Business Plan
Management
Strategy
Introduction PPT
Roadmap
Self Introduction
Timelines
Process
Marketing
Agenda
Technology
Medical
Startup Business Plan
Cyber Security
Dashboards
SWOT
Proposals
Education
Pitch Deck
Digital Marketing
KPIs
Project Management
Product Management
Artificial Intelligence
Target Market
Communication
Supply Chain
Google Slides
Research Services
 One Pagers
All Categories
-
Home
- Customer Favorites
- Linear Process
Linear Process

Clustered Bar Chart Percentage Product Ppt PowerPoint Presentation Portfolio Example Introduction
This is a clustered bar chart percentage product ppt powerpoint presentation portfolio example introduction. This is a three stage process. The stages in this process are area chart, finance, marketing, management, investment.
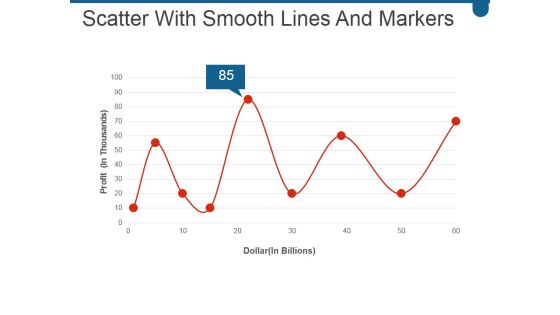
Scatter With Smooth Lines And Markers Ppt PowerPoint Presentation Professional Visual Aids
This is a scatter with smooth lines and markers ppt powerpoint presentation professional visual aids. This is a nine stage process. The stages in this process are business, marketing, success, growth, line.
Green Arrows On Bars Vector Icon Ppt PowerPoint Presentation Infographic Template Templates Cpb
This is a green arrows on bars vector icon ppt powerpoint presentation infographic template templates cpb. This is a three stage process. The stages in this process are bar chart icon, bar graph icon, data chart icon.
Three Bars For Financial Analysis Vector Icon Ppt PowerPoint Presentation Pictures Background Cpb
This is a three bars for financial analysis vector icon ppt powerpoint presentation pictures background cpb. This is a three stage process. The stages in this process are bar chart icon, bar graph icon, data chart icon.

Quantitative Bar Chart For Data Analysis Ppt PowerPoint Presentation Model Graphic Tips
This is a quantitative bar chart for data analysis ppt powerpoint presentation model graphic tips. This is a two stage process. The stages in this process are financial analysis, quantitative, statistical modelling.

Business Outcomes Analysis Business Man With Pie Bar And Line Chart Ppt Powerpoint Presentation Infographics Visual Aids
This is a business outcomes analysis business man with pie bar and line chart ppt powerpoint presentation infographics visual aids. This is a three stage process. The stages in this process are business outcomes, business results, business output.

Buyers Journey Template 1 Ppt PowerPoint Presentation Gallery Slides
This is a buyers journey template 1 ppt powerpoint presentation gallery slides. This is a five stage process. The stages in this process are discover, explore, evaluate, engage, buy.
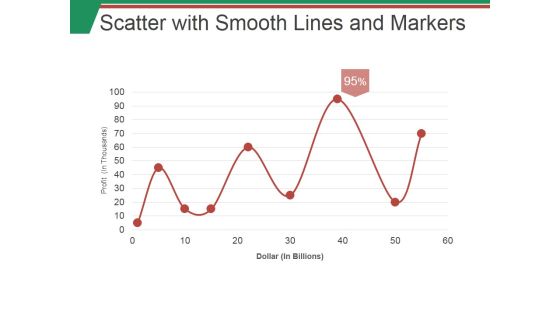
Scatter With Smooth Lines And Markers Ppt PowerPoint Presentation Infographic Template Images
This is a scatter with smooth lines and markers ppt powerpoint presentation infographic template images. This is a nine stage process. The stages in this process are business, marketing, finance, planning, success.

Scatter With Smooth Lines And Markers Ppt PowerPoint Presentation Ideas Deck
This is a scatter with smooth lines and markers ppt powerpoint presentation ideas deck. This is a one stage process. The stages in this process are profit, dollar, percentage, business, growth.

Scatter With Smooth Lines And Markers Ppt PowerPoint Presentation Diagram Lists
This is a scatter with smooth lines and markers ppt powerpoint presentation diagram lists. This is a two stage process. The stages in this process are finance, marketing, analysis, business, investment.

Clustered Column Line Investment Ppt PowerPoint Presentation Infographic Template File Formats
This is a clustered column line investment ppt powerpoint presentation infographic template file formats. This is a three stage process. The stages in this process are finance, analysis, business, investment, marketing.
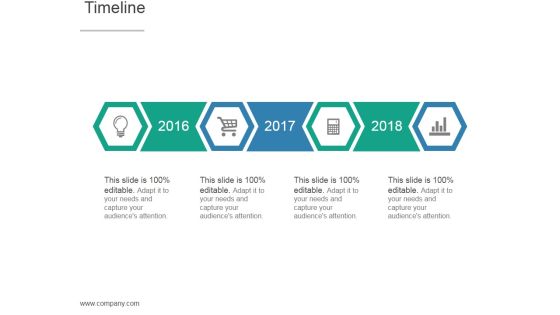
Timeline Ppt PowerPoint Presentation Slides
This is a timeline ppt powerpoint presentation slides. This is a four stage process. The stages in this process are installation, features, brand name, delivery and credit, packaging, design, after sale service, core product or service, quality level, warranty.

Timeline Ppt PowerPoint Presentation Show
This is a timeline ppt powerpoint presentation show. This is a five stage process. The stages in this process are being aware of opportunity, setting objective or goals , considering planning premises, identifying alternative, choosing an alternative.

Boosting Machine Learning 10 AI Trend In 2020 Ppt PowerPoint Presentation Show Graphic Tips PDF
Presenting this set of slides with name boosting machine learning 10 ai trend in 2020 ppt powerpoint presentation show graphic tips pdf. This is a ten stage process. The stages in this process are robotic process automation, ai healthcare more accurate, data modeling edge, ai come b2b, ai powered chatbots, automated business process, advanced cybersecurity, ai mediated media and entertainment. This is a completely editable PowerPoint presentation and is available for immediate download. Download now and impress your audience.

Customer Manager Timeline Powerpoint Slides
This is a customer manager timeline powerpoint slides. This is a six stage process. The stages in this process are inventory management, products sales, product inventory, suppliers manager, products purchase, customer manager.
Financial Graph Economic Growth Vector Icon Ppt PowerPoint Presentation Infographics Graphic Images Cpb
This is a financial graph economic growth vector icon ppt powerpoint presentation infographics graphic images cpb. This is a three stage process. The stages in this process are bar chart icon, bar graph icon, data chart icon.
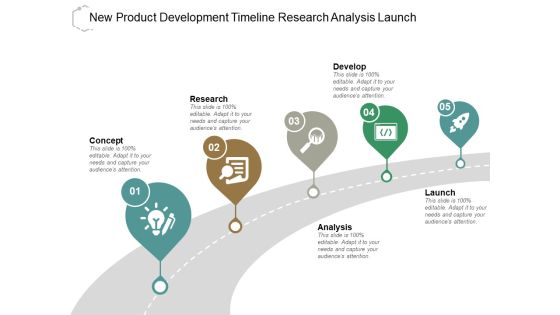
New Product Development Timeline Research Analysis Launch Ppt PowerPoint Presentation Layouts Skills
This is a new product development timeline research analysis launch ppt powerpoint presentation layouts skills. This is a five stage process. The stages in this process are product launch roadmap, introducing new product roadmap, product launch timeline.

Business Diagnostics Timeline Powerpoint Templates
This is a business diagnostics timeline powerpoint templates. This is a five stage process. The stages in this process are managing channel partners, joint business planning, business diagnostics, market coverage strategy, vales relationships.

Strategic Product Timeline Roadmap Ppt Presentation Visuals
This is a strategic product timeline roadmap ppt presentation visuals. This is a five stage process. The stages in this process are advanced reporting, concept, payroll capabilities, product, member portal.
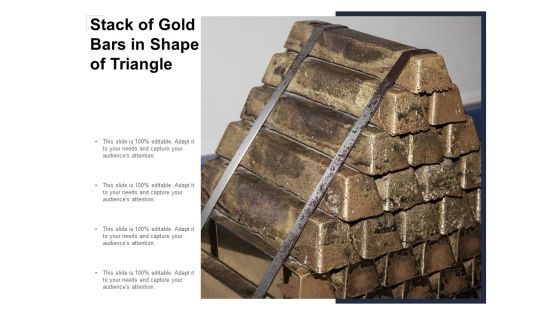
Stack Of Gold Bars In Shape Of Triangle Ppt Powerpoint Presentation Infographic Template Guidelines
This is a stack of gold bars in shape of triangle ppt powerpoint presentation infographic template guidelines. This is a four stage process. The stages in this process are stacked bar, pile bar, heap bar.

Clustered Column Line Ppt PowerPoint Presentation Summary Styles
This is a clustered column line ppt powerpoint presentation summary styles. This is a four stage process. The stages in this process are bar graph, business, marketing, growth, success.

Clustered Column Line Ppt PowerPoint Presentation Summary Slides
This is a clustered column line ppt powerpoint presentation summary slides. This is a four stage process. The stages in this process are bar graph, growth, success, business, marketing.

Clustered Column Line Graph Ppt PowerPoint Presentation File Clipart
This is a clustered column line graph ppt powerpoint presentation file clipart. This is a three stage process. The stages in this process are finance, marketing, management, investment, analysis.

Clustered Column Line Graph Ppt PowerPoint Presentation Ideas Demonstration
This is a clustered column line graph ppt powerpoint presentation ideas demonstration. This is a three stage process. The stages in this process are financial, minimum, maximum, marketing, strategy.

Clustered Column Line Graph Ppt PowerPoint Presentation Inspiration Deck
This is a clustered column line graph ppt powerpoint presentation inspiration deck. This is a three stage process. The stages in this process are finance, marketing, analysis, investment, million.

Company Timeline For Continuous Improvement Ppt PowerPoint Presentation Slide
This is a company timeline for continuous improvement ppt powerpoint presentation slide. This is a five stage process. The stages in this process are company, timeline, strategy, management, success.

Business Capital Investors Graph Powerpoint Presentation
This is a business capital investors graph powerpoint presentation. This is a five stage process. The stages in this process are public, venture capital, seed capital, angles, grants f and f$.

Staked Bar Planning Business Ppt PowerPoint Presentation Infographic Template Infographic Template
This is a staked bar planning business ppt powerpoint presentation infographic template infographic template. This is a three stage process. The stages in this process are finance, marketing, analysis, business, investment.
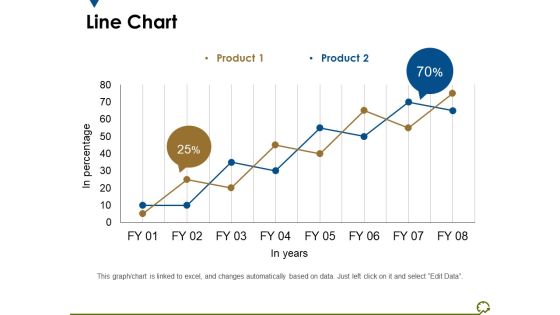
Line Chart Ppt PowerPoint Presentation Outline Diagrams
This is a line chart ppt powerpoint presentation outline diagrams. This is a two stage process. The stages in this process are in percentage, in years, percentage, business, marketing.
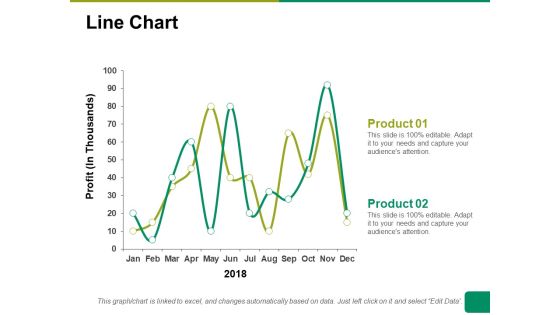
Line Chart Ppt PowerPoint Presentation Summary Ideas
This is a line chart ppt powerpoint presentation summary ideas. This is a two stage process. The stages in this process are line chart, profit, product, financial years, business.
Marketing Communication Timeline Ppt PowerPoint Presentation Icon
This is a marketing communication timeline ppt powerpoint presentation icon. This is a five stage process. The stages in this process are developing marketing communication program, marketing communication plan, evaluation and control of marketing, budget planning, situational analysis.
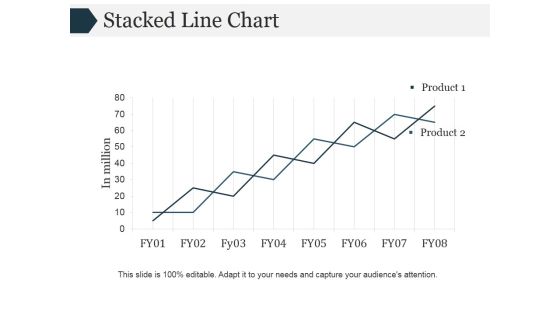
Stacked Line Chart Ppt PowerPoint Presentation Inspiration
This is a stacked line chart ppt powerpoint presentation inspiration. This is a two stage process. The stages in this process are stacked line chart, growth, analysis, management, business.
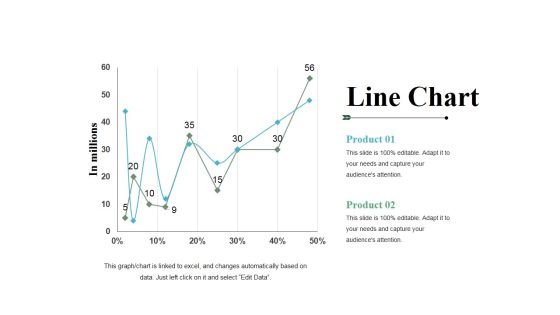
Line Chart Ppt PowerPoint Presentation File Templates
This is a line chart ppt powerpoint presentation file templates. This is a two stage process. The stages in this process are product, line chart, growth, percentage, in millions.

Line Chart Ppt PowerPoint Presentation Infographics Infographics
This is a line chart ppt powerpoint presentation infographics infographics. This is a two stage process. The stages in this process are product, sales in percentage, financial year, line chart, finance.

Line Chart Ppt PowerPoint Presentation Inspiration Graphics
This is a line chart ppt powerpoint presentation inspiration graphics. This is a two stage process. The stages in this process are line chart, growth, percentage, marketing, analysis, business.

Line Chart Ppt PowerPoint Presentation Portfolio Portrait
This is a line chart ppt powerpoint presentation portfolio portrait. This is a two stage process. The stages in this process are line chart, growth, analysis, marketing, strategy, business.

Line Chart Ppt PowerPoint Presentation Gallery Rules
This is a line chart ppt powerpoint presentation gallery rules. This is a two stage process. The stages in this process are financial years, product, sales in percentage, line chart, growth.
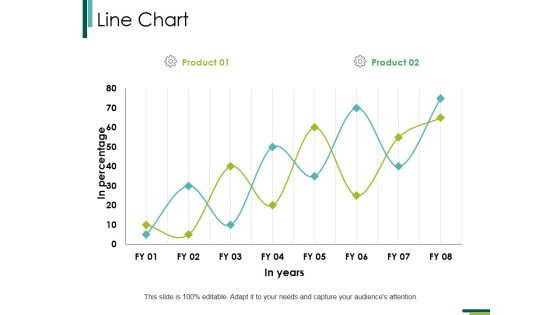
Line Chart Ppt PowerPoint Presentation Professional Examples
This is a line chart ppt powerpoint presentation professional examples. This is a two stage process. The stages in this process are line chart, analysis, growth, marketing, strategy, business.

Line Chart Ppt PowerPoint Presentation Gallery Templates
This is a line chart ppt powerpoint presentation gallery templates. This is a two stage process. The stages in this process are product, financial years, sales in percentage, line chart.

Business Timeline Ppt PowerPoint Presentation Professional Microsoft
This is a business timeline ppt powerpoint presentation professional microsoft. This is a six stage process. The stages in this process are business timeline, timetable, planning, marketing, strategy, time management.

Project Events Timeline Ppt PowerPoint Presentation Guide
This is a project events timeline ppt powerpoint presentation guide. This is a five stage process. The stages in this process are timeline, growth strategy, icons, planning, management, business, event.
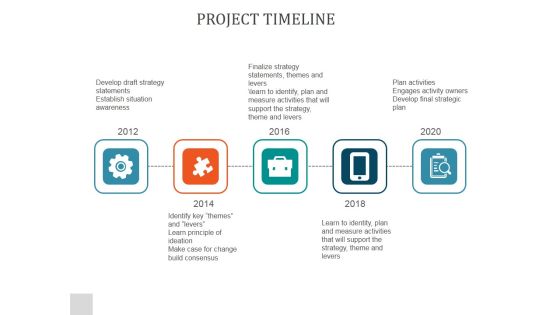
Project Timeline Ppt PowerPoint Presentation Example File
This is a project timeline ppt powerpoint presentation example file. This is a five stage process. The stages in this process are timeline, business, planning, management, growth strategy, success.

Business Timeline Ppt PowerPoint Presentation Model Images
This is a business timeline ppt powerpoint presentation model images. This is a five stages process. The stages in this process are business timeline, time management, planning, strategy, marketing.
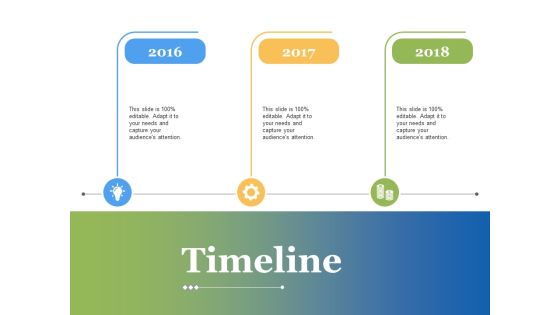
Timeline Ppt PowerPoint Presentation Inspiration Graphic Tips
This is a timeline ppt powerpoint presentation inspiration graphic tips. This is a three stage process. The stages in this process are timeline, time management, time table, planning, strategy.

Stacked Line Chart Ppt PowerPoint Presentation Shapes
This is a stacked line chart ppt powerpoint presentation shapes. This is a two stage process. The stages in this process are product, profit in thousands, finance, analysis, growth.

Line Chart Ppt PowerPoint Presentation Layouts Professional
This is a line chart ppt powerpoint presentation layouts professional. This is a two stage process. The stages in this process are in percentage, product, in years, strategy, marketing, business.
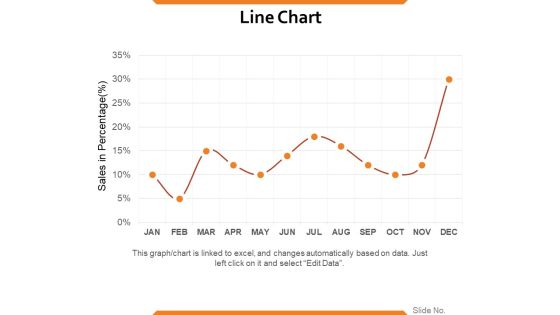
Line Chart Ppt PowerPoint Presentation Summary Samples
This is a line chart ppt powerpoint presentation summary samples. This is a one stage process. The stages in this process are sales in percentage, percentage, business, marketing, strategy.
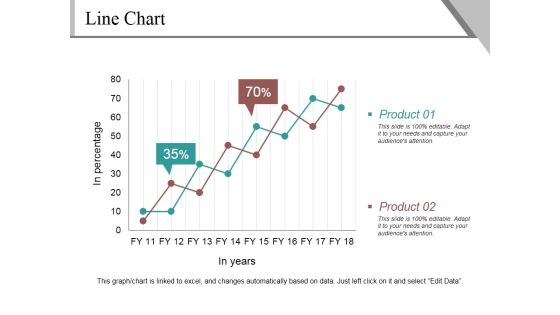
Line Chart Ppt PowerPoint Presentation Infographics Example
This is a line chart ppt powerpoint presentation infographics example. This is a two stage process. The stages in this process are product, in percentage, in years, finance, growth.

Line Chart Ppt PowerPoint Presentation Layouts Example
This is a line chart ppt powerpoint presentation layouts example. This is a two stage process. The stages in this process are sales in percentage, product, financial years, growth, success.
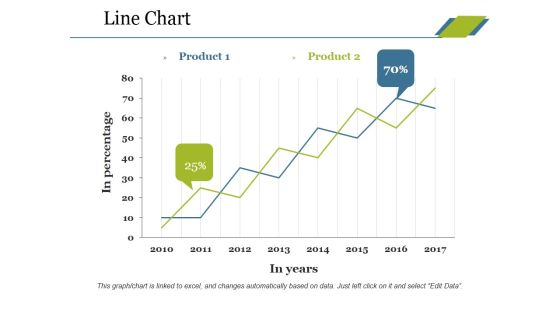
Line Chart Ppt PowerPoint Presentation Professional Tips
This is a line chart ppt powerpoint presentation professional tips. This is a two stage process. The stages in this process are product, in percentage, in years, growth, success.

Line Chart Ppt PowerPoint Presentation Slides Ideas
This is a line chart ppt powerpoint presentation slides ideas. This is a two stage process. The stages in this process are product, in percentage, in years, growth, success.

Line Chart Ppt PowerPoint Presentation Show Guide
This is a line chart ppt powerpoint presentation show guide. This is a two stage process. The stages in this process are product, sales in percentage, financial years, growth, success.

Line Chart Ppt PowerPoint Presentation Slides Mockup
This is a line chart ppt powerpoint presentation slides mockup. This is a two stage process. The stages in this process are in percentage, in years, product, growth, success.

Bar Graph Ppt PowerPoint Presentation Outline File Formats
This is a bar graph ppt powerpoint presentation outline file formats. This is a nine stage process. The stages in this process are bar graph, business, management, success, strategy.

Timeline Continue Ppt PowerPoint Presentation Designs Download
This is a timeline continue ppt powerpoint presentation designs download. This is a two stage process. The stages in this process are business, strategy, marketing, success, analysis, time line.

Business Mission Timeline Powerpoint Templates
This is a business mission timeline powerpoint templates. This is a four stage process. The stages in this process are business mission, business goals, social media goals, department goals.

Data Access Timeline Ppt Slides
This is a data access timeline ppt slides. This is a five stage process. The stages in this process are data access, customer report, model building and evaluation, problem definition, external applications.
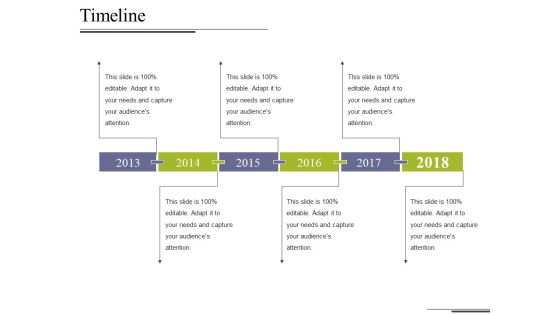
Timeline Ppt PowerPoint Presentation Model Portfolio
This is a path to career ppt powerpoint presentation infographic template display. This is a six stage process. The stages in this process are timelines, years, business, management, planning.

Bar Graph Finance Ppt PowerPoint Presentation Outline Background Designs
This is a bar graph finance ppt powerpoint presentation outline background designs. This is a three stage process. The stages in this process are financial, maximum, medium, minimum, marketing.

Bar Graph Ppt PowerPoint Presentation Model Graphic Tips
This is a bar graph ppt powerpoint presentation model graphic tips. This is a two stage process. The stages in this process are we are dollars in millions, financials years, bar graph, product, business.
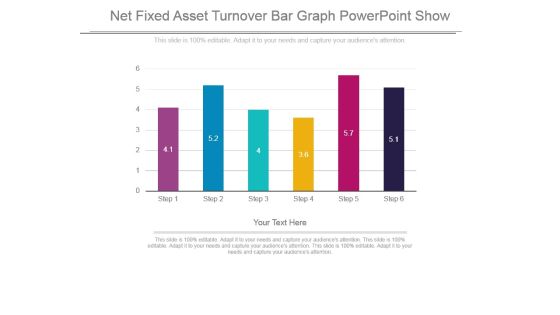
Net Fixed Asset Turnover Bar Graph Powerpoint Show
This is a net fixed asset turnover bar graph powerpoint show. This is a six stage process. The stages in this process are bar graph, presentation, strategy, business, management.

Profit Growth Bar Graph Over The Years Powerpoint Slide Graphics
This is a profit growth bar graph over the years powerpoint slide graphics. This is a four stage process. The stages in this process are bar graph, arrows, years, business, growth, marketing.

Revenue Growth For Bar Graph Ppt Examples Slides
This is a revenue growth for bar graph ppt examples slides. This is a five stage process. The stages in this process are bar graph, years, business, growth, marketing.

Bar Graph With Total Profit Analysis Ppt Images
This is a bar graph with total profit analysis ppt images. This is a nine stage process. The stages in this process are bar graph, business, marketing, growth, success.
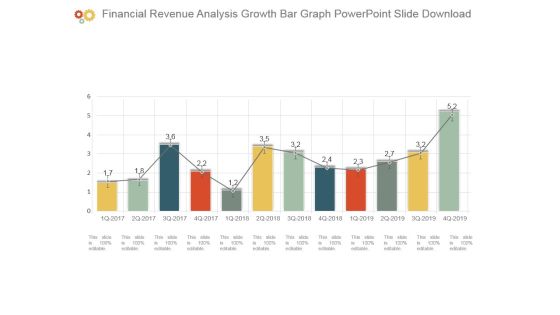
Financial Revenue Analysis Growth Bar Graph Powerpoint Slide Download
This is a financial revenue analysis growth bar graph powerpoint slide download. This is a twelve stage process. The stages in this process are bar graph, business, marketing, growth, success.

Bar Graph Ppt PowerPoint Presentation Icon Clipart Images
This is a bar graph ppt powerpoint presentation icon clipart images. This is a three stage process. The stages in this process are bar graph, finance, marketing, strategy, analysis.

Bar Graph Ppt PowerPoint Presentation Slides Background Image
This is a bar graph ppt powerpoint presentation slides background image. This is a six stage process. The stages in this process are bar graph, finance, marketing, analysis, business.

Bar Graph Ppt PowerPoint Presentation Infographics Slide Download
This is a bar graph ppt powerpoint presentation infographics slide download. This is a four stage process. The stages in this process are bar graph, finance, marketing, strategy, analysis.

Bar Graph Ppt PowerPoint Presentation Pictures Slide Portrait
This is a bar graph ppt powerpoint presentation pictures slide portrait. This is a four stage process. The stages in this process are bar graph, growth, success, business, marketing.

Bar Graph Ppt PowerPoint Presentation Infographic Template Graphics
This is a bar graph ppt powerpoint presentation infographic template graphics. This is a five stage process. The stages in this process are bar graph, finance, marketing, strategy, analysis, business.

Bar Graph Ppt PowerPoint Presentation Inspiration Format Ideas
This is a bar graph ppt powerpoint presentation inspiration format ideas. This is a four stage process. The stages in this process are bar graph, growth, success, business, marketing.

Bar Graph Ppt PowerPoint Presentation Ideas Graphic Tips
This is a bar graph ppt powerpoint presentation ideas graphic tips. This is a three stage process. The stages in this process are financial year, sales in percentage, product, bar graph, growth.

Bar Graph Ppt PowerPoint Presentation Model Graphics Design
This is a bar graph ppt powerpoint presentation model graphics design. This is a four stage process. The stages in this process are bar graph, growth, success, business, marketing.

Bar Graph Ppt PowerPoint Presentation Infographic Template Demonstration
This is a bar graph ppt powerpoint presentation infographic template demonstration. This is a two stage process. The stages in this process are bar graph, product, sales, percentage, financial.
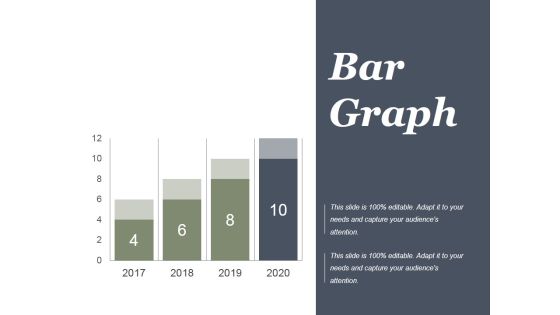
Project Performance Bar Graph Ppt PowerPoint Presentation Outline
This is a project performance bar graph ppt powerpoint presentation outline. This is a four stage process. The stages in this process are finance, year, business, marketing, future, marketing.

Bar Graph With Red Progressive Arrow Ppt PowerPoint Presentation Outline
This is a bar graph with red progressive arrow ppt powerpoint presentation outline. This is a three stage process. The stages in this process are rising arrow, growing arrow, increasing arrow.
Project Timeline Approval Check Point And Training Ppt PowerPoint Presentation Icon Grid
This is a project timeline approval check point and training ppt powerpoint presentation icon grid. This is a eight stage process. The stages in this process are office timeline, office roadmap, office schedule.

Situational Analysis Communication Plan Timeline Powerpoint Slide
This is a situational analysis communication plan timeline powerpoint slide. This is a five stage process. The stages in this process are developing marketing communication program, marketing communication plan, evaluation and control of marketing, budget planning, situational analysis.

Timeline Ppt PowerPoint Presentation Ideas Background Image
This is a timeline ppt powerpoint presentation ideas background image. This is a five stage process. The stages in this process are business, strategy, analysis, marketing, time line, time management.

Project Events Timeline Ppt PowerPoint Presentation Slides
This is a project events timeline ppt powerpoint presentation slides. This is a five stage process. The stages in this process are business, strategy, marketing, analysis, success, icons, time planning.
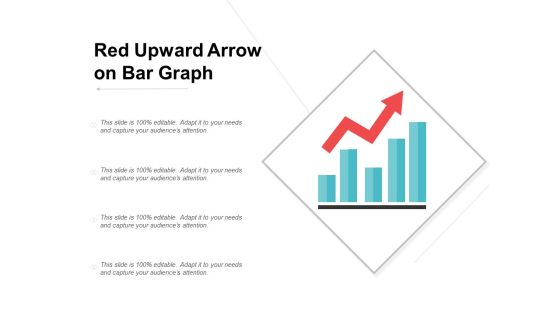
Red Upward Arrow On Bar Graph Ppt Powerpoint Presentation Infographics
This is a red upward arrow on bar graph ppt powerpoint presentation infographics. This is a four stage process. The stages in this process are increasing arrows, improving arrows, growing arrows.

Target Achievement Roadmap Timeline Ppt Example File
This is a target achievement roadmap timeline ppt example file. This is a three stage process. The stages in this process are 200 stores, partners in 25 countries, product ready.

My Values And Skills Timeline Powerpoint Slide Backgrounds
This is a my values and skills timeline powerpoint slide backgrounds. This is a seven stage process. The stages in this process are simplicity, balance, endeavor, learning, courage, family, integrity.

Product Comparison Data Bar Graph Ppt Powerpoint Presentation Slides Show
This is a product comparison data bar graph ppt powerpoint presentation slides show. This is a four stage process. The stages in this process are data presentation, content presentation, information presentation.

Magnifier With Tools And Bar Graph Ppt PowerPoint Presentation Diagrams
This is a magnifier with tools and bar graph ppt powerpoint presentation diagrams. This is a four stage process. The stages in this process are magnifier, strategy, search, business, management.

Clustered Bar Graph Ppt PowerPoint Presentation Pictures Example File
This is a clustered bar graph ppt powerpoint presentation pictures example file. This is a two stage process. The stages in this process are finance, marketing, management, investment, analysis.

Bar Graph Financial Sales Product Ppt PowerPoint Presentation Icon Vector
This is a bar graph financial sales product ppt powerpoint presentation icon vector. This is a five stage process. The stages in this process are business, management, financial, marketing, sales.

Bar Graph Employee Value Proposition Ppt PowerPoint Presentation File Layout
This is a bar graph employee value proposition ppt powerpoint presentation file layout. This is a three stage process. The stages in this process are business, management, strategy, analysis, marketing.

Stacked Bar Graph Ppt PowerPoint Presentation Portfolio Slide Portrait
This is a stacked bar graph ppt powerpoint presentation portfolio slide portrait. This is a three stage process. The stages in this process are finance, marketing, management, investment, analysis.

Clustered Bar Graph Ppt PowerPoint Presentation Model Background Designs
This is a clustered bar graph ppt powerpoint presentation model background designs. This is a three stage process. The stages in this process are finance, marketing, management, investment, analysis.
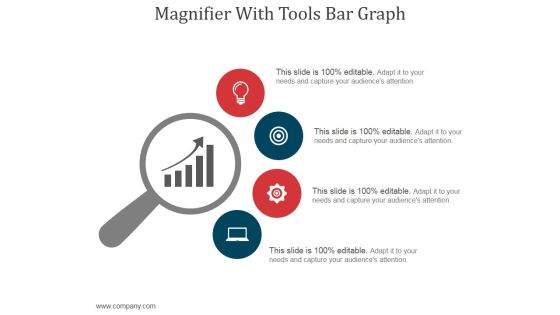
Magnifier With Tools Bar Graph Ppt PowerPoint Presentation Professional
This is a magnifier with tools bar graph ppt powerpoint presentation professional. This is a four stage process. The stages in this process are magnifier, business, marketing, strategy, icons.

Financial Crisis Bar Graphs Ppt PowerPoint Presentation Background Images
This is a financial crisis bar graphs ppt powerpoint presentation background images. This is a twelve stage process. The stages in this process are business, analysis, strategy, finance, success, management.

Bar Graph Finance Ppt PowerPoint Presentation Infographics Designs Download
This is a bar graph finance ppt powerpoint presentation infographics designs download. This is a three stage process. The stages in this process are finance, marketing, management, investment, analysis.

Bar Graph For Changes In Competitive Environment Example Of Ppt
This is a bar graph for changes in competitive environment example of ppt. This is a four stage process. The stages in this process are engagement, brand, monthly, weekly.

Hiring Plan Bar Graph With Categories Powerpoint Slide Graphics
This is a hiring plan bar graph with categories powerpoint slide graphics. This is a five stage process. The stages in this process are finance, support, product, marketing, sales, engineering.
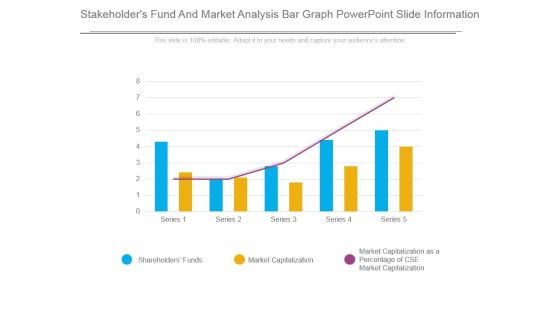
Stakeholders Fund And Market Analysis Bar Graph Powerpoint Slide Information
This is a stakeholders fund and market analysis bar graph powerpoint slide information. This is a five stage process. The stages in this process are shareholders funds, market capitalization, market capitalization as a percentage of cse market capitalization.

Inflation Rate Analysis Bar Graph Powerpoint Slide Backgrounds
This is a inflation rate analysis bar graph powerpoint slide backgrounds. This is a twelve stage process. The stages in this process are jan, feb, mar, apr, may, jun, jul, aug, sep, oct, nov, dec.

Bar Graph To Showcase Financial Analysis Ppt PowerPoint Presentation Professional
This is a bar graph to showcase financial analysis ppt powerpoint presentation professional. This is a four stage process. The stages in this process are business, marketing, growth, success, arrows.

Bar Graph Ppt PowerPoint Presentation Summary Infographic Template
This is a bar graph ppt powerpoint presentation summary infographic template. This is a seven stage process. The stages in this process are business, strategy, marketing, analysis, growth strategy.

Increase Brand Awarenes Timeline Powerpoint Presentation Examples
This is a increase brand awarenes timeline powerpoint presentation examples. This is a five stage process. The stages in this process are increase online engagement, increase leads generated, increase brand awareness, improve customer education, increase conversion rates.
Histogram Column Chart With Red Arrow Vector Icon Ppt PowerPoint Presentation Outline Ideas Cpb
This is a histogram column chart with red arrow vector icon ppt powerpoint presentation outline ideas cpb. This is a three stage process. The stages in this process are bar chart icon, bar graph icon, data chart icon.
Managing Timeline Projects Powerpoint Slide Background Picture
This is a managing projects powerpoint slide background picture. This is a five stage process. The stages in this process are close out projects, secure required resources, control project, develop project plans, project scope.
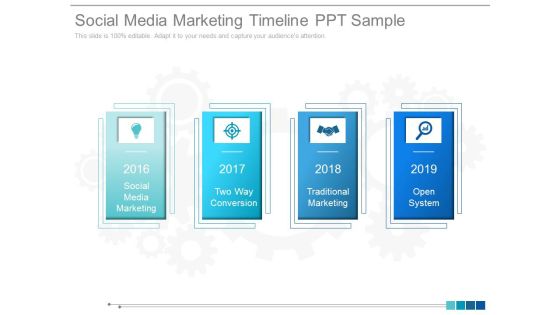
Social Media Marketing Timeline Ppt Sample
This is a social media marketing timeline ppt sample. This is a four stage process. The stages in this process are social media marketing, two way conversion, traditional marketing, open system.

Bar Chart Ppt PowerPoint Presentation Inspiration Demonstration
This is a bar chart ppt powerpoint presentation inspiration demonstration. This is a two stage process. The stages in this process are bar chart, financial years, sales in percentage, product, finance.

Bar Chart Ppt PowerPoint Presentation Model Picture
This is a bar chart ppt powerpoint presentation model picture. This is a two stage process. The stages in this process are product, sales in percentage, financial years, bar chart.

Bar Chart Ppt PowerPoint Presentation Icon Diagrams
This is a bar chart ppt powerpoint presentation icon diagrams. This is a two stage process. The stages in this process are bar chart, finance, analysis, business, marketing, strategy.
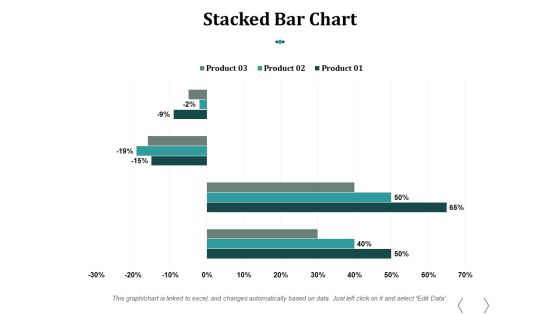
Stacked Bar Chart Ppt PowerPoint Presentation Influencers
This is a stacked bar chart ppt powerpoint presentation influencers. This is a three stage process. The stages in this process are stacked bar chart, product, percentage, finance, business.
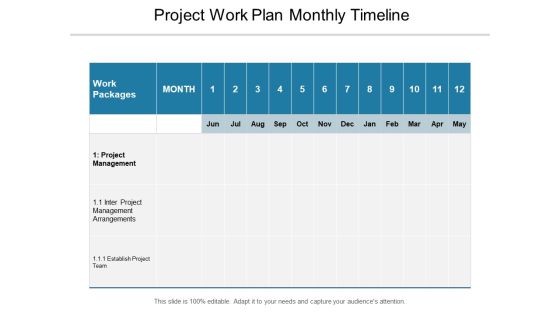
Project Work Plan Monthly Timeline Ppt PowerPoint Presentation File Layouts
This is a project work plan monthly timeline ppt powerpoint presentation file layouts. This is a twelve stage process. The stages in this process are work package timeline, work package roadmap, tasks package timelines.
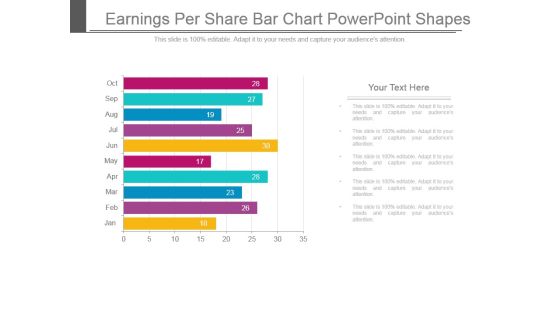
Earnings Per Share Bar Chart Powerpoint Shapes
This is a earnings per share bar chart powerpoint shapes. This is a ten stage process. The stages in this process are jan, feb, mar, apr, may, jun, jul, aug, sep, oct.

Bar Chart Ppt PowerPoint Presentation Portfolio Icons
This is a bar chart ppt powerpoint presentation portfolio icons. This is a seven stage process. The stages in this process are in years, in percentage, finance, business marketing.

Bar Chart Ppt PowerPoint Presentation Ideas Deck
This is a bar chart ppt powerpoint presentation ideas deck. This is a two stage process. The stages in this process are product, in percentage, in years, financial, business.

Analyze Existing Product Range Timeline Ppt Slides Download
This is a analyze existing product range timeline ppt slides download. This is a five stage process. The stages in this process are analyze existing product range, evaluate solution success, justify design change, identify prioritize research, suggest revision upgrades.
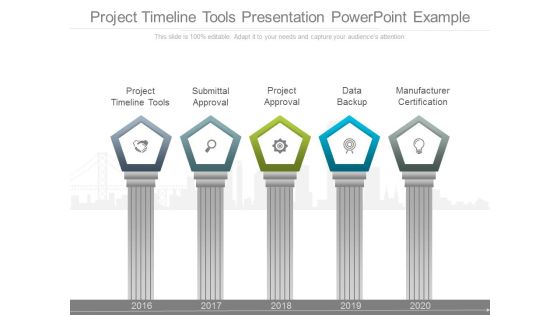
Project Timeline Tools Presentation Powerpoint Example
This is a project timeline tools presentation powerpoint example. This is a five stage process. The stages in this process are project timeline tools, submittal approval, project approval, data backup, manufacturer certification.

Timeline Sample Budget Ppt Ppt PowerPoint Presentation Infographics Elements
This is a timeline sample budget ppt ppt powerpoint presentation infographics elements. This is a six stage process. The stages in this process are business, management, strategy, analysis, timeline.

Growing Plants On Stack Of Coins For Money Growth Ppt Powerpoint Presentation Outline Display
This is a growing plants on stack of coins for money growth ppt powerpoint presentation outline display. This is a four stage process. The stages in this process are stacked bar, pile bar, heap bar.
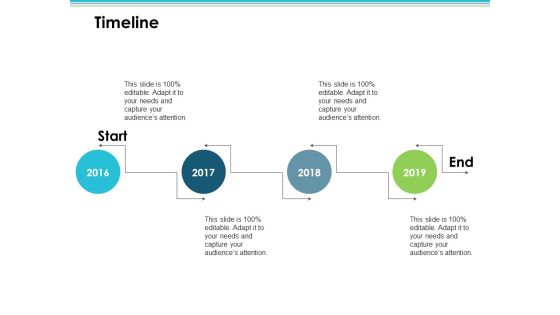
Timeline Employee Value Proposition Ppt PowerPoint Presentation Outline Slide Download
This is a timeline employee value proposition ppt powerpoint presentation outline slide download. This is a four stage process. The stages in this process are business, management, strategy, analysis, timeline.
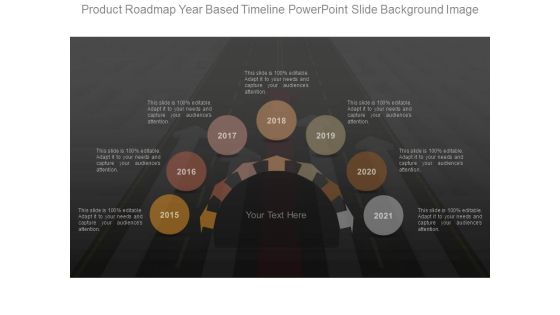
Product Roadmap Year Based Timeline Powerpoint Slide Background Image
This is a product roadmap year based timeline powerpoint slide background image. This is a seven stage process. The stages in this process are business, marketing, timeline, arrows, management.
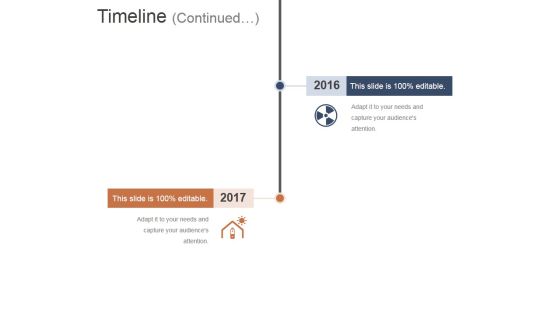
Timeline Template 3 Ppt PowerPoint Presentation Styles Graphics Template
This is a timeline template 3 ppt powerpoint presentation styles graphics template. This is a two stage process. The stages in this process are timeline, planning, business, success, management.
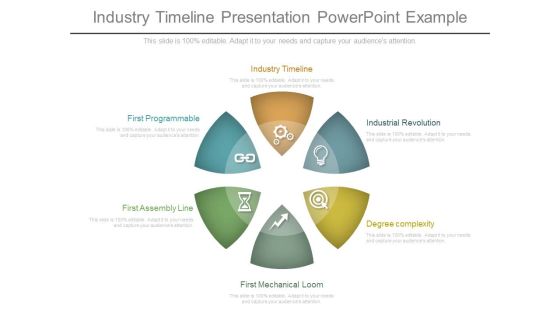
Industry Timeline Presentation Powerpoint Example
This is a Industry Timeline Presentation Powerpoint Example. This is a six stage process. The stages in this process are industry timeline, first programmable, first assembly line, first mechanical loom, industrial revolution, degree complexity.

Post Introduction Evaluation Ppt PowerPoint Presentation Professional
This is a post introduction evaluation ppt powerpoint presentation professional. This is a six stage process. The stages in this process are road map, people, timeline, road map, success.
