Limitations

Financial Projection Graph Slide2 Ppt PowerPoint Presentation Themes
This is a financial projection graph slide2 ppt powerpoint presentation themes. This is a five stage process. The stages in this process are year, total sales, gross, margin, net income

Development In Past 10 Years Template 1 Ppt PowerPoint Presentation Infographics
This is a development in past 10 years template 1 ppt powerpoint presentation infographics. This is a ten stage process. The stages in this process are net sales, other income, ebita margins, profit before tax, taxes.
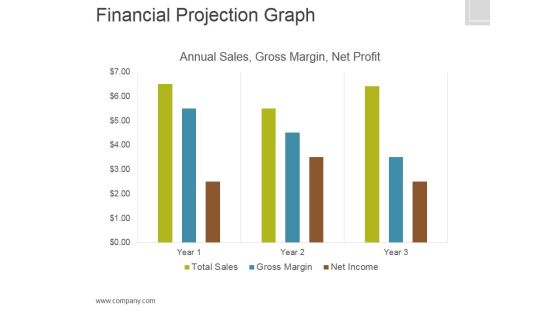
Financial Projection Graph Template 2 Ppt PowerPoint Presentation Graphics
This is a financial projection graph template 2 ppt powerpoint presentation graphics. This is a three stage process. The stages in this process are annual sales, gross margin, net profit, finance.
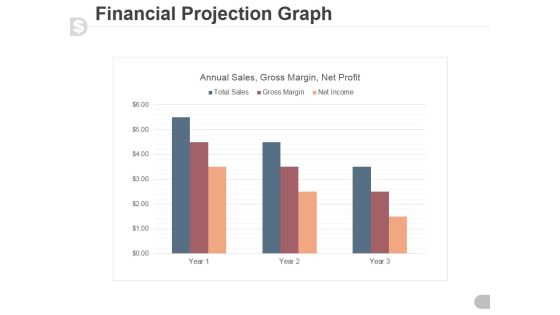
Financial Projection Graph Template 1 Ppt PowerPoint Presentation Guide
This is a financial projection graph template 1 ppt powerpoint presentation guide. This is a three stage process. The stages in this process are annual sales, gross margin, net profit.
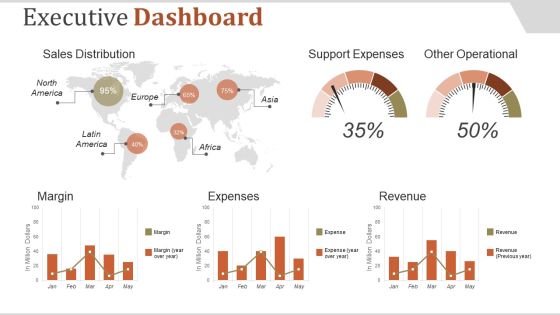
Executive Dashboard Ppt PowerPoint Presentation Introduction
This is a executive dashboard ppt powerpoint presentation introduction. This is a five stage process. The stages in this process are sales distribution, support expenses, other operational, margin, expenses.
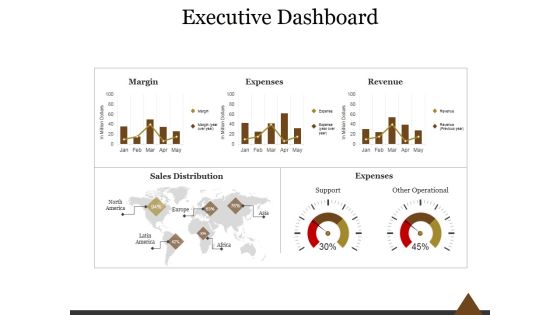
Executive Dashboard Ppt PowerPoint Presentation Professional
This is a executive dashboard ppt powerpoint presentation professional. This is a five stage process. The stages in this process are margin, expenses, revenue, sales distribution, expenses, support, other operational.

Financial Summary Ppt PowerPoint Presentation Ideas Slide Portrait
This is a financial summary ppt powerpoint presentation ideas slide portrait. This is a five stage process. The stages in this process are ebitda, revenue growth, net revenue, net profit, net profit, margin.

Internet Marketing Objectives Ppt PowerPoint Presentation Summary Portrait
This is a internet marketing objectives ppt powerpoint presentation summary portrait. This is a six stage process. The stages in this process are sales revenue, profit margins, product types, repeat sales, sales leads, web visitors.
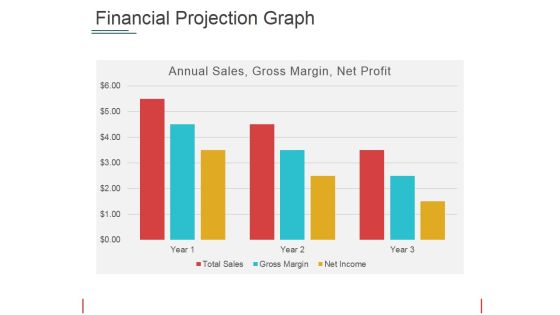
Financial Projection Graph Template 2 Ppt PowerPoint Presentation Show Picture
This is a financial projection graph template 2 ppt powerpoint presentation show picture. This is a three stage process. The stages in this process are annual sales, gross margin, net profit, years.
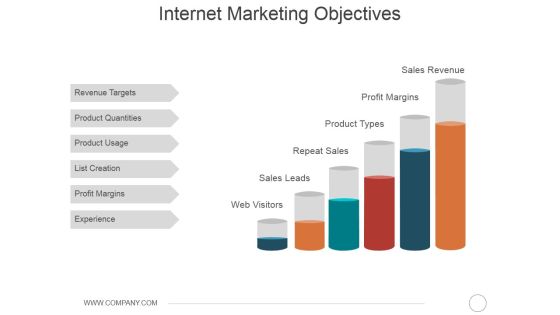
Internet Marketing Objectives Ppt PowerPoint Presentation Portfolio Summary
This is a internet marketing objectives ppt powerpoint presentation portfolio summary. This is a six stage process. The stages in this process are revenue targets, product quantities, product usage, list creation, profit margins, experience.

Website Performance Review Template 2 Ppt PowerPoint Presentation Gallery Objects
This is a website performance review template 2 ppt powerpoint presentation gallery objects. This is a three stage process. The stages in this process are margin, revenue, expense, support, other operational.

Internet Marketing Objectives Ppt PowerPoint Presentation Layouts Smartart
This is a internet marketing objectives ppt powerpoint presentation layouts smartart. This is a six stage process. The stages in this process are sales leads, product types, sales revenue, profit margins, repeat sales, web visitors.

Competitor Analysis Template 3 Ppt PowerPoint Presentation Ideas Graphic Tips
This is a competitor analysis template 3 ppt powerpoint presentation ideas graphic tips. This is a four stage process. The stages in this process are net profit margin, your company, competitor.
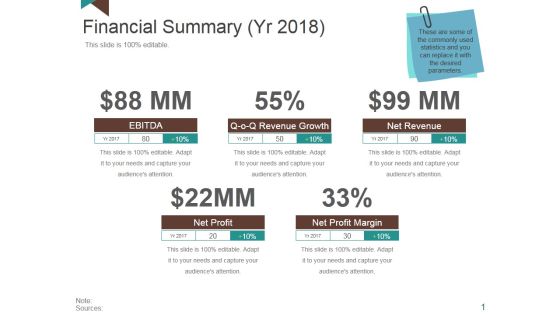
Financial Summary Ppt PowerPoint Presentation Layouts Portrait
This is a financial summary ppt powerpoint presentation layouts portrait. This is a four stage process. The stages in this process are ebitda, revenue growth, net revenue, net profit margin, net profit.

Competitor Analysis Template Ppt PowerPoint Presentation Pictures Graphics Template
This is a competitor analysis template ppt powerpoint presentation pictures graphics template. This is a four stage process. The stages in this process are business, strategy, marketing, planning, net profit margin.
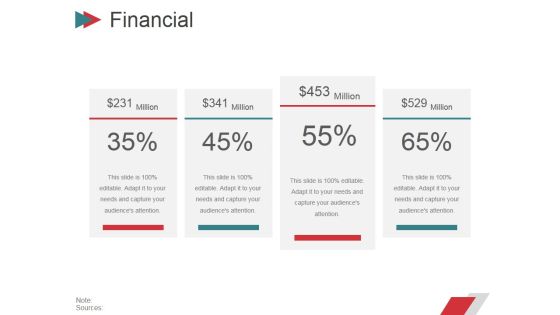
Financial Ppt PowerPoint Presentation Gallery Design Ideas
This is a financial ppt powerpoint presentation gallery design ideas. This is a five stage process. The stages in this process are ebitda, net profit, revenue, growth, net revenue, net profit, margin.

Top Marketing Campaigns Ppt PowerPoint Presentation Inspiration Structure
This is a top marketing campaigns ppt powerpoint presentation inspiration structure. This is a four stage process. The stages in this process are campaign, daily budget, margin, max percentage of budget.

Campaigns Done Ppt PowerPoint Presentation Visual Aids Icon
This is a campaigns done ppt powerpoint presentation visual aids icon. This is a four stage process. The stages in this process are daily budget, max pub cost, max of budget, margin .

Development In Past 10 Years Template 2 Ppt PowerPoint Presentation Professional Topics
This is a development in past 10 years template 2 ppt powerpoint presentation professional topics. This is a ten stage process. The stages in this process are net sales, other income, ebita, ebita margins, profit before tax, taxes.

Profit After Tax Pat Ppt PowerPoint Presentation Inspiration Display
This is a profit after tax pat ppt powerpoint presentation inspiration display. This is a two stage process. The stages in this process are pat, pat margins, business, growth, management, marketing.
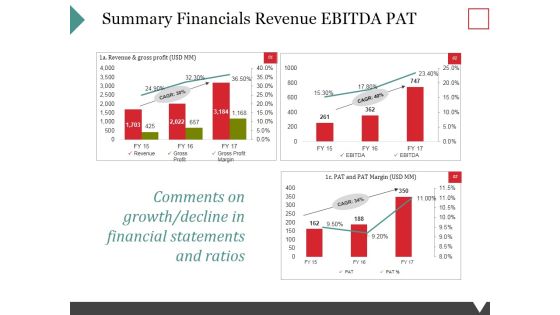
Summary Financials Revenue Ebitda Pat Ppt PowerPoint Presentation Ideas Files
This is a summary financials revenue ebitda pat ppt powerpoint presentation ideas files. This is a three stage process. The stages in this process are revenue, gross profit, gross profit margin.

Fit Gap Analysis Ppt Powerpoint Presentation Ideas Deck
This is a fit gap analysis ppt powerpoint presentation ideas deck. This is a five stage process. The stages in this process are competency skills, poor fit, marginal fit, acceptable fit.
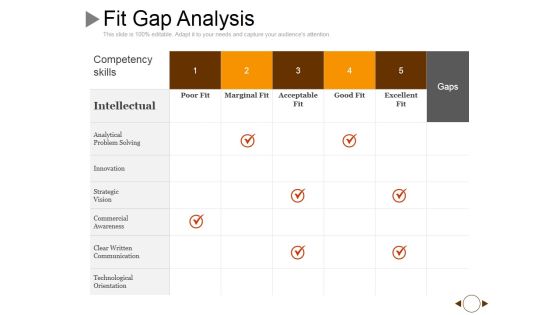
Fit Gap Analysis Ppt PowerPoint Presentation Show Examples
This is a fit gap analysis ppt powerpoint presentation show examples. This is a five stage process. The stages in this process are competency skills, poor fit, marginal fit, acceptable fit.

Competitors Analysis Template Ppt PowerPoint Presentation Infographic Template Rules
This is a competitors analysis template ppt powerpoint presentation infographic template rules. This is a four stage process. The stages in this process are net profit margin, finance, marketing, bar, success.

Financial Summary Ppt PowerPoint Presentation Professional Template
This is a financial summary ppt powerpoint presentation professional template. This is a two stage process. The stages in this process are revenue growth, net, profit margin, ebitda, net revenue, net profit.

Business Operations Summary Ppt PowerPoint Presentation Model Graphics Template
This is a business operations summary ppt powerpoint presentation model graphics template. This is a eight stage process. The stages in this process are net operating margin, productivity customer, retention rate.

Development In Past 10 Year Template 2 Ppt PowerPoint Presentation Infographic Template Example
This is a development in past 10 year template 2 ppt powerpoint presentation infographic template example. This is a ten stage process. The stages in this process are other income, net sales, ebita margins, taxes, financial result.
Industry Cost Structure Template 1 Ppt PowerPoint Presentation Icon Layout
This is a industry cost structure template 1 ppt powerpoint presentation icon layout. This is a two stage process. The stages in this process are power and fuel cost, material cost, employee cost, interest and finance costs, operating profit margins.

Inventory Kpis Ppt PowerPoint Presentation Infographic Template Display
This is a inventory kpis ppt powerpoint presentation infographic template display. This is a three stage process. The stages in this process are supply chain metrics, financial metrics, percent margins, return on assets, inventory turnover.
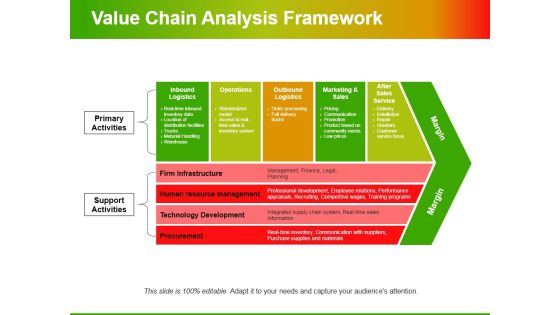
Value Chain Analysis Framework Ppt PowerPoint Presentation Infographic Template Shapes
This is a value chain analysis framework ppt powerpoint presentation infographic template shapes. This is a one stage process. The stages in this process are operations, after sales service, margin, firm infrastructure, primary activities.

Business And Financial Overview Ppt PowerPoint Presentation Inspiration Clipart Images
This is a business and financial overview ppt powerpoint presentation inspiration clipart images. This is a four stage process. The stages in this process are current key offerings, revenue by geography, current technology used, profit margin, revenue.

Competitor Analysis Template 4 Ppt PowerPoint Presentation Gallery Design Templates
This is a competitor analysis template 4 ppt powerpoint presentation gallery design templates. This is a four stage process. The stages in this process are business, marketing, analysis, graph, net profit margin.

Financial Summary Ppt PowerPoint Presentation Model Demonstration
This is a financial summary ppt powerpoint presentation model demonstration. This is a five stage process. The stages in this process are ebitda, revenue growth, net revenue, net profit margin, net profit.
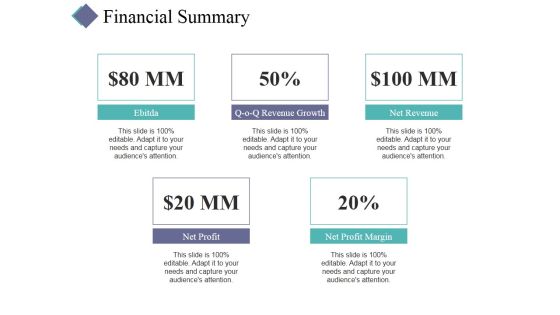
Financial Summary Ppt PowerPoint Presentation Summary Background
This is a financial summary ppt powerpoint presentation summary background. This is a five stage process. The stages in this process are net profit, net profit margin, net revenue, revenue growth.
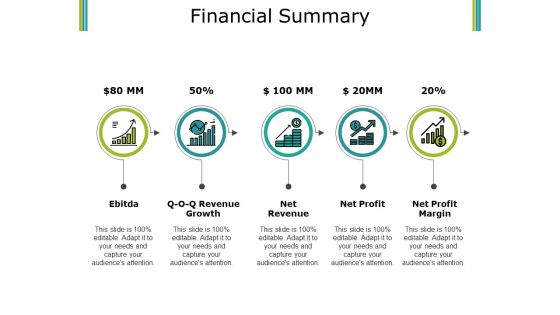
Financial Summary Ppt PowerPoint Presentation Inspiration Influencers
This is a financial summary ppt powerpoint presentation inspiration influencers. This is a five stage process. The stages in this process are ebitda, net revenue, net profit, net profit margin.

Financial Summary Ppt PowerPoint Presentation Ideas Samples
This is a financial summary ppt powerpoint presentation ideas samples. This is a five stage process. The stages in this process are ebitda, net profit, net profit margin, net revenue, revenue growth.
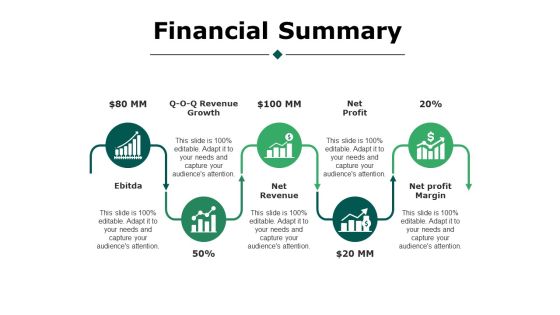
Financial Summary Ppt PowerPoint Presentation Styles Portfolio
This is a financial summary ppt powerpoint presentation styles portfolio. This is a five stage process. The stages in this process are business, ebitda, revenue growth, net revenue, net profit, net profit margin.
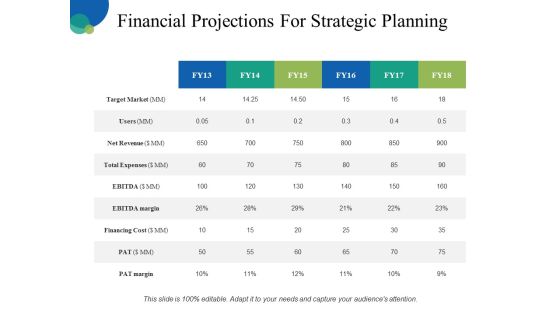
Financial Projections For Strategic Planning Ppt PowerPoint Presentation Inspiration Clipart
This is a financial projections for strategic planning ppt powerpoint presentation inspiration clipart. This is a three stage process. The stages in this process are target market, users, total expenses, financing cost, pat margin.

Company Sales And Performance Dashboard Ppt PowerPoint Presentation Show Structure
This is a company sales and performance dashboard ppt powerpoint presentation show structure. This is a four stage process. The stages in this process are year product sales, month growth in revenue, profit margins graph, year profits.

Financial Ppt PowerPoint Presentation Pictures Inspiration
This is a financial ppt powerpoint presentation pictures inspiration. This is a six stage process. The stages in this process are target market, users, net revenue, total expenses, pat margin.
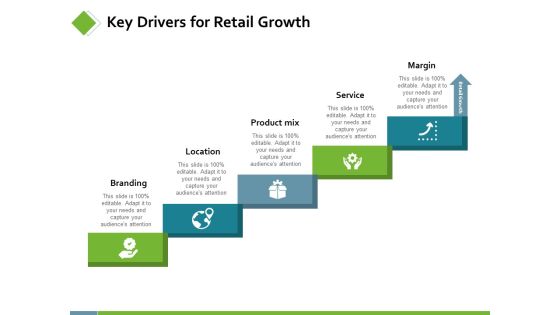
Key Drivers For Retail Growth Ppt PowerPoint Presentation Layouts Master Slide
This is a key drivers for retail growth ppt powerpoint presentation layouts master slide. This is a five stage process. The stages in this process are branding, location, product mix, service, margin.

IT Firm Financial Statement Information Technology Company Profitability Ratios Clipart PDF
The following slide highlights the profitability ratio of the Information technology company to assess the organizations capability to earn compared to its revenue. Key ratios included are EBDIT margin, EBIT margin, PBT margin, Net profit margin, and asset turnover percentage. Coming up with a presentation necessitates that the majority of the effort goes into the content and the message you intend to convey. The visuals of a PowerPoint presentation can only be effective if it supplements and supports the story that is being told. Keeping this in mind our experts created IT Firm Financial Statement Information Technology Company Profitability Ratios Clipart PDF to reduce the time that goes into designing the presentation. This way, you can concentrate on the message while our designers take care of providing you with the right template for the situation.
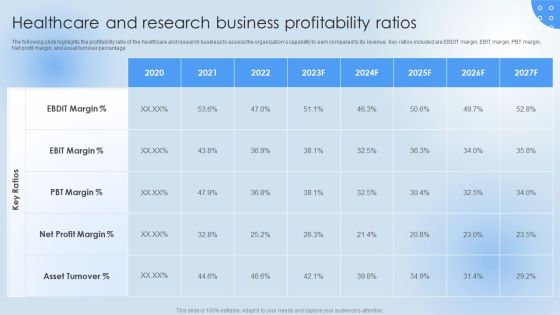
Healthcare And Research Business Pharmaceutical Company Financial Summary Information PDF
The following slide highlights the profitability ratio of the healthcare and research business to assess the organizations capability to earn compared to its revenue. Key ratios included are EBDIT margin, EBIT margin, PBT margin, Net profit margin, and asset turnover percentage. This Healthcare And Research Business Pharmaceutical Company Financial Summary Information PDF is perfect for any presentation, be it in front of clients or colleagues. It is a versatile and stylish solution for organizing your meetings. The Healthcare And Research Business Pharmaceutical Company Financial Summary Information PDF features a modern design for your presentation meetings. The adjustable and customizable slides provide unlimited possibilities for acing up your presentation. Slidegeeks has done all the homework before launching the product for you. So, dont wait, grab the presentation templates today.

Food Company Financial Performance Summary Food Business Firm Profitability Ratios Download PDF
The following slide highlights the profitability ratio of the Food company to assess the organizations capability to earn compared to its revenue. Key ratios included are EBDIT margin, EBIT margin, PBT margin, Net profit margin, and asset turnover percentage. Do you have to make sure that everyone on your team knows about any specific topic I yes, then you should give Food Company Financial Performance Summary Food Business Firm Profitability Ratios Download PDF a try. Our experts have put a lot of knowledge and effort into creating this impeccable Food Company Financial Performance Summary Food Business Firm Profitability Ratios Download PDF. You can use this template for your upcoming presentations, as the slides are perfect to represent even the tiniest detail. You can download these templates from the Slidegeeks website and these are easy to edit. So grab these today
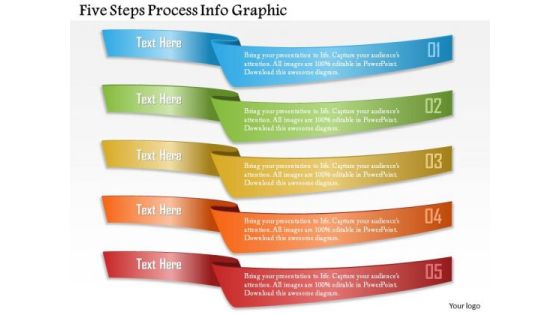
Business Diagram Five Steps Process Info Graphic Presentation Template
Explain the process control flow with this exclusive power point template. This diagram template contains the five steps of process control. Use this diagram template and build quality presentations for business process control related topics.
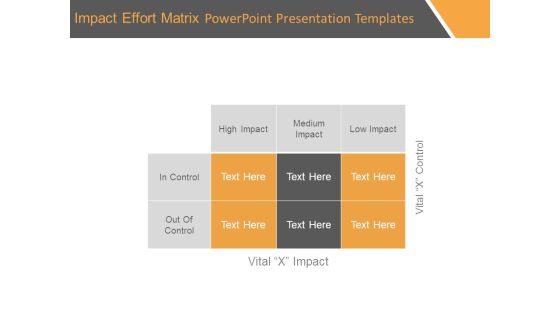
Impact Effort Matrix Powerpoint Presentation Templates
This is a impact effort matrix powerpoint presentation templates. This is a three stage process. The stages in this process are out of control, in control, high impact, medium impact, low impact, vital x impact, vital x control.

Companies Budgeting And Cost Management Ppt PowerPoint Presentation Portfolio Slide
This is a companies budgeting and cost management ppt powerpoint presentation portfolio slide. This is a five stage process. The stages in this process are cost control, money control, price control.

Project Cost Calculation And Estimation Ppt PowerPoint Presentation Infographics Structure
This is a project cost calculation and estimation ppt powerpoint presentation infographics structure. This is a one stage process. The stages in this process are cost control, money control, price control.

Project Resource Planning And Management Ppt PowerPoint Presentation Portfolio Model
This is a project resource planning and management ppt powerpoint presentation portfolio model. This is a five stage process. The stages in this process are cost control, money control, price control.
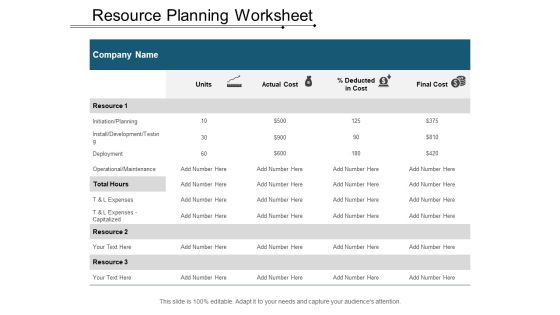
Resource Planning Worksheet Ppt PowerPoint Presentation Gallery Example
This is a resource planning worksheet ppt powerpoint presentation gallery example. This is a one stage process. The stages in this process are cost control, money control, price control.

Systematic Process Of Problem Solving Diagram Powerpoint Slides
This is a systematic process of problem solving diagram powerpoint slides. This is a nine stage process. The stages in this process are define problem measure, gather problem facts data, search for possible causes, plan temporary and permanent improvement, confirm root cause, analyze for cause, check results, install permanent improvement, control.

Risk Based Asset Management Model Ppt Powerpoint Ideas
This is a risk based asset management model ppt powerpoint ideas. This is a six stage process. The stages in this process are continuous improvement, plan, do, check, act, building capability, quality system, operational stability, classify, analyze, control, measure, metrics, corporate culture.

Quality Management Tools Ppt Powerpoint Guide
This is a quality management tools ppt powerpoint guide. This is a seven stage process. The stages in this process are control chart, flow chart, cause effect diagram, pareto chart, the 7 quality tools, for process improvement, check sheet, histogram, scatter plot.
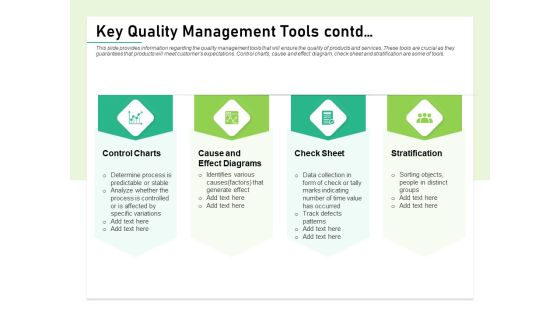
Quality Management Plan QMP Key Quality Management Tools Contd Introduction PDF
Presenting this set of slides with name quality management plan qmp key quality management tools contd introduction pdf. This is a four stage process. The stages in this process are control charts, cause and effect diagrams, check sheet, stratification. This is a completely editable PowerPoint presentation and is available for immediate download. Download now and impress your audience.

Project Quality Management Plan Key Quality Management Tools Contd Portrait PDF
Presenting this set of slides with name project quality management plan key quality management tools contd portrait pdf. This is a four stage process. The stages in this process are control charts, cause and effect diagrams, check sheet, stratification. This is a completely editable PowerPoint presentation and is available for immediate download. Download now and impress your audience.

Pros Cons Of Online Business Ppt PowerPoint Presentation Summary Graphics Example
Presenting this set of slides with name pros cons of online business ppt powerpoint presentation summary graphics example. This is a two stage process. The stages in this process are positive review, negative review, growth higher margin, increase mobile penetration, higher margins in e commerce, lack profitably. This is a completely editable PowerPoint presentation and is available for immediate download. Download now and impress your audience.
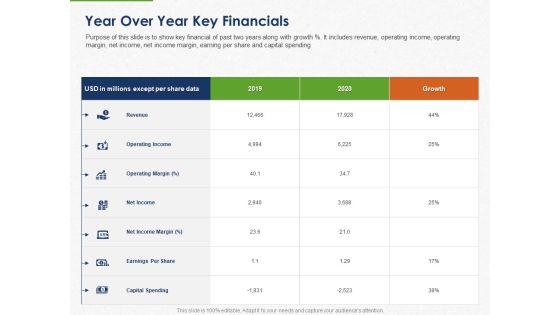
Developing And Creating Corner Market Place Year Over Year Key Financials Ppt PowerPoint Presentation Inspiration Outline PDF
Presenting this set of slides with name developing and creating corner market place year over year key financials ppt powerpoint presentation inspiration outline pdf. The topics discussed in these slides are revenue, operating income, operating margin, net income, net income margin, earnings per share, capital spending. This is a completely editable PowerPoint presentation and is available for immediate download. Download now and impress your audience.
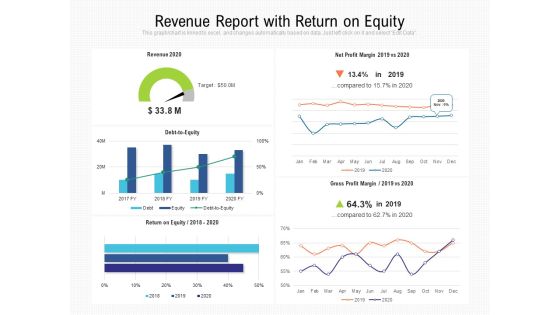
Revenue Report With Return On Equity Ppt PowerPoint Presentation Pictures Brochure PDF
Presenting this set of slides with name revenue report with return on equity ppt powerpoint presentation pictures brochure pdf. The topics discussed in these slides are revenue 2020, net profit margin 2019 vs 2020, gross profit margin, 2019 vs 2020, return on equity, 2018 to 2020. This is a completely editable PowerPoint presentation and is available for immediate download. Download now and impress your audience.

CRM System Dashboard With Sales Pipeline Ppt PowerPoint Presentation Gallery Icons PDF
Pitch your topic with ease and precision using this crm system dashboard with sales pipeline ppt powerpoint presentation gallery icons pdf. This layout presents information on margin by sale rep, deal size vs discount, sale activity by sales rep, margin by sale rep, sales pipeline by sales rep, neglected accounts. It is also available for immediate download and adjustment. So, changes can be made in the color, design, graphics or any other component to create a unique layout.
Upselling Strategies For Business Quarterly Financial Highlights Ppt Icon Vector PDF
This graph shows the quarterly decreasing trend of the net sales and operating profit margin for FY 2019 along with key insights. Deliver and pitch your topic in the best possible manner with this upselling strategies for business quarterly financial highlights ppt icon vector pdf. Use them to share invaluable insights on techniques, cross selling, sales, profit margin and impress your audience. This template can be altered and modified as per your expectations. So, grab it now.
 Home
Home