Level Up
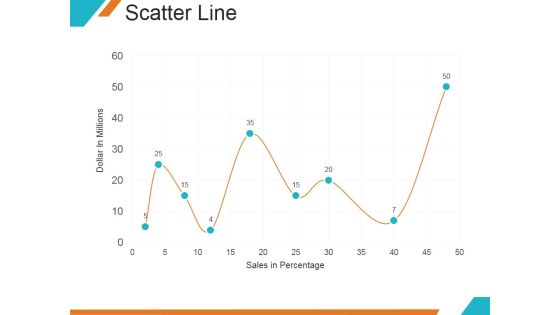
Scatter Line Ppt PowerPoint Presentation Backgrounds
This is a scatter line ppt powerpoint presentation backgrounds. This is a nine stage process. The stages in this process are dollar in millions, sales in percentage, graph, growth.

Combo Chart Ppt PowerPoint Presentation Infographics Infographics
This is a combo chart ppt powerpoint presentation infographics infographics. This is a three stage process. The stages in this process are bar graph, growth, finance, marketing, strategy, business.
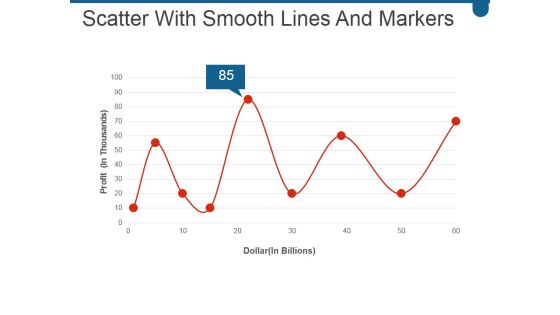
Scatter With Smooth Lines And Markers Ppt PowerPoint Presentation Professional Visual Aids
This is a scatter with smooth lines and markers ppt powerpoint presentation professional visual aids. This is a nine stage process. The stages in this process are business, marketing, success, growth, line.
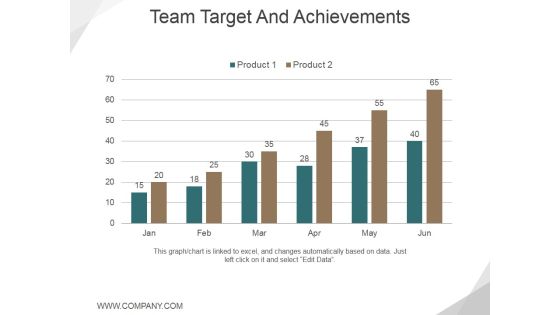
Team Target And Achievements Template 2 Ppt PowerPoint Presentation Infographic Template Graphic Tips
This is a team target and achievements template 2 ppt powerpoint presentation infographic template graphic tips. This is a six stage process. The stages in this process are graph, growth, success, business, marketing.

Crm Dashboard Deals By Expected Close Date Ppt PowerPoint Presentation Portfolio Icons
This is a crm dashboard deals by expected close date ppt powerpoint presentation portfolio icons. This is a three stage process. The stages in this process are bar graph, finance, marketing, strategy, business, analysis, growth.

Combo Chart Ppt PowerPoint Presentation Summary Graphics Tutorials
This is a combo chart ppt powerpoint presentation summary graphics tutorials. This is a eight stage process. The stages in this process are product, growth rate, market size, business.
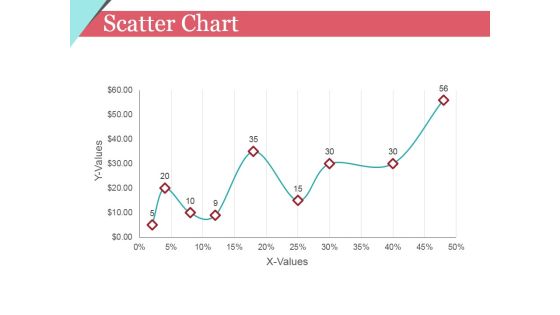
Scatter Chart Ppt PowerPoint Presentation Model Template
This is a scatter chart ppt powerpoint presentation model template. This is a nine stage process. The stages in this process are x values, y values, graph, growth, success.

Bar Graph Ppt PowerPoint Presentation Infographic Template Background
This is a bar graph ppt powerpoint presentation infographic template background. This is a four stage process. The stages in this process are business, strategy, analysis, growth, chart and graph.

Revenue Per Employee Ppt PowerPoint Presentation Layouts Layout
This is a revenue per employee ppt powerpoint presentation layouts layout. This is a eight stage process. The stages in this process are company revenue, annual revenue per employee, revenue, growth.

Staff Engagement Model Ppt PowerPoint Presentation Infographics Portfolio
This is a staff engagement model ppt powerpoint presentation infographics portfolio. This is a six stage process. The stages in this process are people and culture, corporate reputation and practices, opportunities and growth, engagement.

Training Hours Per Employee Ppt PowerPoint Presentation Styles Influencers
This is a training hours per employee ppt powerpoint presentation styles influencers. This is a four stage process. The stages in this process are average training hours, sum of total training hours, year, growth.

Current State Analysis Financial Comparison Ppt PowerPoint Presentation Icon Clipart Images
This is a current state analysis financial comparison ppt powerpoint presentation icon clipart images. This is a five stage process. The stages in this process are business, finance, analysis, marketing, growth, success.
Social Customer Service Performance Ppt PowerPoint Presentation Icon Tips
This is a social customer service performance ppt powerpoint presentation icon tips. This is a eight stage process. The stages in this process are growth, success, business, icons, strategy.
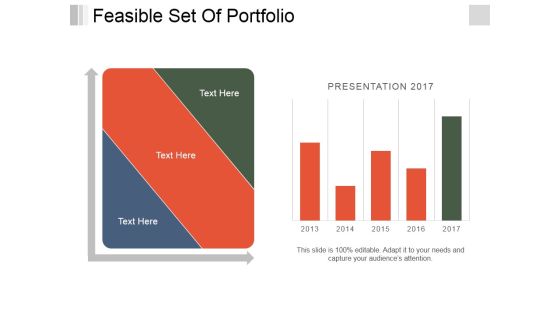
Feasible Set Of Portfolio Ppt PowerPoint Presentation Pictures Layouts
This is a feasible set of portfolio ppt powerpoint presentation pictures layouts. This is a two stage process. The stages in this process are business, finance, growth, marketing, strategy, analysis.

Business Analysis Ppt PowerPoint Presentation Outline Design Inspiration
This is a business analysis ppt powerpoint presentation outline design inspiration. This is a four stage process. The stages in this process are high, market share, low, takeovers targets, winners, breakup targets, losers, revenue growth.
Some Quick Facts Ppt PowerPoint Presentation Layouts Icons
This is a some quick facts ppt powerpoint presentation layouts icons. This is a three stage process. The stages in this process are customers, sales growth, staff work weekly.

Advertising Spent On Different Mediums Ppt PowerPoint Presentation Infographics Show
This is a advertising spent on different mediums ppt powerpoint presentation infographics show. This is a five stage process. The stages in this process are business, finance, marketing, strategy, bar graph, growth.

Bar Graph Ppt PowerPoint Presentation Show Topics
This is a bar graph ppt powerpoint presentation show topics. This is a nine stage process. The stages in this process are business, finance, marketing, strategy, bar graph, growth.
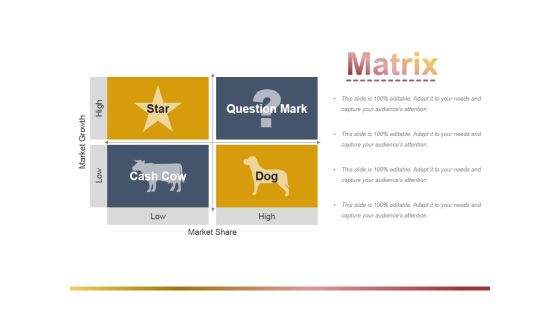
Matrix Ppt PowerPoint Presentation File Objects
This is a matrix ppt powerpoint presentation file objects. This is a four stage process. The stages in this process are market growth, question mark, cash cow, market share.

Combo Chart Ppt PowerPoint Presentation Inspiration Images
This is a combo chart ppt powerpoint presentation inspiration images. This is a three stage process. The stages in this process are market size, in years, growth rate, product.
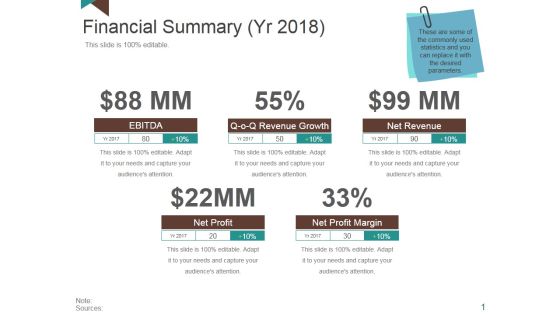
Financial Summary Ppt PowerPoint Presentation Layouts Portrait
This is a financial summary ppt powerpoint presentation layouts portrait. This is a four stage process. The stages in this process are ebitda, revenue growth, net revenue, net profit margin, net profit.
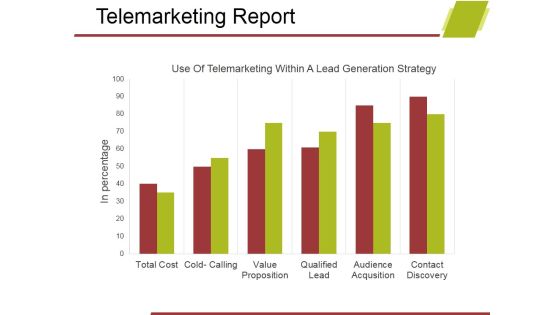
Telemarketing Report Template 1 Ppt PowerPoint Presentation Show Design Ideas
This is a telemarketing report template 1 ppt powerpoint presentation show design ideas. This is a six stage process. The stages in this process are business, bar graph, marketing, analysis, growth, strategy.

Summary Financials Revenue Ebitda Pat Ppt PowerPoint Presentation Portfolio Designs
This is a summary financials revenue ebitda pat ppt powerpoint presentation portfolio designs. This is a three stage process. The stages in this process are growth, finance, business, marketing.

Summary Financials Wc Analysis Roce Roe Ppt PowerPoint Presentation Inspiration Templates
This is a summary financials wc analysis roce roe ppt powerpoint presentation inspiration templates. This is a two stage process. The stages in this process are working capital analysis, roce and roe, growth, finance.

Clustered Column Line Ppt PowerPoint Presentation Slides Deck
This is a clustered column line ppt powerpoint presentation slides deck. This is a four stage process. The stages in this process are clustered column line, business, product, growth, strategy.

Matrix Ppt PowerPoint Presentation Model Design Templates
This is a matrix ppt powerpoint presentation model design templates. This is a four stage process. The stages in this process are star, question mark, cash cow, dog, market growth, market share.

Staked Line Chart Ppt PowerPoint Presentation Model Graphics Download
This is a staked line chart ppt powerpoint presentation model graphics download. This is a two stage process. The stages in this process are business, marketing, growth, finance, management.

Gap Analysis Graph Ppt Powerpoint Presentation Gallery Sample
This is a gap analysis graph ppt powerpoint presentation gallery sample. This is a six stage process. The stages in this process are potential performance, diversification, market growth, market penetration.
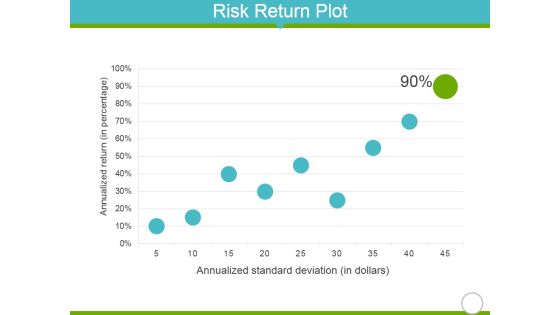
Risk Return Plot Ppt PowerPoint Presentation Infographics Background Designs
This is a risk return plot ppt powerpoint presentation infographics background designs. This is a nine stage process. The stages in this process are annualized return, annualized standard deviation, growth.

Column Chart Template 1 Ppt PowerPoint Presentation Professional Backgrounds
This is a column chart template 1 ppt powerpoint presentation professional backgrounds. This is a nine stage process. The stages in this process are column chart, product, growth, strategy, analysis, business.

Column Chart Template 2 Ppt PowerPoint Presentation Professional Slide
This is a column chart template 2 ppt powerpoint presentation professional slide. This is a nine stage process. The stages in this process are column chart, product, growth, strategy, analysis, business.

Competitor Positioning Ppt PowerPoint Presentation Slides Example Topics
This is a competitor positioning ppt powerpoint presentation slides example topics. This is a two stage process. The stages in this process are business, strategy, analysis, planning, finance, market growth.
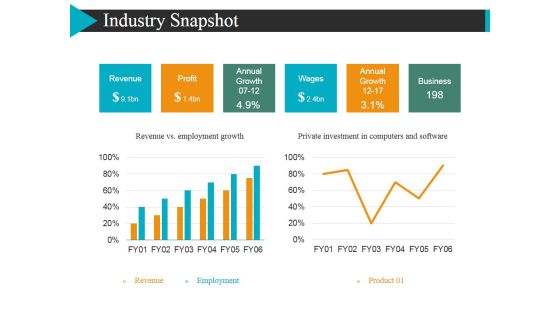
Industry Snapshot Template 2 Ppt Powerpoint Presentation Layouts Sample
This is a industry snapshot template 2 ppt powerpoint presentation layouts sample. This is a two stage process. The stages in this process are revenue, profit, annual growth, wages.

Market Insights Template 1 Ppt PowerPoint Presentation Show Brochure
This is a market insights template 1 ppt powerpoint presentation show brochure. This is a three stage process. The stages in this process are business, finance, marketing, analysis, growth.
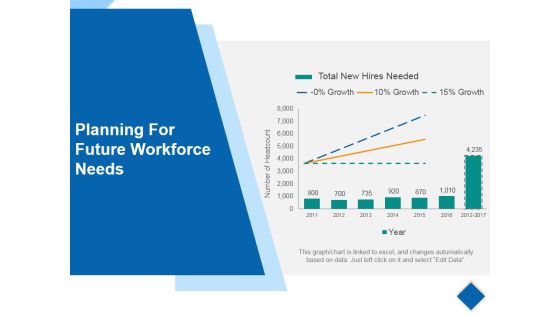
Planning For Future Workforce Needs Ppt PowerPoint Presentation Professional Slide
This is a planning for future workforce needs ppt powerpoint presentation professional slide. This is a seven stage process. The stages in this process are total new hires needed, business, graph, success, growth.

Combo Chart Ppt PowerPoint Presentation Summary Ideas
This is a combo chart ppt powerpoint presentation summary ideas. This is a eight stage process. The stages in this process are market size, growth rate, product, in years.

Internal Analysis Template 1 Ppt PowerPoint Presentation Summary Example Topics
This is a internal analysis template 1 ppt powerpoint presentation summary example topics. This is a three stage process. The stages in this process are employee performance, finance, analysis, strategy, growth, business.

Area Chart Ppt PowerPoint Presentation Show Layout Ideas
This is a area chart ppt powerpoint presentation show layout ideas. This is a two stage process. The stages in this process are product, in percentage, financial year, growth.

Clustered Column Line Ppt PowerPoint Presentation Gallery Graphics Example
This is a clustered column line ppt powerpoint presentation gallery graphics example. This is a four stage process. The stages in this process are product, growth, success, business, marketing.
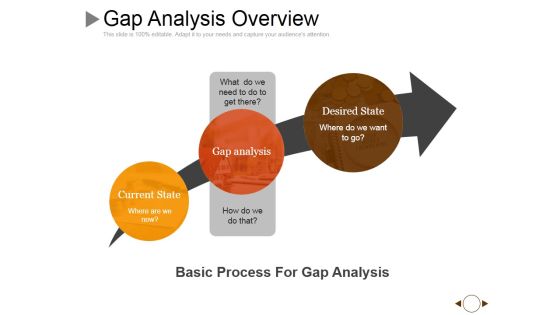
Gap Analysis Overview Ppt PowerPoint Presentation Model Show
This is a gap analysis overview ppt powerpoint presentation model show. This is a three stage process. The stages in this process are current state, gap analysis, desired state, arrow, growth.

Stacked Column Ppt PowerPoint Presentation Infographic Template Master Slide
This is a stacked column ppt powerpoint presentation infographic template master slide. This is a nine stage process. The stages in this process are product, dollar, growth, success, graph.

Clustered Column Line Ppt PowerPoint Presentation Summary Slides
This is a clustered column line ppt powerpoint presentation summary slides. This is a four stage process. The stages in this process are bar graph, growth, success, business, marketing.

Challenges Faced By Our Clients Template 2 Ppt PowerPoint Presentation Model Example
This is a challenges faced by our clients template 2 ppt powerpoint presentation model example. This is a three stage process. The stages in this process are challenge, goal, growth, success.
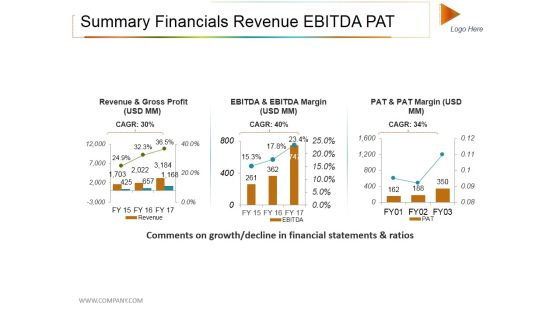
Summary Financials Revenue Ebitda Pat Ppt PowerPoint Presentation File Rules
This is a summary financials revenue ebitda pat ppt powerpoint presentation file rules. This is a three stage process. The stages in this process are revenue and gross profit, revenue, growth, success.

Bcg Matrix Ppt PowerPoint Presentation Layouts Deck
This is a bcg matrix ppt powerpoint presentation layouts deck. This is a four stage process. The stages in this process are question mark, star, dog, cash cow, market growth.

Bar Graph Ppt PowerPoint Presentation Pictures Slide Portrait
This is a bar graph ppt powerpoint presentation pictures slide portrait. This is a four stage process. The stages in this process are bar graph, growth, success, business, marketing.

Data Analytics Ppt PowerPoint Presentation Icon Master Slide
This is a data analytics ppt powerpoint presentation icon master slide. This is a five stage process. The stages in this process are bar graph, growth, success, business, marketing.

Company History And Milestones Template 2 Ppt PowerPoint Presentation Pictures Graphics Download
This is a company history and milestones template 2 ppt powerpoint presentation pictures graphics download. This is a five stage process. The stages in this process are roadmap, management, planning, strategy, business, growth.

Inflation Rate Template 1 Ppt PowerPoint Presentation Professional Design Inspiration
This is a inflation rate template 1 ppt powerpoint presentation professional design inspiration. This is a twelve stage process. The stages in this process are business, finance, growth, marketing, strategy, analysis.

Shareholders Fund And Market Cap Ppt PowerPoint Presentation Visual Aids Styles
This is a shareholders fund and market cap ppt powerpoint presentation visual aids styles. This is a five stage process. The stages in this process are business, finance, marketing, strategy, analysis, growth.

Career Path Template 2 Ppt PowerPoint Presentation Outline Topics
This is a career path template 2 ppt powerpoint presentation outline topics. This is a three stage process. The stages in this process are silhouettes, business, marketing, communication, growth.

Process Capability Measurement Template 1 Ppt PowerPoint Presentation Portfolio Model
This is a process capability measurement template 1 ppt powerpoint presentation portfolio model. This is a nine stage process. The stages in this process are target, lsl, usl, graph, growth.
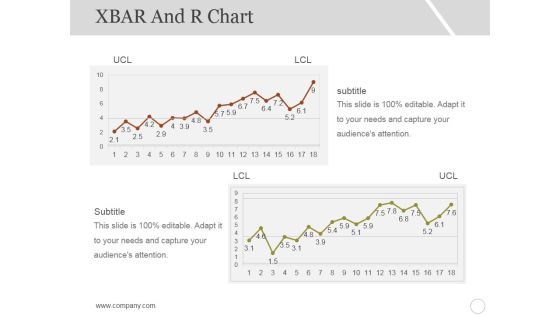
Xbar And R Chart Ppt PowerPoint Presentation Inspiration Styles
This is a xbar and r chart ppt powerpoint presentation inspiration styles. This is a two stage process. The stages in this process are subtitle, lcl, ucl, growth, graph.
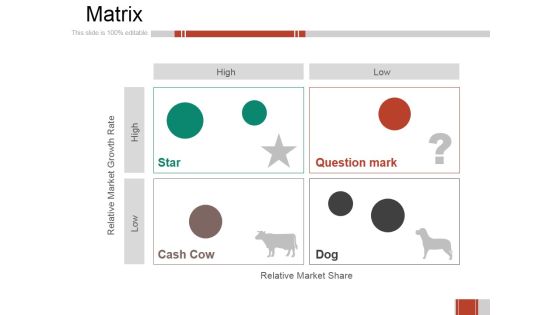
Matrix Ppt PowerPoint Presentation Summary Inspiration
This is a matrix ppt powerpoint presentation summary inspiration. This is a four stage process. The stages in this process are star, question mark, cash cow, dog, relative market share, relative market growth rate.
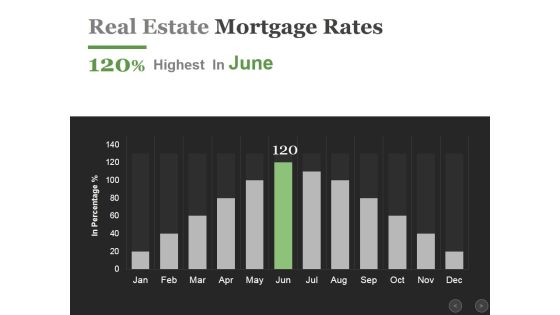
Real Estate Mortgage Rates Ppt PowerPoint Presentation Infographics Influencers
This is a real estate mortgage rates ppt powerpoint presentation infographics influencers. This is a twelve stage process. The stages in this process are business, finance, marketing, analysis, growth.

Matrix Ppt PowerPoint Presentation Model Influencers
This is a matrix ppt powerpoint presentation model influencers. This is a four stage process. The stages in this process are high, low, relative market share, relative market growth rate.

Annual Run Rate Ppt PowerPoint Presentation Gallery Mockup
This is a annual run rate ppt powerpoint presentation gallery mockup. This is a four stage process. The stages in this process are bar graph, growth, success, business, marketing.

Bar Graph Ppt PowerPoint Presentation Inspiration Format Ideas
This is a bar graph ppt powerpoint presentation inspiration format ideas. This is a four stage process. The stages in this process are bar graph, growth, success, business, marketing.
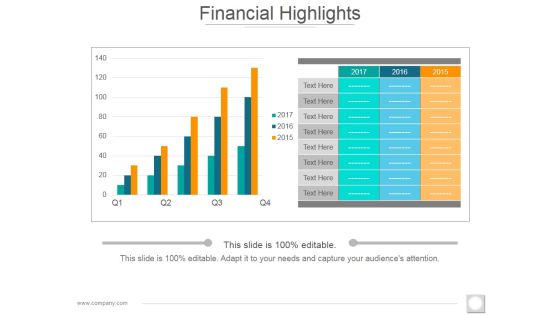
Financial Highlights Template 2 Ppt PowerPoint Presentation Slides Ideas
This is a financial highlights template 2 ppt powerpoint presentation slides ideas. This is a two stage process. The stages in this process are bar graph, growth, success, business, marketing.

Bcg Matrix Ppt PowerPoint Presentation Slides Design Ideas
This is a bcg matrix ppt powerpoint presentation slides design ideas. This is a four stage process. The stages in this process are question mark, star, dog, cash cow, market growth, market share.
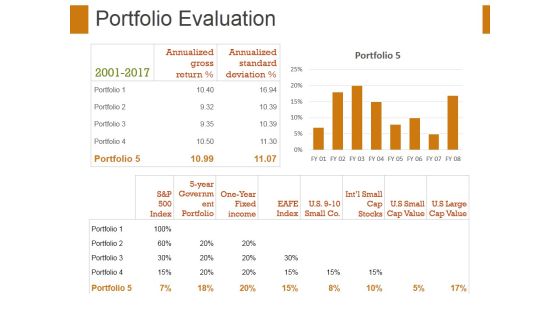
Portfolio Evaluation Template 2 Ppt PowerPoint Presentation Portfolio Slides
This is a portfolio evaluation template 2 ppt powerpoint presentation portfolio slides. This is a eight stage process. The stages in this process are portfolio evaluation, finance, growth, marketing, analysis, business.
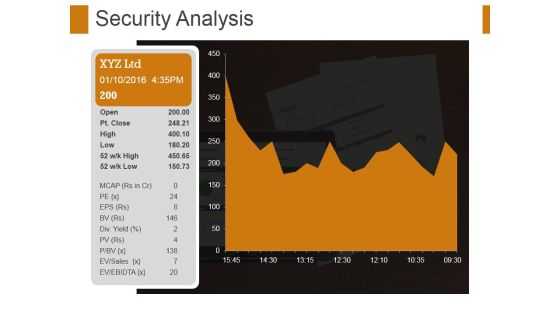
Security Analysis Ppt PowerPoint Presentation File Format Ideas
This is a security analysis ppt powerpoint presentation file format ideas. This is a one stage process. The stages in this process are security analysis, growth, strategy, management, business.
Monthly Recurring Revenue Churn Template 1 Ppt PowerPoint Presentation Icon Microsoft
This is a monthly recurring revenue churn template 1 ppt powerpoint presentation icon microsoft. This is a four stage process. The stages in this process are bar graph, growth, success, business, marketing.

Monthly Recurring Revenue Churn Template 2 Ppt PowerPoint Presentation Diagram Images
This is a monthly recurring revenue churn template 2 ppt powerpoint presentation diagram images. This is a eleven stage process. The stages in this process are bar graph, growth, success, business, marketing.
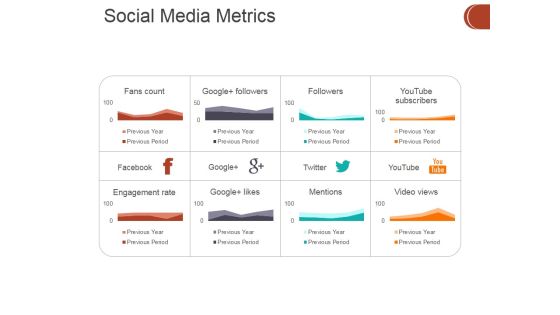
Social Media Metrics Ppt PowerPoint Presentation Portfolio Tips
This is a social media metrics ppt powerpoint presentation portfolio tips. This is a eight stage process. The stages in this process are business, finance, growth, strategy, analysis, investment.

External Analysis Trends In Public Sector Employment Ppt PowerPoint Presentation Slides Templates
This is a external analysis trends in public sector employment ppt powerpoint presentation slides templates. This is a seven stage process. The stages in this process are percentage, growth, business, marketing, strategy.
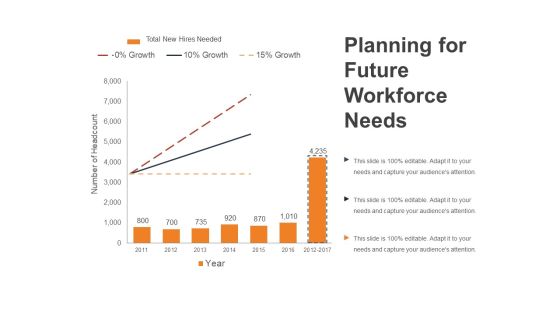
Planning For Future Workforce Needs Ppt PowerPoint Presentation Outline Smartart
This is a planning for future workforce needs ppt powerpoint presentation outline smartart. This is a three stage process. The stages in this process are growth, percentage, number of headcount, year, finance.

Bar Graph Ppt PowerPoint Presentation Ideas Graphic Tips
This is a bar graph ppt powerpoint presentation ideas graphic tips. This is a three stage process. The stages in this process are financial year, sales in percentage, product, bar graph, growth.

Clustered Column Line Ppt PowerPoint Presentation Show Influencers
This is a clustered column line ppt powerpoint presentation show influencers. This is a four stage process. The stages in this process are financial year, sales in percentage, product, growth, success.
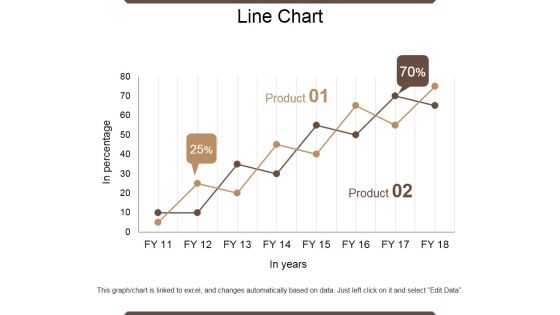
Line Chart Ppt PowerPoint Presentation Outline Infographic Template
This is a line chart ppt powerpoint presentation outline infographic template. This is a two stage process. The stages in this process are in percentage, product, in year, growth, success.

Stacked Area Clustered Column Ppt PowerPoint Presentation Show Guidelines
This is a stacked area clustered column ppt powerpoint presentation show guidelines. This is a four stage process. The stages in this process are in percentage, product, bar graph, growth, success.

Bar Graph Ppt PowerPoint Presentation Model Graphics Design
This is a bar graph ppt powerpoint presentation model graphics design. This is a four stage process. The stages in this process are bar graph, growth, success, business, marketing.

Area Chart Ppt PowerPoint Presentation Infographic Template Samples
This is a area chart ppt powerpoint presentation infographic template samples. This is a two stage process. The stages in this process are in percentage product, business, marketing, growth.

Combo Chart Ppt PowerPoint Presentation Icon Design Templates
This is a combo chart ppt powerpoint presentation icon design templates. This is a three stage process. The stages in this process are market size, growth rate, product, business, success.

Clustered Column Line Ppt PowerPoint Presentation Portfolio Outline
This is a clustered column line ppt powerpoint presentation portfolio outline. This is a four stage process. The stages in this process are sales in percentage, financial year, product, graph, growth.
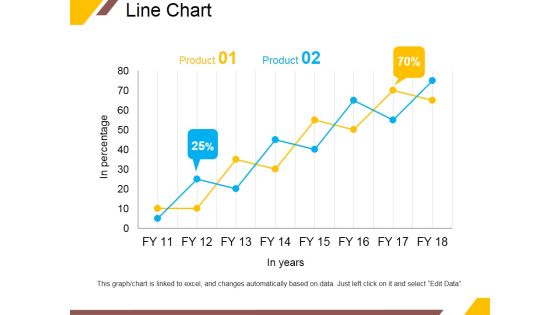
Line Chart Ppt PowerPoint Presentation Portfolio Infographic Template
This is a line chart ppt powerpoint presentation portfolio infographic template. This is a two stage process. The stages in this process are product, in years, business, percentage, growth.

Stacked Area Clustered Column Ppt PowerPoint Presentation Inspiration Shapes
This is a stacked area clustered column ppt powerpoint presentation inspiration shapes. This is a four stage process. The stages in this process are in percentage, product, growth, success, graph.
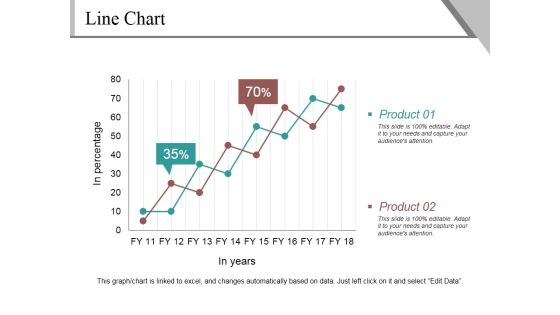
Line Chart Ppt PowerPoint Presentation Infographics Example
This is a line chart ppt powerpoint presentation infographics example. This is a two stage process. The stages in this process are product, in percentage, in years, finance, growth.
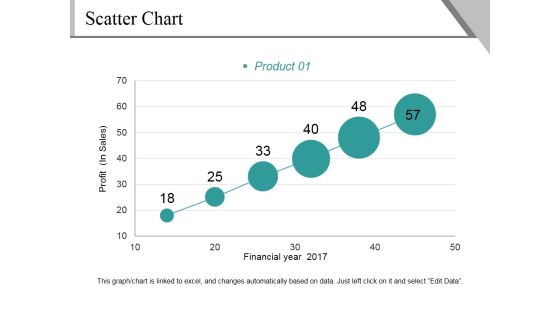
Scatter Chart Ppt PowerPoint Presentation File Background Image
This is a scatter chart ppt powerpoint presentation file background image. This is a six stage process. The stages in this process are profit, financial year, product, growth, success.
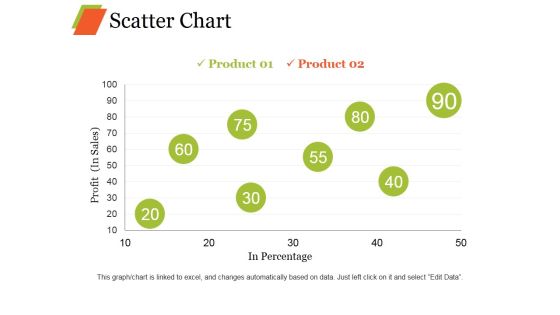
Scatter Chart Ppt PowerPoint Presentation Professional Graphic Images
This is a scatter chart ppt powerpoint presentation professional graphic images. This is a eight stage process. The stages in this process are product, profit, in percentage growth, business.

Combo Chart Ppt PowerPoint Presentation Summary Slides
This is a combo chart ppt powerpoint presentation summary slides. This is a three stage process. The stages in this process are market size, product, growth rate, bar graph, success.

Our Main Goal Ppt PowerPoint Presentation Summary Clipart Images
This is a our main goal ppt powerpoint presentation summary clipart images. This is a one stage process. The stages in this process are our main goal, growth, success, strategic, launch.
Scatter Chart Ppt PowerPoint Presentation Icon Example Introduction
This is a scatter chart ppt powerpoint presentation icon example introduction. This is a two stage process. The stages in this process are product, profit, in percentage, growth, scattered chart.

Customer Acquisition Cost By Channel Template 1 Ppt PowerPoint Presentation Show Graphic Tips
This is a customer acquisition cost by channel template 1 ppt powerpoint presentation show graphic tips. This is a five stage process. The stages in this process are business, finance, growth, analysis, strategy.

New Business Marketing Strategy Financing Expense Model Ppt PowerPoint Presentation Complete Deck With Slides
This is a new business marketing strategy financing expense model ppt powerpoint presentation complete deck with slides. This is a one stage process. The stages in this process are business, marketing, strategy, growth, graph.

Area Chart Ppt PowerPoint Presentation Infographics Visual Aids
This is a area chart ppt powerpoint presentation infographics visual aids. This is a two stage process. The stages in this process are product, area chart, in percentage, growth, success.
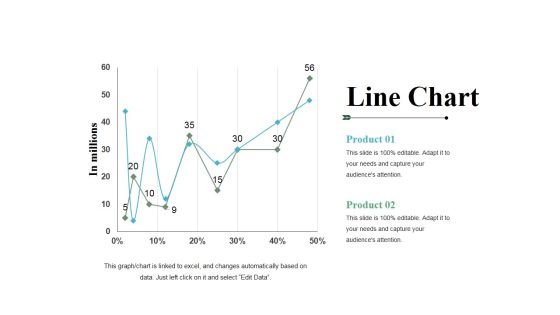
Line Chart Ppt PowerPoint Presentation File Templates
This is a line chart ppt powerpoint presentation file templates. This is a two stage process. The stages in this process are product, line chart, growth, percentage, in millions.
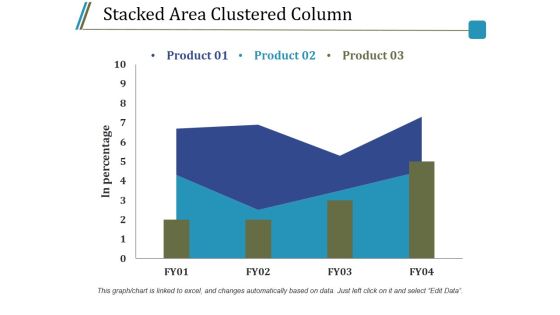
Stacked Area Clustered Column Ppt PowerPoint Presentation Model Guidelines
This is a stacked area clustered column ppt powerpoint presentation model guidelines. This is a three stage process. The stages in this process are product, in percentage, bar graph, growth, success.
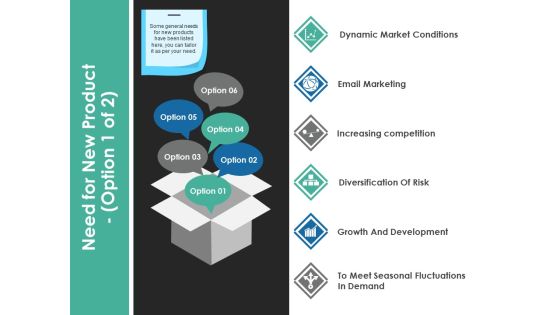
Need For New Product Template 1 Ppt PowerPoint Presentation Show Graphics
This is a need for new product template 1 ppt powerpoint presentation show graphics. This is a six stage process. The stages in this process are dynamic market conditions, email marketing, increasing competition, diversification of risk, growth and development.

Area Chart Ppt PowerPoint Presentation Infographic Template Layout
This is a area chart ppt powerpoint presentation infographic template layout. This is a two stage process. The stages in this process are product, profit, area chart, growth, success.
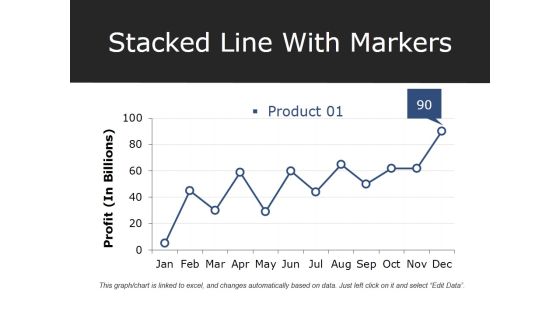
Stacked Line With Markers Ppt PowerPoint Presentation Professional Deck
This is a stacked line with markers ppt powerpoint presentation professional deck. This is a one stage process. The stages in this process are product, profit, growth, success, graph.

Line Chart Ppt PowerPoint Presentation Professional Graphics Design
This is a line chart ppt powerpoint presentation professional graphics design. This is a two stage process. The stages in this process are financial years, sales in percentage, product, growth, success.
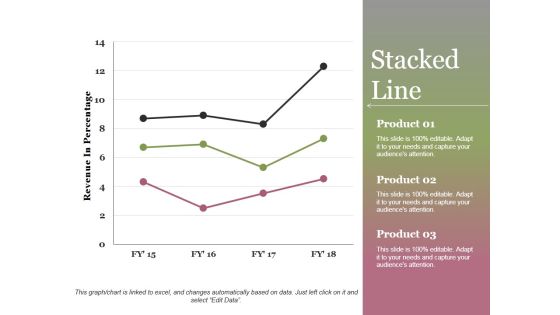
Stacked Line Ppt PowerPoint Presentation Show
This is a stacked line ppt powerpoint presentation show. This is a three stage process. The stages in this process are revenue in percentage, product, stacked line, growth, success.
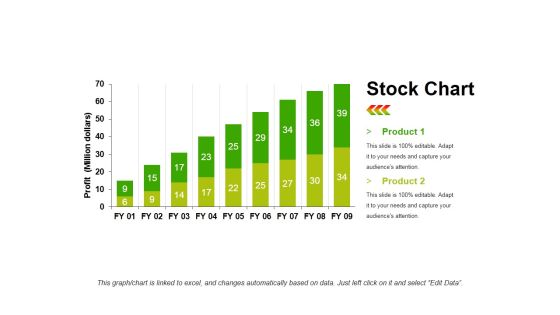
Stock Chart Template 1 Ppt PowerPoint Presentation Infographic Template Objects
This is a stock chart template 1 ppt powerpoint presentation infographic template objects. This is a two stage process. The stages in this process are product, profit, bar graph, growth, success.

Stacked Area Clustered Column Ppt PowerPoint Presentation File Background Designs
This is a stacked area clustered column ppt powerpoint presentation file background designs. This is a three stage process. The stages in this process are product, in percentage, growth, success, bar graph.

Clustered Column Line Ppt PowerPoint Presentation Icon Ideas
This is a clustered column line ppt powerpoint presentation icon ideas. This is a three stage process. The stages in this process are product, in percentage, bar graph, success, growth.

Clustered Column Template 1 Ppt PowerPoint Presentation Outline File Formats
This is a clustered column template 1 ppt powerpoint presentation outline file formats. This is a two stage process. The stages in this process are product, bar graph, success, growth, finance.

Clustered Column Template 2 Ppt PowerPoint Presentation Summary Smartart
This is a clustered column template 2 ppt powerpoint presentation summary smartart. This is a two stage process. The stages in this process are product, bar graph, in percentage, clustered column, growth.
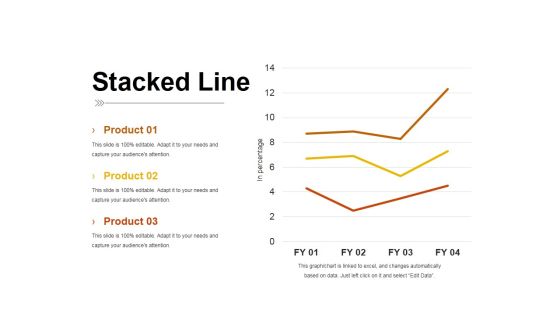
Stacked Line Ppt PowerPoint Presentation Inspiration Pictures
This is a stacked line ppt powerpoint presentation inspiration pictures. This is a three stage process. The stages in this process are product, stacked line, in percentage, business, growth.

Stacked Area Clustered Column Ppt PowerPoint Presentation Summary Professional
This is a stacked area clustered column ppt powerpoint presentation summary professional. This is a three stage process. The stages in this process are product, bar graph, growth, success, in percentage.
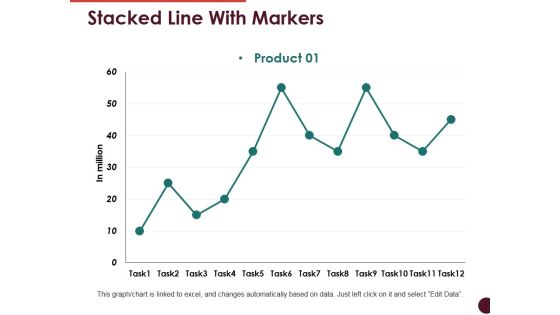
Stacked Line With Markers Ppt PowerPoint Presentation Show Templates
This is a stacked line with markers ppt powerpoint presentation show templates. This is a one stage process. The stages in this process are product, bar graph, growth, success, business.

Line Chart Ppt PowerPoint Presentation Layouts Example
This is a line chart ppt powerpoint presentation layouts example. This is a two stage process. The stages in this process are sales in percentage, product, financial years, growth, success.
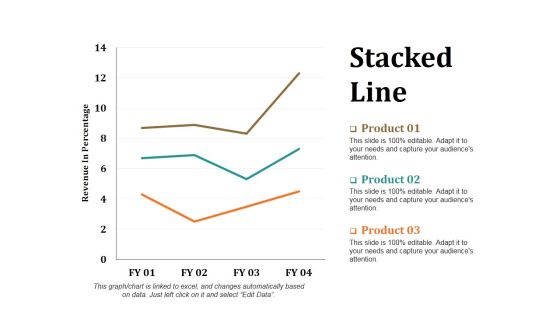
Stacked Line Ppt PowerPoint Presentation Layouts Portrait
This is a stacked line ppt powerpoint presentation layouts portrait. This is a three stage process. The stages in this process are revenue in percentage, stacked line, product, growth, success.
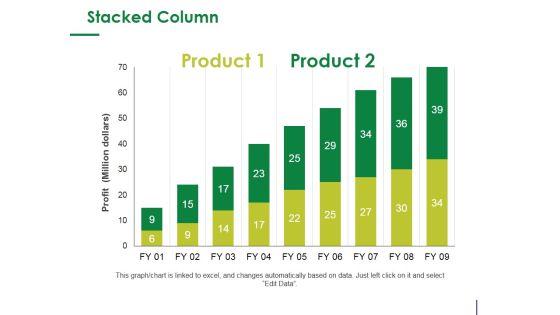
Stacked Column Ppt PowerPoint Presentation Infographic Template Design Ideas
This is a stacked column ppt powerpoint presentation infographic template design ideas. This is a two stage process. The stages in this process are product, profit, bar graph, growth, success.

Clustered Column Line Ppt PowerPoint Presentation Summary Background Image
This is a clustered column line ppt powerpoint presentation summary background image. This is a four stage process. The stages in this process are in percentage, product, graph, growth, success.

Clustered Column Ppt PowerPoint Presentation File Graphics
This is a clustered column ppt powerpoint presentation file graphics. This is a two stage process. The stages in this process are product, financial year, sales in percentage, graph, growth.

Competitor Revenue And Profit Template 1 Ppt PowerPoint Presentation Infographic Template Designs Download
This is a competitor revenue and profit template 1 ppt powerpoint presentation infographic template designs download. This is a five stage process. The stages in this process are revenue, profit, competitor, bar graph, growth.

Column Chart Ppt PowerPoint Presentation Model Clipart Images
This is a column chart ppt powerpoint presentation model clipart images. This is a two stage process. The stages in this process are product, bar graph, growth, success, business.

Competitor Revenue And Profit Template 2 Ppt PowerPoint Presentation Infographic Template Format Ideas
This is a competitor revenue and profit template 2 ppt powerpoint presentation infographic template format ideas. This is a five stage process. The stages in this process are competitor, revenue, profit, graph, growth.

Line Chart Ppt PowerPoint Presentation File Example File
This is a line chart ppt powerpoint presentation file example file. This is a two stage process. The stages in this process are product, in percentage, in years, growth, success.
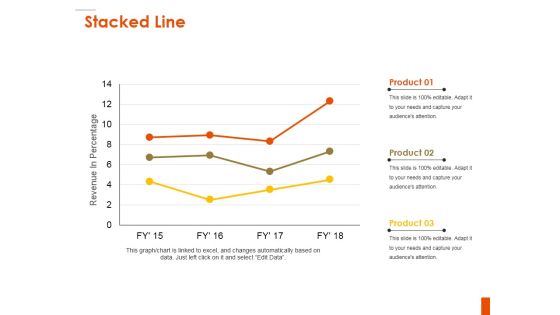
Stacked Line Ppt PowerPoint Presentation Outline Inspiration
This is a stacked line ppt powerpoint presentation outline inspiration. This is a three stage process. The stages in this process are revenue in percentage, product, growth, business, success.

Area Chart Ppt PowerPoint Presentation Ideas Icon
This is a area chart ppt powerpoint presentation ideas icon. This is a two stage process. The stages in this process are product, area chart, sales in percentage, growth, success.

Column Chart Ppt PowerPoint Presentation Infographics Deck
This is a column chart ppt powerpoint presentation infographics deck. This is a two stage process. The stages in this process are product, expenditure in, years, bar graph, growth.

Some Quick Facts Ppt PowerPoint Presentation Inspiration Graphics
This is a some quick facts ppt powerpoint presentation inspiration graphics. This is a three stage process. The stages in this process are customers in, sales growth in, staff works weekly.

Competitor Revenue And Profit Template 1 Ppt PowerPoint Presentation Professional Example File
This is a competitor revenue and profit template 1 ppt powerpoint presentation professional example file. This is a five stage process. The stages in this process are business, finance, marketing, strategy, analysis, growth.

Clustered Column Line Ppt PowerPoint Presentation Icon Good
This is a clustered column line ppt powerpoint presentation icon good. This is a three stage process. The stages in this process are product, financial year, bar graph, business, growth.

Combo Chart Ppt PowerPoint Presentation Slides Show
This is a combo chart ppt powerpoint presentation slides show. This is a three stage process. The stages in this process are combo chart, market size, product, bar graph, growth.
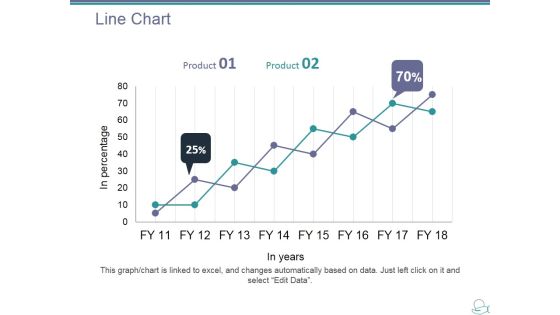
Line Chart Ppt PowerPoint Presentation Layouts Show
This is a line chart ppt powerpoint presentation layouts show. This is a two stage process. The stages in this process are product, in years, in percentage, line chart, growth.

Scatter Chart Ppt PowerPoint Presentation Ideas Designs Download
This is a scatter chart ppt powerpoint presentation ideas designs download. This is a one stage process. The stages in this process are product, dollar, in percentage, growth, success.
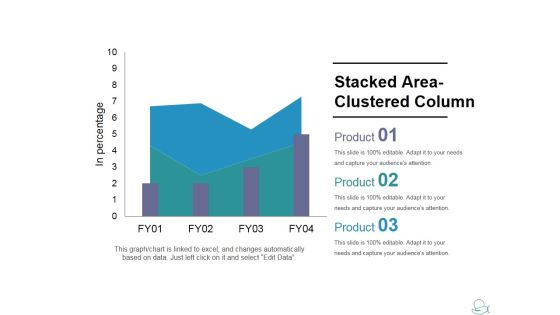
Stacked Area Clustered Column Ppt PowerPoint Presentation Slides Shapes
This is a stacked area clustered column ppt powerpoint presentation slides shapes. This is a three stage process. The stages in this process are product, growth, success graph, business.

Bar Chart Ppt PowerPoint Presentation Icon Information
This is a bar chart ppt powerpoint presentation icon information. This is a one stage process. The stages in this process are product, sales in percentage, financial years, bar graph, growth.

Column Chart Ppt PowerPoint Presentation Layouts Background Images
This is a column chart ppt powerpoint presentation layouts background images. This is a two stage process. The stages in this process are product, in months, graph, growth, success.
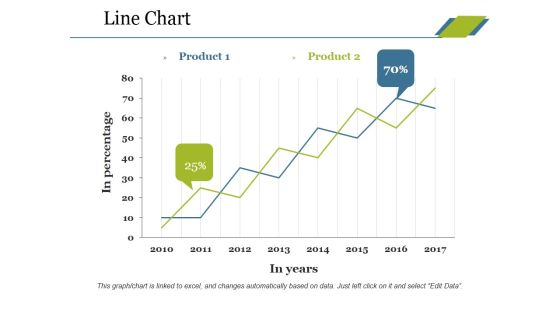
Line Chart Ppt PowerPoint Presentation Professional Tips
This is a line chart ppt powerpoint presentation professional tips. This is a two stage process. The stages in this process are product, in percentage, in years, growth, success.

Bubble Chart Ppt PowerPoint Presentation Inspiration Graphics Download
This is a bubble chart ppt powerpoint presentation inspiration graphics download. This is a three stage process. The stages in this process are product, growth, success, bubble chart, business.

Bar Diagram Ppt PowerPoint Presentation Gallery Structure
This is a bar diagram ppt powerpoint presentation gallery structure. This is a three stage process. The stages in this process are financial in years, sales in percentage, bar graph, growth, success.

Column Chart Ppt PowerPoint Presentation Layouts Tips
This is a column chart ppt powerpoint presentation layouts tips. This is a six stage process. The stages in this process are sales in percentage, financial year, bar graph, growth, success.

Bar Diagram Ppt PowerPoint Presentation Pictures Background Image
This is a bar diagram ppt powerpoint presentation pictures background image. This is a three stage process. The stages in this process are financial in years, sales in percentage, bar graph, growth, success.

Column Chart Ppt PowerPoint Presentation Slides Visual Aids
This is a column chart ppt powerpoint presentation slides visual aids. This is a six stage process. The stages in this process are bar graph, growth, success, sales in percentage, financial year.

Combo Chart Ppt PowerPoint Presentation Inspiration Slide Portrait
This is a combo chart ppt powerpoint presentation inspiration slide portrait. This is a three stage process. The stages in this process are product, market size, bar chart, growth, success.

Line Chart Ppt PowerPoint Presentation Slides Ideas
This is a line chart ppt powerpoint presentation slides ideas. This is a two stage process. The stages in this process are product, in percentage, in years, growth, success.
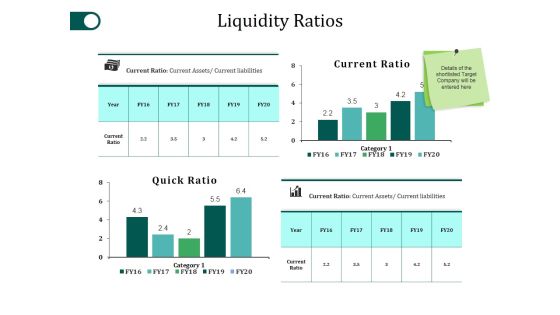
Liquidity Ratios Ppt PowerPoint Presentation Ideas Design Inspiration
This is a liquidity ratios ppt powerpoint presentation ideas design inspiration. This is a four stage process. The stages in this process are current ratio, quick ratio, category, business, growth.

Line Chart Ppt PowerPoint Presentation Show Guide
This is a line chart ppt powerpoint presentation show guide. This is a two stage process. The stages in this process are product, sales in percentage, financial years, growth, success.
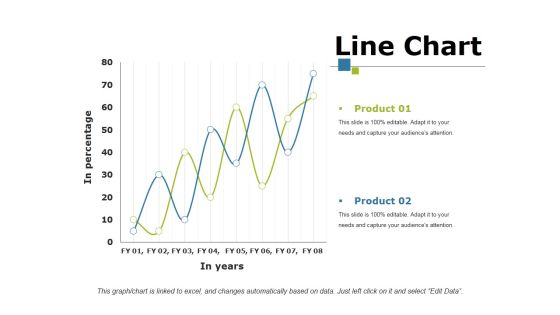
Line Chart Ppt PowerPoint Presentation Portfolio Mockup
This is a line chart ppt powerpoint presentation portfolio mockup. This is a two stage process. The stages in this process are product, in percentage, in year, growth, success.

Competitors Average Price Product Ppt PowerPoint Presentation Layouts Infographic Template
This is a competitors average price product ppt powerpoint presentation layouts infographic template. This is a five stage process. The stages in this process are company, bar graph, success, growth, business.

Stacked Column Ppt PowerPoint Presentation Layouts Example
This is a stacked column ppt powerpoint presentation layouts example. This is a two stage process. The stages in this process are product, stacked column, bar graph, growth, success.
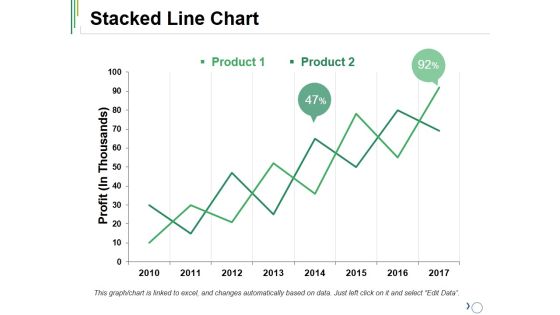
Stacked Line Chart Ppt PowerPoint Presentation Ideas Outfit
This is a stacked line chart ppt powerpoint presentation ideas outfit. This is a two stage process. The stages in this process are product, stacked line, profit, growth, success.

Clustered Column Line Ppt PowerPoint Presentation Pictures Example
This is a clustered column line ppt powerpoint presentation pictures example. This is a three stage process. The stages in this process are product, in percentage, bar graph, growth, success.

Clustered Column Line Ppt PowerPoint Presentation Infographic Template Pictures
This is a clustered column line ppt powerpoint presentation infographic template pictures. This is a three stage process. The stages in this process are product, in percentage, bar graph, growth, success.

Column Chart Ppt PowerPoint Presentation Gallery Slide Portrait
This is a column chart ppt powerpoint presentation gallery slide portrait. This is a two stage process. The stages in this process are sales in percentage, financial year, product, bar graph, growth.

Competitor Revenue And Profit Ppt PowerPoint Presentation Slides Influencers
This is a competitor revenue and profit ppt powerpoint presentation slides influencers. This is a five stage process. The stages in this process are business, marketing, strategy, planning, growth.

Column Chart Ppt PowerPoint Presentation Styles Graphics Design
This is a column chart ppt powerpoint presentation styles graphics design. This is a two stage process. The stages in this process are expenditure in, product, years, growth, success.

Column Chart Ppt PowerPoint Presentation File Summary
This is a column chart ppt powerpoint presentation file summary. This is a two stage process. The stages in this process are product, dollars, in years, bar graph, growth.
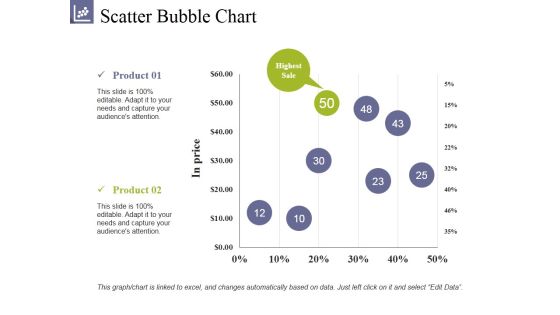
Scatter Bubble Chart Ppt PowerPoint Presentation Summary Clipart
This is a scatter bubble chart ppt powerpoint presentation summary clipart. This is a two stage process. The stages in this process are product, highest sale, in prices, growth, success.

Column Chart Ppt PowerPoint Presentation Ideas Vector
This is a column chart ppt powerpoint presentation ideas vector. This is a two stage process. The stages in this process are column chart, product, financial years, sales in percentage, growth.

Column Chart Ppt PowerPoint Presentation Pictures Graphic Images
This is a column chart ppt powerpoint presentation pictures graphic images. This is a two stage process. The stages in this process are product, years, growth, success, bar graph.

Column Chart Ppt PowerPoint Presentation Gallery Portfolio
This is a column chart ppt powerpoint presentation gallery portfolio. This is a two stage process. The stages in this process are in months, product, column chart, growth, success.

Line Chart Ppt PowerPoint Presentation Slides Mockup
This is a line chart ppt powerpoint presentation slides mockup. This is a two stage process. The stages in this process are in percentage, in years, product, growth, success.

Bar Chart Ppt PowerPoint Presentation Show Format Ideas
This is a bar chart ppt powerpoint presentation show format ideas. This is a two stage process. The stages in this process are bar graph, growth, success, business, marketing.
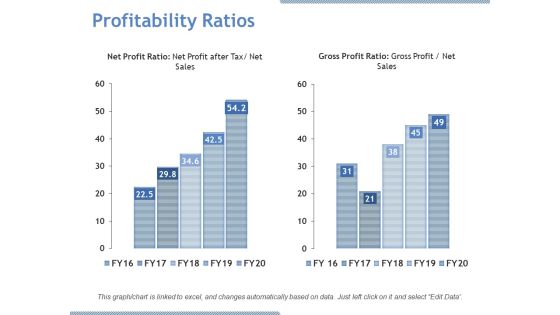
Profitability Ratios Ppt PowerPoint Presentation File Portrait
This is a profitability ratios ppt powerpoint presentation file portrait. This is a two stage process. The stages in this process are net profit ratio, gross profit ratio, growth.
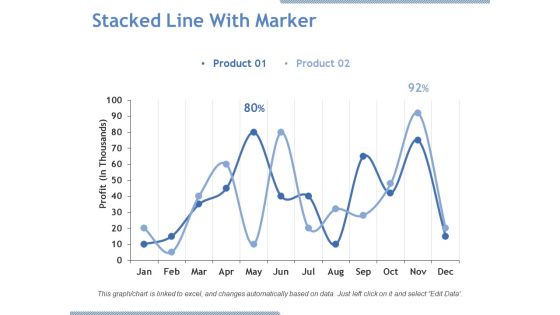
Stacked Line With Marker Ppt PowerPoint Presentation Pictures Graphics Download
This is a stacked line with marker ppt powerpoint presentation pictures graphics download. This is a two stage process. The stages in this process are product, profit, line chart, business, growth.

Area Chart Ppt PowerPoint Presentation Infographic Template Model
This is a area chart ppt powerpoint presentation infographic template model. This is a two stage process. The stages in this process are product, area chart, growth, percentage, success.

Clustered Column Line Ppt PowerPoint Presentation Topics
This is a clustered column line ppt powerpoint presentation topics. This is a three stage process. The stages in this process are product, in percentage, growth, bar graph, business.

Environmental Issues And General Business Affairs Ppt PowerPoint Presentation Good
This is a environmental issues and general business affairs ppt powerpoint presentation good. This is a one stage process. The stages in this process are environmental, growth, strategy, business, success.

Competitor Market Share And Sales Revenues Ppt PowerPoint Presentation Model Graphic Images
This is a competitor market share and sales revenues ppt powerpoint presentation model graphic images. This is a five stage process. The stages in this process are competitor, own business, growth, success.

Area Chart Ppt PowerPoint Presentation Show Professional
This is a area chart ppt powerpoint presentation show professional. This is a two stage process. The stages in this process are product, in percentage, area chart, growth, success.

Combo Chart Ppt PowerPoint Presentation Pictures Summary
This is a combo chart ppt powerpoint presentation pictures summary. This is a three stage process. The stages in this process are product, market size, growth rate, bar graph, success.

Area Chart Ppt PowerPoint Presentation Inspiration Graphics
This is a area chart ppt powerpoint presentation inspiration graphics. This is a two stage process. The stages in this process are product, area chart, business, growth, sales in percentage.

Bar Graph Ppt PowerPoint Presentation Portfolio Slide Portrait
This is a bar graph ppt powerpoint presentation portfolio slide portrait. This is a three stage process. The stages in this process are product, sales in percentage, bar graph, growth, success.

Control Chart Template 1 Ppt PowerPoint Presentation Infographic Template Deck
This is a control chart template 1 ppt powerpoint presentation infographic template deck. This is a one stage process. The stages in this process are control chart, growth, finance, marketing, strategy, business.

Control Chart Template 2 Ppt PowerPoint Presentation Icon Mockup
This is a control chart template 2 ppt powerpoint presentation icon mockup. This is a one stage process. The stages in this process are control chart, growth, finance, marketing, strategy, business.

Basic Regression Model Ppt PowerPoint Presentation Pictures Layout Ideas
This is a basic regression model ppt powerpoint presentation pictures layout ideas. This is a one stage process. The stages in this process are linear periodization, linear growth, linear progression.

Regression Line Chart Ppt PowerPoint Presentation Visual Aids Summary
This is a regression line chart ppt powerpoint presentation visual aids summary. This is a two stage process. The stages in this process are linear periodization, linear growth, linear progression.

Combo Chart Ppt PowerPoint Presentation Model Microsoft
This is a combo chart ppt powerpoint presentation model microsoft. This is a three stage process. The stages in this process are combo chart, product, market size, growth rate.
Stacked Column Ppt PowerPoint Presentation Icon Inspiration
This is a stacked column ppt powerpoint presentation icon inspiration. This is a two stage process. The stages in this process are stacked column, product, sales, growth, sales in percentage.

Clustered Column Ppt PowerPoint Presentation Icon Objects
This is a clustered column ppt powerpoint presentation icon objects. This is a two stage process. The stages in this process are clustered column, product, growth, finance, bar graph.
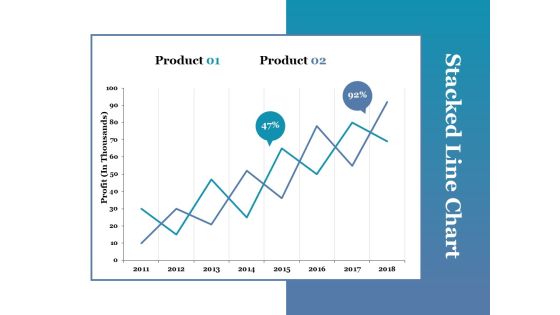
Stacked Line Chart Ppt PowerPoint Presentation Portfolio Picture
This is a stacked line chart ppt powerpoint presentation portfolio picture. This is a two stage process. The stages in this process are stacked line chart, product, profit, growth.

Earned Value Ppt PowerPoint Presentation Gallery Design Templates
This is a earned value ppt powerpoint presentation gallery design templates. This is a three stage process. The stages in this process are planned value, earned value, actual cost, growth, finance.

Combo Chart Ppt PowerPoint Presentation Gallery Diagrams
This is a combo chart ppt powerpoint presentation gallery diagrams. This is a three stage process. The stages in this process are combo chart, market size, product, in years, growth rate.

Scatter With Smooth Lines And Markers Ppt PowerPoint Presentation Pictures Deck
This is a scatter with smooth lines and markers ppt powerpoint presentation pictures deck. This is a three stage process. The stages in this process are product, finance, management, business, growth.

Bubble Chart Ppt PowerPoint Presentation Infographic Template Layouts
This is a bubble chart ppt powerpoint presentation infographic template layouts. This is a two stage process. The stages in this process are bubble chart, product, sales in percentage, growth.

Column Chart Ppt PowerPoint Presentation Gallery Background Images
This is a column chart ppt powerpoint presentation gallery background images. This is a two stage process. The stages in this process are column chart, product, year, growth, expenditure.

Column Chart Ppt PowerPoint Presentation Slides Show
This is a column chart ppt powerpoint presentation slides show. This is a two stage process. The stages in this process are column chart, product, sales in percentage, financial year, growth.
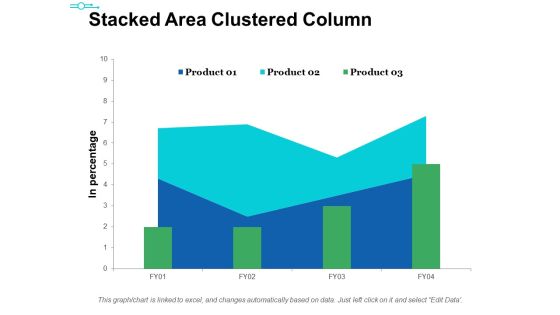
Stacked Area Clustered Column Ppt PowerPoint Presentation Ideas Themes
This is a stacked area clustered column ppt powerpoint presentation ideas themes. This is a three stage process. The stages in this process are product, in percentage, bar graph, area chart, growth.
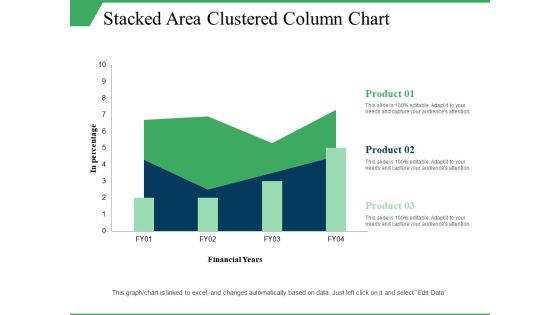
Stacked Area Clustered Column Chart Ppt PowerPoint Presentation Visual Aids Model
This is a stacked area clustered column chart ppt powerpoint presentation visual aids model. This is a three stage process. The stages in this process are in percentage, product, financial years, growth, column chart.

Area Chart Ppt PowerPoint Presentation Inspiration Icons Ppt PowerPoint Presentation Professional File Formats
This is a area chart ppt powerpoint presentation inspiration icons ppt powerpoint presentation professional file formats. This is a two stage process. The stages in this process are area chart, product, percentage, business, growth.
Stacked Column Ppt PowerPoint Presentation Icon Deck Ppt PowerPoint Presentation Pictures Infographic Template
This is a stacked column ppt powerpoint presentation icon deck ppt powerpoint presentation pictures infographic template. This is a two stage process. The stages in this process are stacked column, sales, percentage, product, growth.

Column Chart Ppt PowerPoint Presentation Icon Show
This is a column chart ppt powerpoint presentation icon show. This is a two stage process. The stages in this process are column chart, product, years, bar graph, growth.

Combo Chart Ppt PowerPoint Presentation Slides Outline
This is a combo chart ppt powerpoint presentation slides outline. This is a three stage process. The stages in this process are combo chart, growth, product, financial year, business.
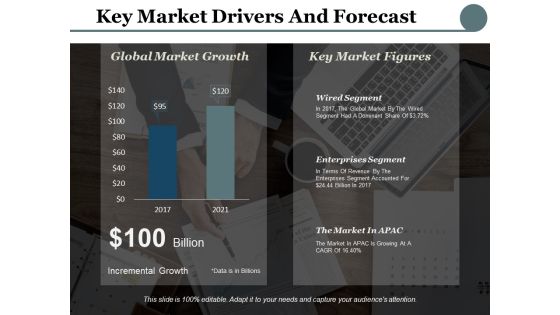
Key Market Drivers And Forecast Ppt PowerPoint Presentation Styles Format Ideas
This is a key market drivers and forecast ppt powerpoint presentation styles format ideas. This is a two stage process. The stages in this process are global market growth, enterprises segment, business, marketing, market drivers.

Key Market Drivers And Forecast Ppt PowerPoint Presentation Summary Templates
This is a key market drivers and forecast ppt powerpoint presentation summary templates. This is a two stage process. The stages in this process are key market drivers, forecast, growth, bar graph, business.
 Home
Home