Level Meter
Speed Level Meter Icon Ppt Powerpoint Presentation Inspiration Slides
This is a speed level meter icon ppt powerpoint presentation inspiration slides. This is a four stage process. The stages in this process are accelerator, seed accelerators, startup accelerator.
Client Satisfaction Level Meter Vector Icon Ppt PowerPoint Presentation Gallery Structure PDF
Presenting this set of slides with name client satisfaction level meter vector icon ppt powerpoint presentation gallery structure pdf. This is a three stage process. The stages in this process are client satisfaction level meter vector icon. This is a completely editable PowerPoint presentation and is available for immediate download. Download now and impress your audience.

Three Levels Risk Assessment Meter Ppt PowerPoint Presentation Infographics Themes
This is a three levels risk assessment meter ppt powerpoint presentation infographics themes. This is a three stage process. The stages in this process are risk meter, risk speedometer, hazard meter.
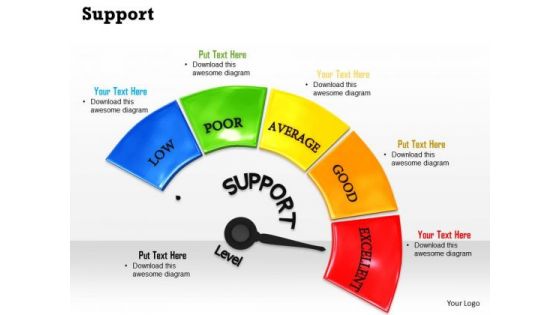
Stock Photo Support Meter With Excellent Level Pwerpoint Slide
This graphic image has been crafted with graphic of meter which have text support. This image shows the excellent level on the meter. Judge the quality of support for any business and display it in your presentation.
Risk Meter Indicating Extreme Level Ppt PowerPoint Presentation Icon Template
This is a risk meter indicating extreme level ppt powerpoint presentation icon template. This is a five stage process. The stages in this process are risk meter, risk speedometer, hazard meter.

Stock Photo Meter Indicating Maximum Level Of Profit PowerPoint Slide
Display the concept of profit growth with this image. This image has been designed with graphics of meter indicating maximum level of profit. Use this image to make business presentations.

Stock Photo Profit Meter At Maximum Level PowerPoint Slide
Display the concept of profit growth with this image. This image has been designed with graphics of meter indicating maximum level of profit. Use this image to make business presentations.

Stock Photo Meter Showing Excellent Level Of Quality PowerPoint Slide
This image is designed with 3d meter with business quality representation. Use this image in any business presentations to display various quality levels. This image is a powerful tool for business processes to exhibit quality and its levels along with its factors.
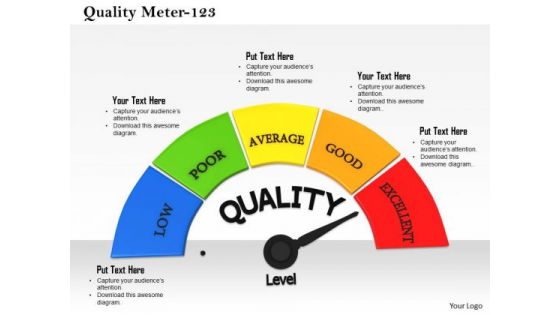
Stock Photo Meter Indicating Maximum Quality Level PowerPoint Slide
This image has been designed with graphics of meter indicating maximum level of quality. Concept of maintaining best quality can be explained with this image. Use this image to make business presentations.
Measurement Of Blood Glucose Levels With Hemoglobin Meter Ppt PowerPoint Presentation Icon Layouts PDF
Pitch your topic with ease and precision using this measurement of blood glucose levels with hemoglobin meter ppt powerpoint presentation icon layouts pdf. This layout presents information on measurement of blood glucose levels with hemoglobin meter. It is also available for immediate download and adjustment. So, changes can be made in the color, design, graphics or any other component to create a unique layout.
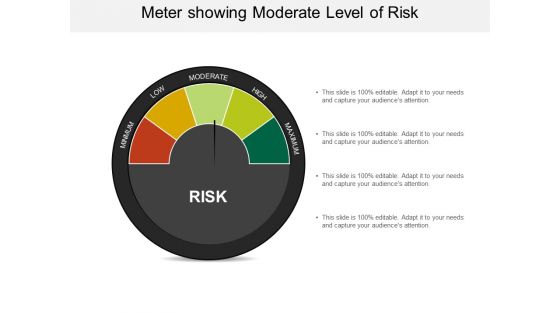
Meter Showing Moderate Level Of Risk Ppt PowerPoint Presentation Model Summary
This is a meter showing moderate level of risk ppt powerpoint presentation model summary. This is a four stage process. The stages in this process are risk meter, risk speedometer, hazard meter.

Risk Meters Showing Risk Levels Ppt PowerPoint Presentation Summary Example
This is a risk meters showing risk levels ppt powerpoint presentation summary example. This is a three stage process. The stages in this process are risk meter, risk speedometer, hazard meter.
Meter Showing High Risk Level Vector Icon Ppt PowerPoint Presentation Gallery Clipart PDF
Presenting this set of slides with name meter showing high risk level vector icon ppt powerpoint presentation gallery clipart pdf. This is a one stage process. The stage in this process is meter showing high risk level vector icon. This is a completely editable PowerPoint presentation and is available for immediate download. Download now and impress your audience.
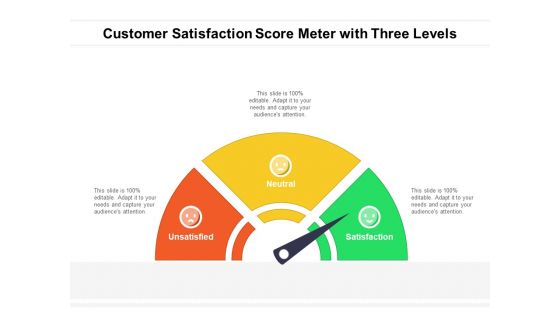
Customer Satisfaction Score Meter With Three Levels Ppt PowerPoint Presentation Gallery Smartart PDF
Presenting customer satisfaction score meter with three levels ppt powerpoint presentation gallery smartart pdf to dispense important information. This template comprises three stages. It also presents valuable insights into the topics including unsatisfied, neutral, satisfaction. This is a completely customizable PowerPoint theme that can be put to use immediately. So, download it and address the topic impactfully.

Meter Gauge Showing Three Levels Of Risk Ppt PowerPoint Presentation Pictures Graphics
This is a meter gauge showing three levels of risk ppt powerpoint presentation pictures graphics. This is a four stage process. The stages in this process are risk meter, risk speedometer, hazard meter.

Hazard Meter Showing Three Danger Levels Ppt PowerPoint Presentation Infographic Template Examples
This is a hazard meter showing three danger levels ppt powerpoint presentation infographic template examples. This is a five stage process. The stages in this process are risk meter, risk speedometer, hazard meter.

Meter Showing Business Risk Levels Ppt PowerPoint Presentation Show Slide PDF
Persuade your audience using this meter showing business risk levels ppt powerpoint presentation show slide pdf. This PPT design covers three stages, thus making it a great tool to use. It also caters to a variety of topics including low, medium, high. Download this PPT design now to present a convincing pitch that not only emphasizes the topic but also showcases your presentation skills.

Risk Meter With Pointer In Center Showing Medium Level Ppt PowerPoint Presentation Portfolio Templates
This is a risk meter with pointer in center showing medium level ppt powerpoint presentation portfolio templates. This is a three stage process. The stages in this process are risk meter, risk speedometer, hazard meter.
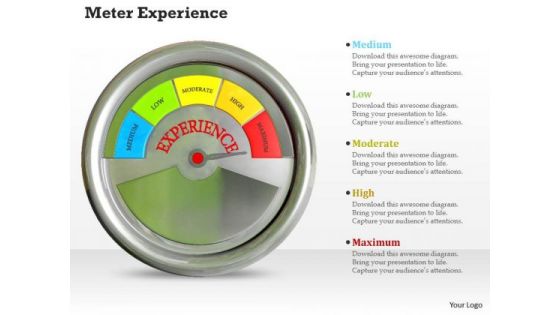
Stock Photo Meter Experience PowerPoint Slide
This image contains graphics of 3d meter indicating maximum level of experience. This image is an excellent tool to give an ideal presentation. Special effects of this image will surely interest the audience.

Business Diagram Meter Pointing On Poor Word Presentation Template
Graphic of meter has been used to design this power point template. This diagram contains the graphic of meter to display performance levels. Use this business diagram to make attractive presentations.
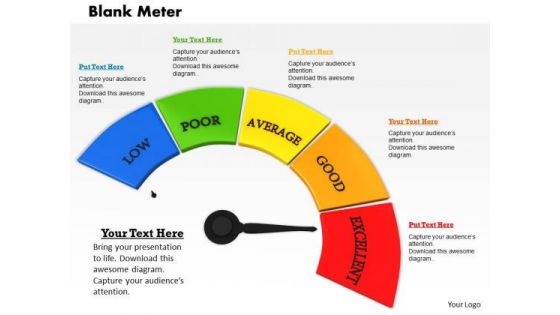
Stock Photo 3d Unique Meter With Low Medium And High Value PowerPoint Slide
This professional image displays graphics of conceptual meter. This meter depicts various levels. You can download this image to make presentations on team performance. Above image provides the ideal backdrop to make interactive presentations.
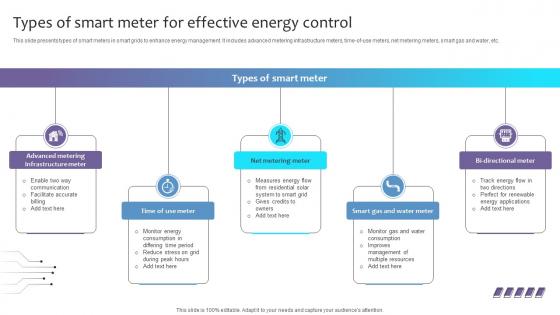
Empowering The Future Types Of Smart Meter For Effective Energy Control IoT SS V
This slide presents types of smart meters in smart grids to enhance energy management. It includes advanced metering infrastructure meters, time-of-use meters, net metering meters, smart gas and water, etc. Here you can discover an assortment of the finest PowerPoint and Google Slides templates. With these templates, you can create presentations for a variety of purposes while simultaneously providing your audience with an eye-catching visual experience. Download Empowering The Future Types Of Smart Meter For Effective Energy Control IoT SS V to deliver an impeccable presentation. These templates will make your job of preparing presentations much quicker, yet still, maintain a high level of quality. Slidegeeks has experienced researchers who prepare these templates and write high-quality content for you. Later on, you can personalize the content by editing the Empowering The Future Types Of Smart Meter For Effective Energy Control IoT SS V.
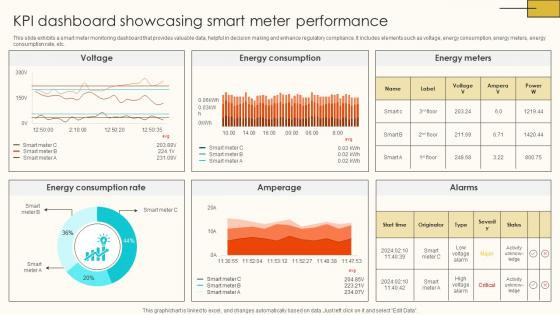
KPI Dashboard Showcasing Smart Meter Internet Of Things Solutions To Enhance Energy IoT SS V
This slide exhibits a smart meter monitoring dashboard that provides valuable data, helpful in decision making and enhance regulatory compliance. It includes elements such as voltage, energy consumption, energy meters, energy consumption rate, etc. Here you can discover an assortment of the finest PowerPoint and Google Slides templates. With these templates, you can create presentations for a variety of purposes while simultaneously providing your audience with an eye-catching visual experience. Download KPI Dashboard Showcasing Smart Meter Internet Of Things Solutions To Enhance Energy IoT SS V to deliver an impeccable presentation. These templates will make your job of preparing presentations much quicker, yet still, maintain a high level of quality. Slidegeeks has experienced researchers who prepare these templates and write high-quality content for you. Later on, you can personalize the content by editing the KPI Dashboard Showcasing Smart Meter Internet Of Things Solutions To Enhance Energy IoT SS V.
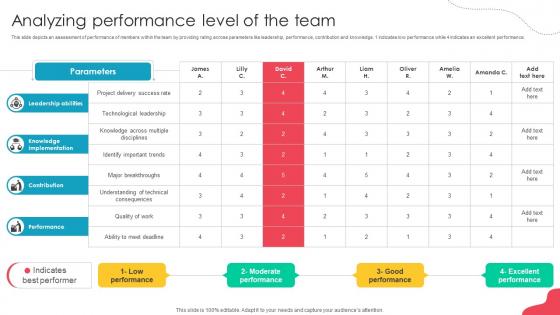
Unlocking Potential Enhancing Analyzing Performance Level Of The Team
This slide depicts an assessment of performance of members within the team by providing rating across parameters like leadership, performance, contribution and knowledge. 1 indicates low performance while 4 indicates an excellent performance. Do you have to make sure that everyone on your team knows about any specific topic I yes, then you should give Unlocking Potential Enhancing Analyzing Performance Level Of The Team a try. Our experts have put a lot of knowledge and effort into creating this impeccable Unlocking Potential Enhancing Analyzing Performance Level Of The Team. You can use this template for your upcoming presentations, as the slides are perfect to represent even the tiniest detail. You can download these templates from the Slidegeeks website and these are easy to edit. So grab these today

Key Performance Indicators Satisfaction Level Ppt File Deck PDF
This slide shows the Key performance indicators which helps the company to achieve their targets which includes total number of customers, customer satisfaction level, geographical coverage etc. Deliver an awe inspiring pitch with this creative key performance indicators satisfaction level ppt file deck pdf bundle. Topics like key performance indicator, customer satisfaction level, geographical coverage, target can be discussed with this completely editable template. It is available for immediate download depending on the needs and requirements of the user.
Battery Level Indicator Vector Icon Ppt PowerPoint Presentation Outline Layouts
Presenting this set of slides with name battery level indicator vector icon ppt powerpoint presentation outline layouts. This is a six stage process. The stages in this process are battery level indicator vector icon. This is a completely editable PowerPoint presentation and is available for immediate download. Download now and impress your audience.

Organisational Level Employee Key Performance Indicators Performance Indicators Rules PDF
The following slide highlights the organisational level staff key performance Indicators illustrating key headings KPI, description, benchmark and value. It also depicts revenue per employee, profit per FTE, human capital ROI, absenteeism rate and overtime per employee Showcasing this set of slides titled Organisational Level Employee Key Performance Indicators Performance Indicators Rules PDF The topics addressed in these templates are Revenue Compensation, Overtime Employee, Benchmark All the content presented in this PPT design is completely editable. Download it and make adjustments in color, background, font etc. as per your unique business setting.
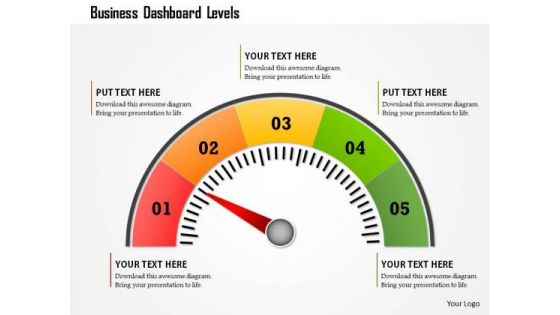
Business Framework Business Dashboard Levels PowerPoint Presentation
This business diagram displays colored meter with multiple levels. Use this diagram to display business process. This diagram can be used to indicate performance measures. This is an excellent diagram to impress your audiences.
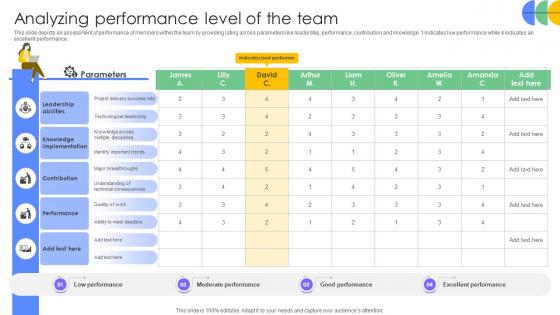
Driving Results Designing A Team Analyzing Performance Level Of The Team
This slide depicts an assessment of performance of members within the team by providing rating across parameters like leadership, performance, contribution and knowledge. 1 indicates low performance while 4 indicates an excellent performance. Slidegeeks is one of the best resources for PowerPoint templates. You can download easily and regulate Driving Results Designing A Team Analyzing Performance Level Of The Team for your personal presentations from our wonderful collection. A few clicks is all it takes to discover and get the most relevant and appropriate templates. Use our Templates to add a unique zing and appeal to your presentation and meetings. All the slides are easy to edit and you can use them even for advertisement purposes.
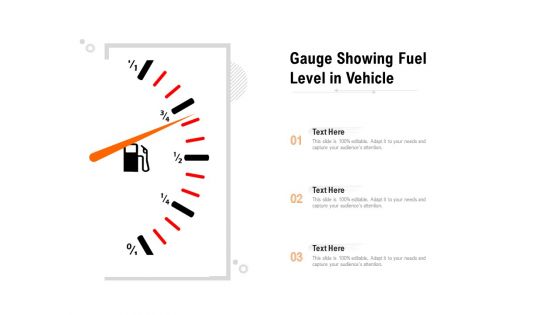
Gauge Showing Fuel Level In Vehicle Ppt PowerPoint Presentation Portfolio Picture PDF
Presenting gauge showing fuel level in vehicle ppt powerpoint presentation portfolio picture pdf to dispense important information. This template comprises three stages. It also presents valuable insights into the topics including gauge showing fuel level in vehicle. This is a completely customizable PowerPoint theme that can be put to use immediately. So, download it and address the topic impactfully.

Picture Of Fuel Gauge With Pointing Level Ppt PowerPoint Presentation Infographic Template Graphics PDF
Persuade your audience using this picture of fuel gauge with pointing level ppt powerpoint presentation infographic template graphics pdf. This PPT design covers two stages, thus making it a great tool to use. It also caters to a variety of topics including picture of fuel gauge with pointing level. Download this PPT design now to present a convincing pitch that not only emphasizes the topic but also showcases your presentation skills.
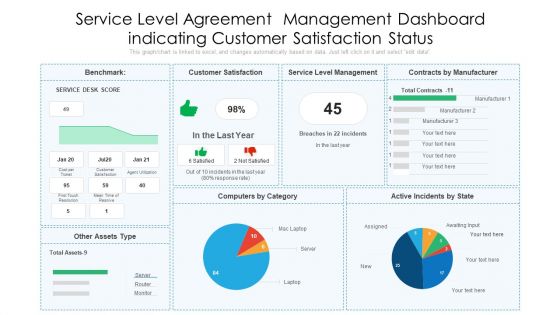
Service Level Agreement Management Dashboard Indicating Customer Satisfaction Status Designs PDF
Pitch your topic with ease and precision using this service level agreement management dashboard indicating customer satisfaction status designs pdf. This layout presents information on customer satisfaction, service level management, contracts by manufacturer. It is also available for immediate download and adjustment. So, changes can be made in the color, design, graphics or any other component to create a unique layout.

Consumer Complaint Procedure Employees Hourly Service Level Dashboard Ppt Infographics Professional PDF
This slide covers the hourly service records for the employees with indicators such as total hours worked, last hours worked and many more. Deliver and pitch your topic in the best possible manner with this consumer complaint procedure employees hourly service level dashboard ppt infographics professional pdf. Use them to share invaluable insights on employees hourly service level dashboard, hourly service level, skill and impress your audience. This template can be altered and modified as per your expectations. So, grab it now.

Consumer Complaint Handling Process Employees Hourly Service Level Dashboard Ppt Summary Inspiration PDF
This slide covers the hourly service records for the employees with indicators such as total hours worked, last hours worked and many more. Deliver and pitch your topic in the best possible manner with this consumer complaint handling process employees hourly service level dashboard ppt summary inspiration pdf. Use them to share invaluable insights on employees hourly service level dashboard and impress your audience. This template can be altered and modified as per your expectations. So, grab it now.
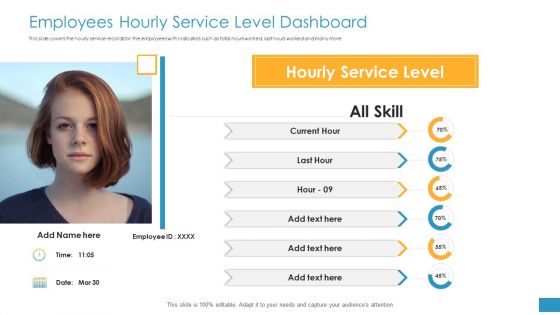
Employee Grievance Handling Process Employees Hourly Service Level Dashboard Sample PDF
This slide covers the hourly service records for the employees with indicators such as total hours worked, last hours worked and many more. Deliver and pitch your topic in the best possible manner with this employee grievance handling process employees hourly service level dashboard sample pdf. Use them to share invaluable insights on employees hourly service level dashboard and impress your audience. This template can be altered and modified as per your expectations. So, grab it now.
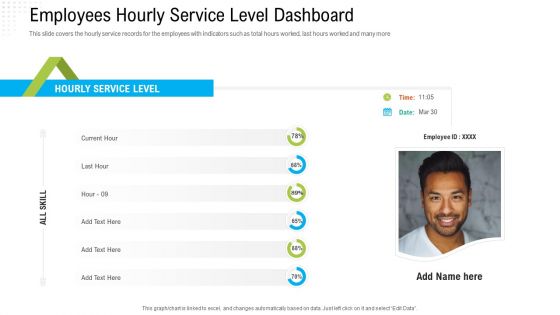
Robotization In Issues Management Employees Hourly Service Level Dashboard Ppt Pictures Maker PDF
This slide covers the hourly service records for the employees with indicators such as total hours worked, last hours worked and many more. Deliver and pitch your topic in the best possible manner with this robotization in issues management employees hourly service level dashboard ppt pictures maker pdf. Use them to share invaluable insights on employees hourly service level dashboard and impress your audience. This template can be altered and modified as per your expectations. So, grab it now.
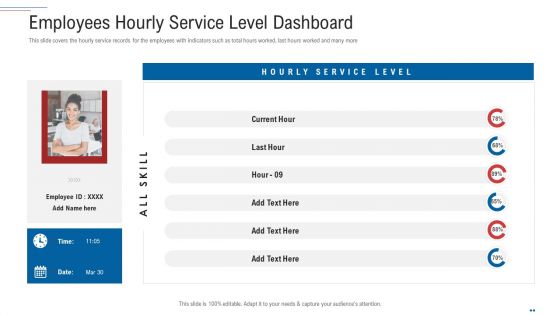
Customer Complaint Handling Process Employees Hourly Service Level Dashboard Rules PDF
This slide covers the hourly service records for the employees with indicators such as total hours worked, last hours worked and many more. Deliver and pitch your topic in the best possible manner with this customer complaint handling process employees hourly service level dashboard rules pdf. Use them to share invaluable insights on employees hourly service level dashboard and impress your audience. This template can be altered and modified as per your expectations. So, grab it now.
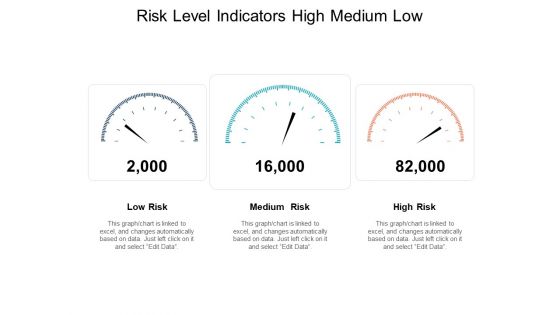
Risk Level Indicators High Medium Low Ppt PowerPoint Presentation Pictures Template
Presenting this set of slides with name risk level indicators high medium low ppt powerpoint presentation pictures template. This is a three stage process. The stages in this process are high low risk, risk con, warning. This is a completely editable PowerPoint presentation and is available for immediate download. Download now and impress your audience.

Key Performance Indicators For Service Level Agreement Ppt PowerPoint Presentation Gallery Samples PDF
Presenting this set of slides with name key performance indicators for service level agreement ppt powerpoint presentation gallery samples pdf. The topics discussed in these slides are service, current compliance, history. This is a completely editable PowerPoint presentation and is available for immediate download. Download now and impress your audience.

Service Level Agreement Management Framework With Service Quality And Data Reporting Formats PDF
Pitch your topic with ease and precision using this service level agreement management framework with service quality and data reporting formats pdf. This layout presents information on data flow designer, key performance indicator configuration. It is also available for immediate download and adjustment. So, changes can be made in the color, design, graphics or any other component to create a unique layout.

Service Level Agreement KPI Dashboard Indicating Violation Count And Overdue Requests Diagrams PDF
This graph or chart is linked to excel, and changes automatically based on data. Just left click on it and select Edit Data. Showcasing this set of slides titled Service Level Agreement KPI Dashboard Indicating Violation Count And Overdue Requests Diagrams PDF. The topics addressed in these templates are Total Requests Category, Total Requests Status, Urgent Requests. All the content presented in this PPT design is completely editable. Download it and make adjustments in color, background, font etc. as per your unique business setting.
Budget Benchmark Report For Oncology Clinical Studies At Global Level Icons PDF
The slide showcases budget benchmarking to gauge and improve financial results by selecting few operating ratios by which company wants to measure its results and manage assets. Showcasing this set of slides titled Budget Benchmark Report For Oncology Clinical Studies At Global Level Icons PDF. The topics addressed in these templates are Benchmark Source, Key Insights, Actual Budget. All the content presented in this PPT design is completely editable. Download it and make adjustments in color, background, font etc. as per your unique business setting.

Business Framework Client Satisfaction Levels PowerPoint Presentation
Graphic of black meter has been used to design this business diagram. This business slide displays the concept of client satisfaction with different levels. Use this editable diagram for customer and business related presentations.
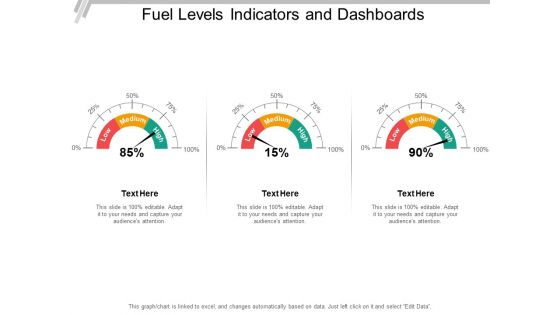
Fuel Levels Indicators And Dashboards Ppt PowerPoint Presentation Outline Skills
This is a fuel levels indicators and dashboards ppt powerpoint presentation outline skills. This is a three stage process. The stages in this process are fuel gauge, gas gauge, fuel containers.

Risk Metrics Dashboard With Exposure Levels Template PDF
This slide illustrates graphical representation of risk key performance indicators. It includes risk levels, risk exposure and impact of risks on business. Pitch your topic with ease and precision using this Risk Metrics Dashboard With Exposure Levels Template PDF. This layout presents information on Risk Metrics Dashboard With Exposure Levels. It is also available for immediate download and adjustment. So, changes can be made in the color, design, graphics or any other component to create a unique layout.

Data Center Architecture Model Tier Levels Ppt Gallery Model PDF
This slide indicates the four-tier data center architecture model and their key roles in order to support the smooth working of the entire structure. It includes different levels of tiers along with its uptime and downtime. Persuade your audience using this Data Center Architecture Model Tier Levels Ppt Gallery Model PDF. This PPT design covers four stages, thus making it a great tool to use. It also caters to a variety of topics including Dedicated Infrastructure, Redundant Infrastructure, Fully Fault Tolerant. Download this PPT design now to present a convincing pitch that not only emphasizes the topic but also showcases your presentation skills.

Resource Change Analysis With Score Levels Formats PDF
The following slide provides a change assessment map for resources and indicate synchronization between people, processes, systems and performance measurement. It consists of statement with score levels and actions to be taken for project. Pitch your topic with ease and precision using this Resource Change Analysis With Score Levels Formats PDF. This layout presents information on Capacity, Capability, Project Manager, Resource Change. It is also available for immediate download and adjustment. So, changes can be made in the color, design, graphics or any other component to create a unique layout.
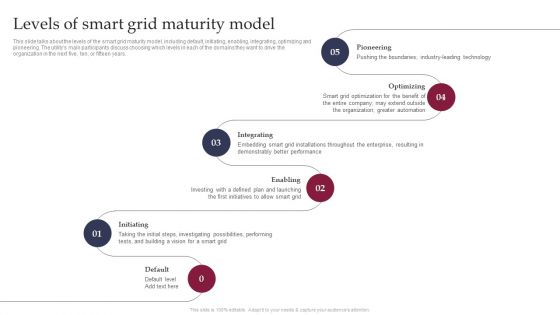
Smart Grid Technology Levels Of Smart Grid Maturity Model Topics PDF
Customer Satisfaction Levels High Medium Low Indicator Dashboard Ppt PowerPoint Presentation Icon Show
This is a customer satisfaction levels high medium low indicator dashboard ppt powerpoint presentation icon show. This is a six stage process. The stages in this process are performance dashboard, performance meter, performance kpi.

Fuel Gauge Indicating Empty And Full Levels Ppt PowerPoint Presentation Portfolio Clipart PDF
Presenting fuel gauge indicating empty and full levels ppt powerpoint presentation portfolio clipart pdf to dispense important information. This template comprises one stages. It also presents valuable insights into the topics including fuel gauge indicating empty and full levels. This is a completely customizable PowerPoint theme that can be put to use immediately. So, download it and address the topic impactfully.
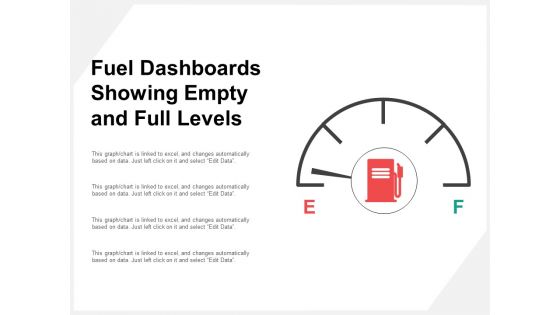
Fuel Dashboards Showing Empty And Full Levels Ppt PowerPoint Presentation Professional Slide Portrait
This is a fuel dashboards showing empty and full levels ppt powerpoint presentation professional slide portrait. This is a four stage process. The stages in this process are fuel gauge, gas gauge, fuel containers.

Architecture Of Cloud Storage Ppt PowerPoint Presentation File Styles PDF
This slide describes the architecture of cloud storage, the technology its built on, its similarity with cloud computing in terms of accessible interfaces, scalability, and metered resources. Here you can discover an assortment of the finest PowerPoint and Google Slides templates. With these templates, you can create presentations for a variety of purposes while simultaneously providing your audience with an eye catching visual experience. Download Architecture Of Cloud Storage Ppt PowerPoint Presentation File Styles PDF to deliver an impeccable presentation. These templates will make your job of preparing presentations much quicker, yet still, maintain a high level of quality. Slidegeeks has experienced researchers who prepare these templates and write high quality content for you. Later on, you can personalize the content by editing the Architecture Of Cloud Storage Ppt PowerPoint Presentation File Styles PDF.

MSW Management Waste Bin Kpi Dashboard Clipart PDF
This slide covers the Key performance indicator for waste bins such as fill level, odour level and weight. Deliver an awe inspiring pitch with this creative MSW Management Waste Bin Kpi Dashboard Clipart Pdf bundle. Topics like waste bin kpi dashboard can be discussed with this completely editable template. It is available for immediate download depending on the needs and requirements of the user.

Leading Indicators Currency Crises Ppt PowerPoint Presentation File Background Designs Cpb
Presenting this set of slides with name latest multi level marketing ppt powerpoint presentation layouts display cpb. This is an editable Powerpoint four stages graphic that deals with topics like latest multi level marketing to help convey your message better graphically. This product is a premium product available for immediate download and is 100 percent editable in Powerpoint. Download this now and use it in your presentations to impress your audience.
Waste Bin Kpi Dashboard Ppt PowerPoint Presentation Icon Show PDF
This slide covers the Key performance indicator for waste bins such as fill level, odour level and weight. Deliver an awe inspiring pitch with this creative waste bin kpi dashboard ppt powerpoint presentation icon show pdf bundle. Topics like waste bin kpi dashboard can be discussed with this completely editable template. It is available for immediate download depending on the needs and requirements of the user.
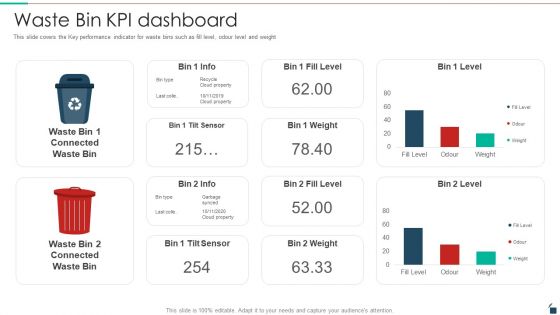
Waste Bin KPI Dashboard Resources Recycling And Waste Management Template PDF
This slide covers the Key performance indicator for waste bins such as fill level, odour level and weight. Deliver an awe inspiring pitch with this creative waste bin kpi dashboard resources recycling and waste management template pdf bundle. Topics like waste bin kpi dashboard can be discussed with this completely editable template. It is available for immediate download depending on the needs and requirements of the user.

Dangerous Waste Management Waste Bin KPI Dashboard Formats PDF
This slide covers the Key performance indicator for waste bins such as fill level, odour level and weight. Deliver and pitch your topic in the best possible manner with this dangerous waste management waste bin kpi dashboard formats pdf. Use them to share invaluable insights on waste bin kpi dashboard and impress your audience. This template can be altered and modified as per your expectations. So, grab it now.

Factory Waste Management Waste Bin Kpi Dashboard Demonstration PDF
This slide covers the Key performance indicator for waste bins such as fill level, odour level and weight Deliver and pitch your topic in the best possible manner with this factory waste management waste bin kpi dashboard demonstration pdf. Use them to share invaluable insights on waste bin kpi dashboard and impress your audience. This template can be altered and modified as per your expectations. So, grab it now.
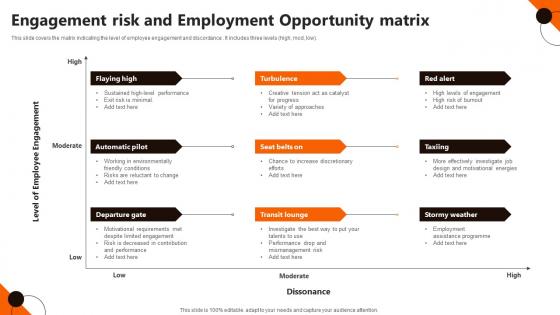
Engagement Risk And Employment Opportunity Matrix Brochure Pdf
This slide covers the matrix indicating the level of employee engagement and discordance. It includes three levels high, mod, low. Pitch your topic with ease and precision using this Engagement Risk And Employment Opportunity Matrix Brochure Pdf. This layout presents information on Flaying High, Automatic Pilot, Transit Lounge. It is also available for immediate download and adjustment. So, changes can be made in the color, design, graphics or any other component to create a unique layout.

Essential Cybersecurity Key Performance Indicators Download Pdf
Showcasing this set of slides titled Essential Cybersecurity Key Performance Indicators Download Pdf The topics addressed in these templates are Level Preparedness, Internal Networks, Intrusion Attempts All the content presented in this PPT design is completely editable. Download it and make adjustments in color, background, font etc. as per your unique business setting.
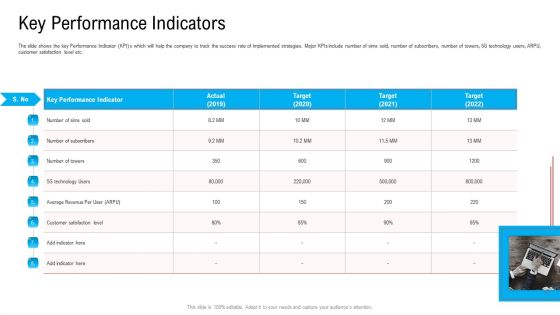
Key Performance Indicators Ppt Infographics Mockup PDF
The slide shows the key Performance Indicator KPI s which will help the company to track the success rate of implemented strategies. Major KPIs include number of sims sold, number of subscribers, number of towers, 5G technology users, ARPU, customer satisfaction level etc. This is a key performance indicators ppt infographics mockup pdf template with various stages. Focus and dispense information on one stage using this creative set, that comes with editable features. It contains large content boxes to add your information on topics like key performance indicator, technology, customer satisfaction level, target, 2019 to 2022. You can also showcase facts, figures, and other relevant content using this PPT layout. Grab it now.

Key Performance Indicators Related To Dairy Company Introduction PDF
The slide shows the key Performance Indicator KPI s which will help the company to track the success rate of implemented strategies. Major KPIs include number of Dairy Products sold and Total Milk Production, Total Milk Plants, number of customers, customer satisfaction level etc.Deliver an awe inspiring pitch with this creative key performance indicators related to dairy company introduction pdf bundle. Topics like total milk production, customer satisfaction level, dairy products sold can be discussed with this completely editable template. It is available for immediate download depending on the needs and requirements of the user.
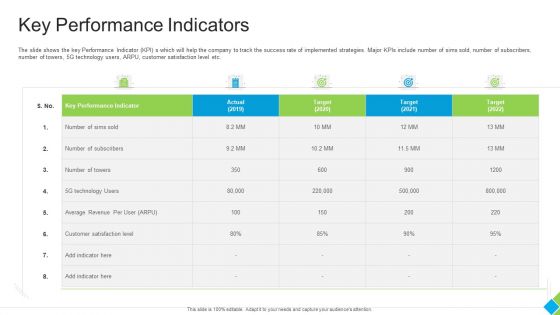
Diminishing Market Share Of A Telecommunication Firm Case Competition Key Performance Indicators Summary PDF
The slide shows the key Performance Indicator KPIs which will help the company to track the success rate of implemented strategies. Major KPIs include number of sims sold, number of subscribers, number of towers, 5G technology users, ARPU, customer satisfaction level etc. Deliver an awe inspiring pitch with this creative diminishing market share of a telecommunication firm case competition key performance indicators summary pdf bundle. Topics like technology, average revenue, customer satisfaction level, key performance indicator, target can be discussed with this completely editable template. It is available for immediate download depending on the needs and requirements of the user.
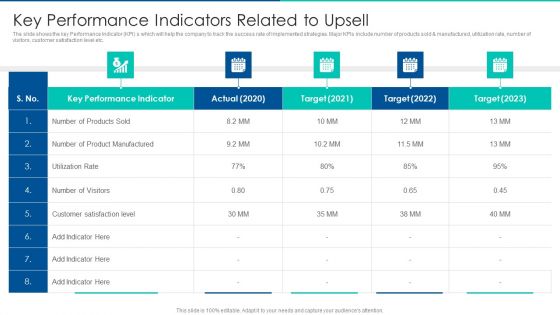
Sales Promotion Of Upgraded Product Through Upselling Key Performance Indicators Related To Upsell Information PDF
The slide shows the key Performance Indicator KPI s which will help the company to track the success rate of implemented strategies. Major KPIs include number of products sold and manufactured, utilization rate, number of visitors, customer satisfaction level etc. Deliver an awe inspiring pitch with this creative sales promotion of upgraded product through upselling key performance indicators related to upsell information pdf bundle. Topics like key performance indicator, customer satisfaction level, utilization rate can be discussed with this completely editable template. It is available for immediate download depending on the needs and requirements of the user.

Rising Construction Defect Claims Against The Corporation Key Performance Indicators Construction Company Infographics PDF
The slide shows the key Performance Indicator KPI s which will help the company to track the success rate of implemented strategies. Major KPIs include Number of construction projects, Number of construction defect, Total project cost, customer satisfaction level etc. Deliver an awe inspiring pitch with this creative rising construction defect claims against the corporation key performance indicators construction company infographics pdf bundle. Topics like performance, project, customer satisfaction level can be discussed with this completely editable template. It is available for immediate download depending on the needs and requirements of the user.
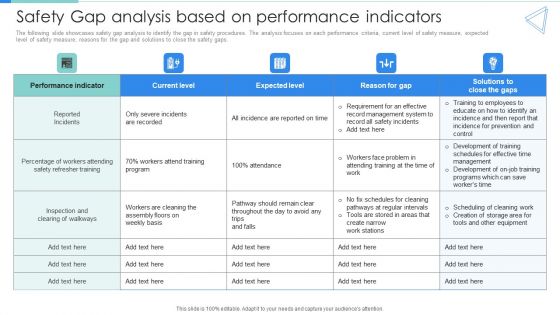
Deployment Of Workplace Safety Management Program Safety Gap Analysis Based On Performance Indicators Formats PDF
The following slide showcases safety gap analysis to identify the gap in safety procedures. The analysis focuses on each performance criteria, current level of safety measure, expected level of safety measure, reasons for the gap and solutions to close the safety gaps. Make sure to capture your audiences attention in your business displays with our gratis customizable Deployment Of Workplace Safety Management Program Safety Gap Analysis Based On Performance Indicators Formats PDF. These are great for business strategies, office conferences, capital raising or task suggestions. If you desire to acquire more customers for your tech business and ensure they stay satisfied, create your own sales presentation with these plain slides.

Loss Of Income And Financials Decline In An Automobile Organization Case Study Key Performance Indicators Brochure PDF
The slide shows the key Performance Indicator KPI s which will help the company to track the success rate of implemented strategies. Major KPIs include number of vehicle sold and manufactured, utilization rate, number of visitors, customer satisfaction level etc.Deliver an awe inspiring pitch with this creative loss of income and financials decline in an automobile organization case study key performance indicators brochure pdf bundle. Topics like key performance indicator, utilization rate, customer satisfaction level can be discussed with this completely editable template. It is available for immediate download depending on the needs and requirements of the user
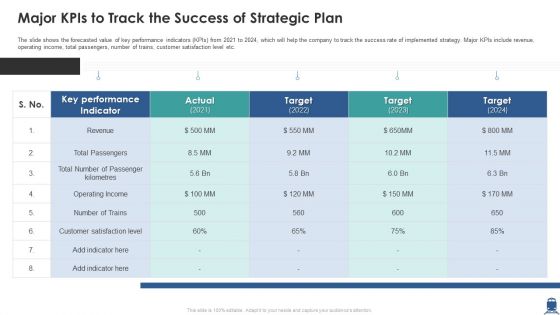
Major Kpis To Track The Success Of Strategic Plan Download PDF
The slide shows the forecasted value of key performance indicators KPIs from 2021 to 2024, which will help the company to track the success rate of implemented strategy. Major KPIs include revenue, operating income, total passengers, number of trains, customer satisfaction level etc. Deliver and pitch your topic in the best possible manner with this major kpis to track the success of strategic plan download pdf. Use them to share invaluable insights on revenue, key performance indicator, customer satisfaction level and impress your audience. This template can be altered and modified as per your expectations. So, grab it now.
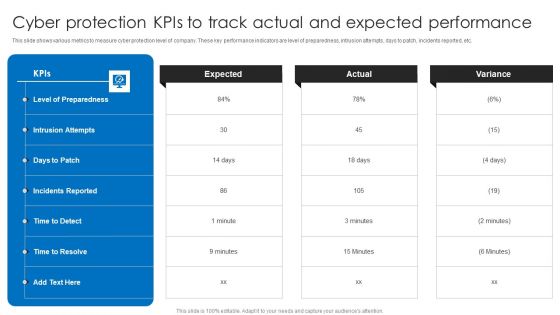
Cyber Protection Kpis To Track Actual And Expected Performance Structure PDF
This slide shows various metrics to measure cyber protection level of company. These key performance indicators are level of preparedness, intrusion attempts, days to patch, incidents reported, etc. Pitch your topic with ease and precision using this Cyber Protection Kpis To Track Actual And Expected Performance Structure PDF. This layout presents information on Cyber Protection Kpis, Track Actual Expected Performance. It is also available for immediate download and adjustment. So, changes can be made in the color, design, graphics or any other component to create a unique layout.
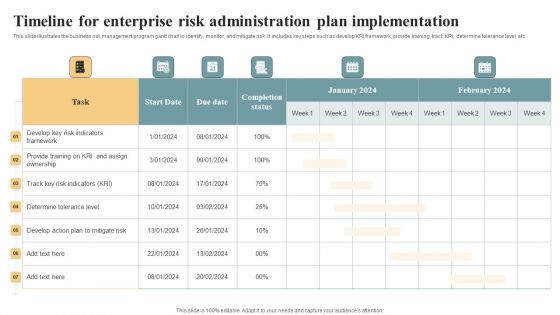
Timeline For Enterprise Risk Administration Plan Implementation Designs PDF
This slide illustrates the business risk management program gantt chart to identify, monitor, and mitigate risk. It includes key steps such as develop KRI framework, provide training, track KRI, determine tolerance level, etc. Showcasing this set of slides titled Timeline For Enterprise Risk Administration Plan Implementation Designs PDF. The topics addressed in these templates are Develop Key Risk, Indicators Framework, Determine Tolerance Level . All the content presented in this PPT design is completely editable. Download it and make adjustments in color, background, font etc. as per your unique business setting.
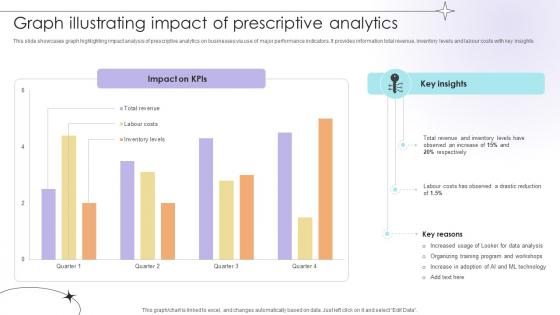
Graph Illustrating Impact Of Prescriptive Analytics Data Analytics SS V
This slide showcases graph highlighting impact analysis of prescriptive analytics on businesses via use of major performance indicators. It provides information total revenue, inventory levels and labour costs with key insights.Take your projects to the next level with our ultimate collection of Graph Illustrating Impact Of Prescriptive Analytics Data Analytics SS V. Slidegeeks has designed a range of layouts that are perfect for representing task or activity duration, keeping track of all your deadlines at a glance. Tailor these designs to your exact needs and give them a truly corporate look with your own brand colors they will make your projects stand out from the rest
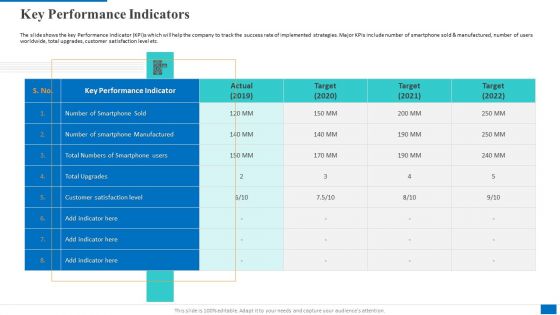
Key Performance Indicators Microsoft PDF
Deliver and pitch your topic in the best possible manner with this key performance indicators microsoft pdf. Use them to share invaluable insights on total numbers of smartphone users, key performance indicator, customer satisfaction level and impress your audience. This template can be altered and modified as per your expectations. So, grab it now.

Standard Approaches For Client Onboarding Journey Step 1 Create Registration Elements PDF
This slide provides an overview of signup process in customer onboarding. The steps included are providing user account alternatives, using meter, adding confirmed password, making all fields required, showing progress and confirming registration. Take your projects to the next level with our ultimate collection of Standard Approaches For Client Onboarding Journey Step 1 Create Registration Elements PDF. Slidegeeks has designed a range of layouts that are perfect for representing task or activity duration, keeping track of all your deadlines at a glance. Tailor these designs to your exact needs and give them a truly corporate look with your own brand colors they will make your projects stand out from the rest
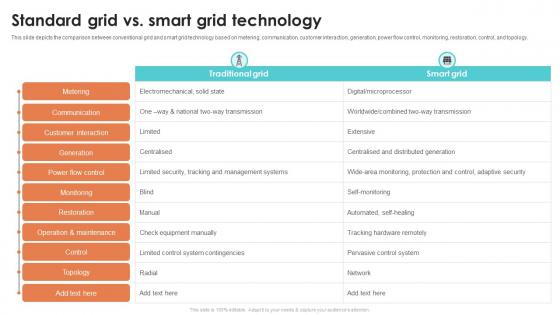
Standard Grid Vs Smart Grid Technology Smart Grid Working
This slide depicts the comparison between conventional grid and smart grid technology based on metering, communication, customer interaction, generation, power flow control, monitoring, restoration, control, and topology. Take your projects to the next level with our ultimate collection of Standard Grid Vs Smart Grid Technology Smart Grid Working Slidegeeks has designed a range of layouts that are perfect for representing task or activity duration, keeping track of all your deadlines at a glance. Tailor these designs to your exact needs and give them a truly corporate look with your own brand colors they will make your projects stand out from the rest
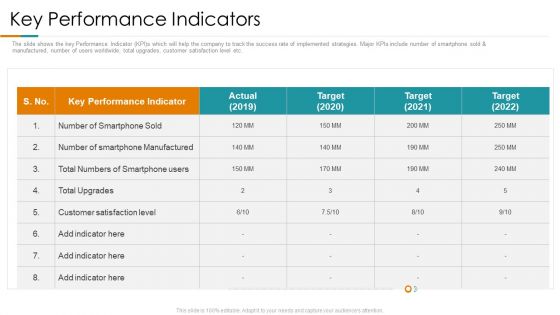
Key Performance Indicators Ppt Inspiration Layouts PDF
The slide shows the key Performance Indicator KPIs which will help the company to track the success rate of implemented strategies. Major KPIs include number of smartphone sold and manufactured, number of users worldwide, total upgrades, customer satisfaction level etc. Deliver an awe-inspiring pitch with this creative key performance indicators ppt inspiration layouts pdf. bundle. Topics like performance, target, manufactured can be discussed with this completely editable template. It is available for immediate download depending on the needs and requirements of the user.

Health And Safety Performance Measurements Key Risk Indicators Download PDF
This slide shows the different key indicators for safety performance measurement . It includes safety training, actions, events and reports with their level of completion.Showcasing this set of slides titled Health And Safety Performance Measurements Key Risk Indicators Download PDF The topics addressed in these templates are Safety Training, Actions Taken, Event Planned Executed All the content presented in this PPT design is completely editable. Download it and make adjustments in color, background, font etc. as per your unique business setting.

Case Competition Reduction In Existing Customer Of Telecommunication Company Key Performance Indicators Ppt Layouts Graphics Pictures PDF
This is a case competition reduction in existing customer of telecommunication company key performance indicators ppt layouts graphics pictures pdf template with various stages. Focus and dispense information on seven stages using this creative set, that comes with editable features. It contains large content boxes to add your information on topics like key performance indicator, subscribers, technology users, average revenue, customer satisfaction level . You can also showcase facts, figures, and other relevant content using this PPT layout. Grab it now.

Set Of Five Vertical Steps Powerpoint Templates
This slide has been professionally created for visual representation of steps of a process. The multicolored circles which have been arranged in can be used to depict individual steps in a systematic and organized manner. This template can be used to indicate a link between individuals and can also be used to represent Hierarchy of an organization. It would be one of the easiest ways to graphically represent the flow of information or data from the top level to the lower level or vice versa in a vertical manner. This slide can also be used to depict a planned course of action. Adequate space has been marked for description which can be modified or removed as per individual needs and requirements.
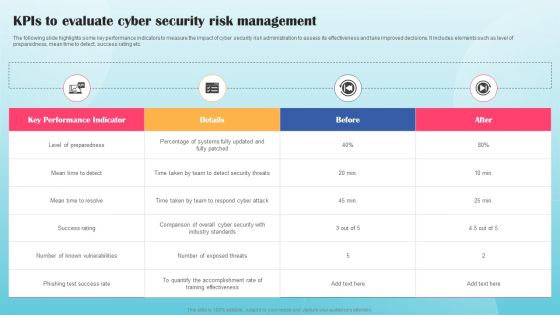
Kpis To Evaluate Cyber Security Risk Management Ppt PowerPoint Presentation File Outline PDF
The following slide highlights some key performance indicators to measure the impact of cyber security risk administration to assess its effectiveness and take improved decisions. It includes elements such as level of preparedness, mean time to detect, success rating etc. Take your projects to the next level with our ultimate collection of Kpis To Evaluate Cyber Security Risk Management Ppt PowerPoint Presentation File Outline PDF. Slidegeeks has designed a range of layouts that are perfect for representing task or activity duration, keeping track of all your deadlines at a glance. Tailor these designs to your exact needs and give them a truly corporate look with your own brand colors they will make your projects stand out from the rest.
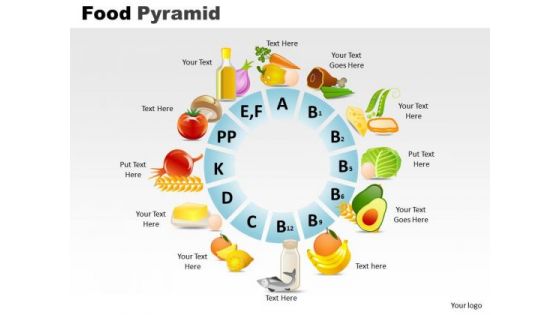
PowerPoint Slides Food Pyramid Editable Ppt Themes
PowerPoint Slides Food Pyramid Editable PPT Themes-A chart indicates various foods filling capacity and nutrition level in an amazing way to inspire people to adopt balance diet-Illustration, balanced, bar, bread, bun, butter, cake, calorie, calories, candy, carbohydrates, cereals, cheese, dairy, diet, egg, fats, fish, food, fresh, fruits, grains, guide, healthy, isolated, market, meat, nutritious, oil, outline, proteins, pyramid, shape, vector, vectors, vegetables-PowerPoint Slides Food Pyramid Editable PPT Themes

PowerPoint Templates Food Pyramid Growth Ppt Theme
PowerPoint Templates Food Pyramid Growth PPT Theme-This chart indicates various foods filling capacity and nutrition level in an amazing way to inspire people to adopt balance diet.-Illustration, balanced, bar, bread, bun, butter, cake, calorie, calories, candy, carbohydrates, cereals, cheese, dairy, diet, egg, fats, fish, food, fresh, fruits, grains, guide, healthy, isolated, market, meat, nutritious, oil, outline, proteins, pyramid, shape, vector, vectors, vegetables-PowerPoint Templates Food Pyramid Growth PPT Theme

Business Activities Planning For Employee Professional Growth Ppt PowerPoint Presentation Gallery Ideas PDF
Pitch your topic with ease and precision using this business activities planning for employee professional growth ppt powerpoint presentation gallery ideas pdf. This layout presents information on indicator, current status continuum, goal next status level on continuum. It is also available for immediate download and adjustment. So, changes can be made in the color, design, graphics or any other component to create a unique layout.
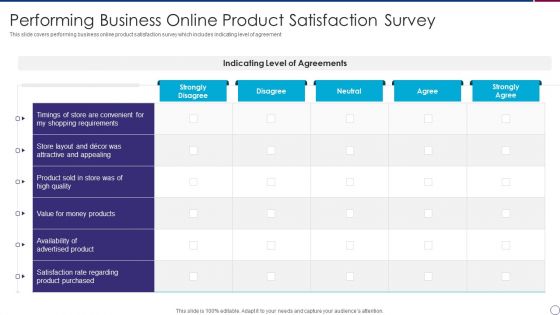
Performing Business Online Product Satisfaction Survey Diagrams PDF
This slide covers performing business online product satisfaction survey which includes indicating level of agreement.Pitch your topic with ease and precision using this Performing Business Online Product Satisfaction Survey Diagrams PDF This layout presents information on Familiarity Regarding, Evaluate The Product, Frequency Regarding It is also available for immediate download and adjustment. So, changes can be made in the color, design, graphics or any other component to create a unique layout.
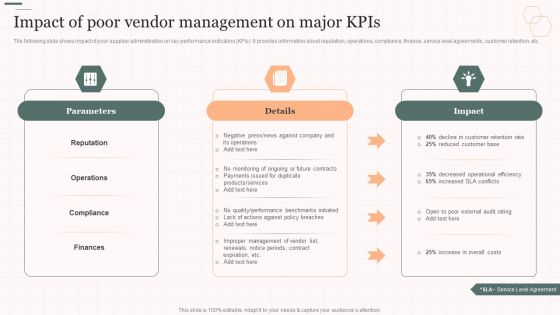
Impact Of Poor Vendor Management On Major Kpis Vendor Management Strategies Ideas PDF
The following slide shows impact of poor supplier administration on key performance indicators KPIs. It provides information about reputation, operations, compliance, finance, service level agreements, customer retention, etc. Deliver and pitch your topic in the best possible manner with this Impact Of Poor Vendor Management On Major Kpis Vendor Management Strategies Ideas PDF. Use them to share invaluable insights on Parameters, Decreased Operational, Compliance and impress your audience. This template can be altered and modified as per your expectations. So, grab it now.
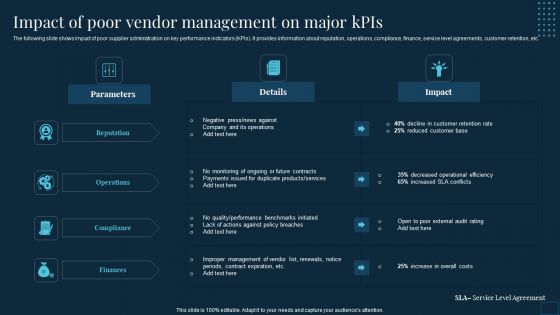
Vendor Management To Handle Purchase Impact Of Poor Vendor Management On Major Kpis Mockup PDF
The following slide shows impact of poor supplier administration on key performance indicators KPIs. It provides information about reputation, operations, compliance, finance, service level agreements, customer retention, etc. Deliver an awe inspiring pitch with this creative Vendor Management To Handle Purchase Impact Of Poor Vendor Management On Major Kpis Mockup PDF bundle. Topics like Decreased Operational, Improper Management, Poor External can be discussed with this completely editable template. It is available for immediate download depending on the needs and requirements of the user.

Implementing Cyber Security Incident Cyber Security Incident Response KPI Dashboard Clipart PDF
This slide represents dashboard showing the key metrics of cyber security incident response. It includes key performance indicators such as risk score, compliance status, threat level etc. There are so many reasons you need a Implementing Cyber Security Incident Cyber Security Incident Response KPI Dashboard Clipart PDF. The first reason is you cannot spend time making everything from scratch, Thus, Slidegeeks has made presentation templates for you too. You can easily download these templates from our website easily.
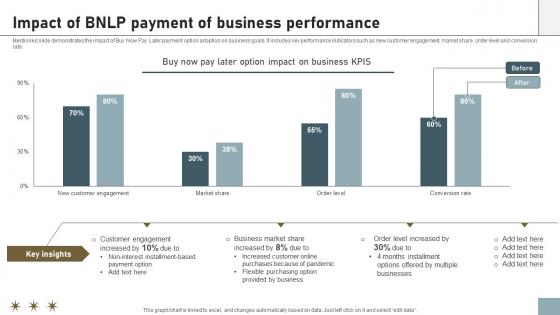
Online Payment Techniques Impact Of BNLP Payment Of Business Performance
Mentioned slide demonstrates the impact of Buy Now Pay Later payment option adoption on business goals. It includes key performance indicators such as new customer engagement, market share, order level and conversion rate. There are so many reasons you need a Online Payment Techniques Impact Of BNLP Payment Of Business Performance. The first reason is you can not spend time making everything from scratch, Thus, Slidegeeks has made presentation templates for you too. You can easily download these templates from our website easily.

Key Performance Indicators Ppt Gallery Files PDF
The slide shows the key Performance Indicator KPIs which will help the company to track the success rate of implemented strategies. Major KPIs include number of smartphone sold and manufactured, number of users worldwide, total upgrades, customer satisfaction level etc. Deliver an awe inspiring pitch with this creative key performance indicators ppt gallery files pdf bundle. Topics like key performance indicators can be discussed with this completely editable template. It is available for immediate download depending on the needs and requirements of the user.
Key Performance Indicators Construction Company Icons PDF
The slide shows the key Performance Indicator KPI s which will help the company to track the success rate of implemented strategies. Major KPIs include Number of construction projects, Number of construction defect, Total project cost, customer satisfaction level etc. Deliver and pitch your topic in the best possible manner with this key performance indicators construction company icons pdf. Use them to share invaluable insights on key performance indicators construction company and impress your audience. This template can be altered and modified as per your expectations. So, grab it now.
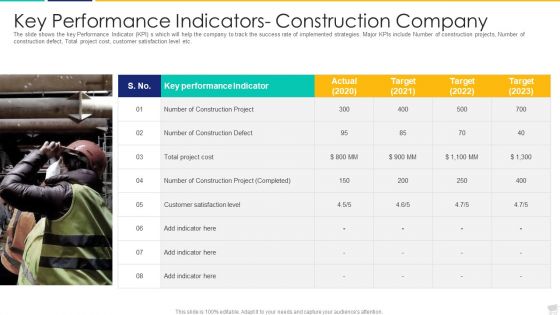
Key Performance Indicators- Construction Company Formats PDF
The slide shows the key Performance Indicator KPI s which will help the company to track the success rate of implemented strategies. Major KPIs include Number of construction projects, Number of construction defect, Total project cost, customer satisfaction level etc.Deliver an awe inspiring pitch with this creative key performance indicators construction company formats pdf bundle. Topics like construction project, customer satisfaction, performance indicator can be discussed with this completely editable template. It is available for immediate download depending on the needs and requirements of the user.
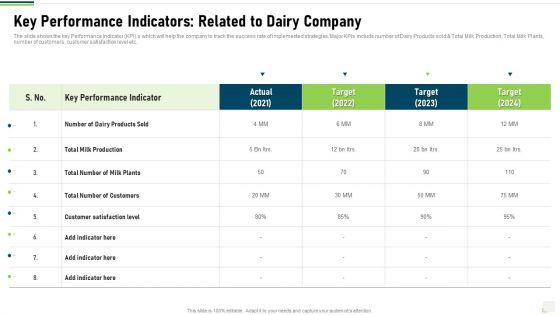
Key Performance Indicators Related To Dairy Company Infographics PDF
The slide shows the key Performance Indicator KPI s which will help the company to track the success rate of implemented strategies. Major KPIs include number of Dairy Products sold and Total Milk Production, Total Milk Plants, number of customers, customer satisfaction level etc. Deliver and pitch your topic in the best possible manner with this key performance indicators related to dairy company infographics pdf. Use them to share invaluable insights on key performance indicators related to dairy company and impress your audience. This template can be altered and modified as per your expectations. So, grab it now.
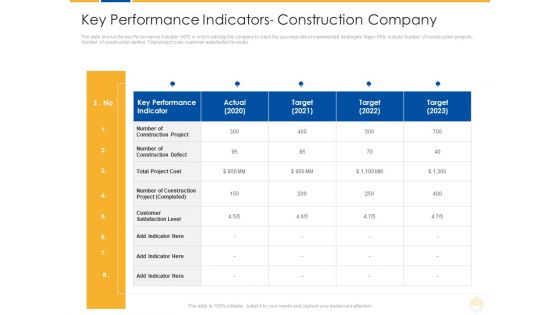
Key Performance Indicators Construction Company Ppt Model Background Designs PDF
The slide shows the key Performance Indicator KPI s which will help the company to track the success rate of implemented strategies. Major KPIs include Number of construction projects, Number of construction defect, Total project cost, customer satisfaction level etc. Deliver and pitch your topic in the best possible manner with this key performance indicators construction company ppt model background designs pdf. Use them to share invaluable insights on project cost, performance, target and impress your audience. This template can be altered and modified as per your expectations. So, grab it now.
Key Performance Indicators Related To Upsell Ppt Icon Rules PDF
The slide shows the key Performance Indicator KPI s which will help the company to track the success rate of implemented strategies. Major KPIs include number of products sold and manufactured, utilization rate, number of visitors, customer satisfaction level etc. Deliver and pitch your topic in the best possible manner with this key performance indicators related to upsell ppt icon rules pdf. Use them to share invaluable insights on customer satisfaction, products, target and impress your audience. This template can be altered and modified as per your expectations. So, grab it now.
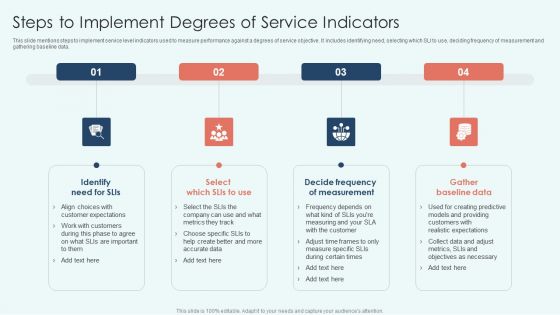
Steps To Implement Degrees Of Service Indicators Clipart PDF
This slide mentions steps to implement service level indicators used to measure performance against a degrees of service objective. It includes identifying need, selecting which SLI to use, deciding frequency of measurement and gathering baseline data.Persuade your audience using this Steps To Implement Degrees Of Service Indicators Clipart PDF. This PPT design covers three stages, thus making it a great tool to use. It also caters to a variety of topics including Decide Frequency, Gather Baseline, Objectives Necessary. Download this PPT design now to present a convincing pitch that not only emphasizes the topic but also showcases your presentation skills.

Statistics Indicating Impact Of Coaching On Company Performance Formats PDF
This slide delineates statistics indicating impact of coaching on company performance which can be referred by mentors who can assess this data to benchmark their training modules and post coaching effectiveness. It includes information about productivity, quality, business strength, consumer service, less consumer grievances, top level management retention and cost reductions. Pitch your topic with ease and precision using this Statistics Indicating Impact Of Coaching On Company Performance Formats PDF. This layout presents information on Productivity, Quality, Business Strength. It is also available for immediate download and adjustment. So, changes can be made in the color, design, graphics or any other component to create a unique layout.
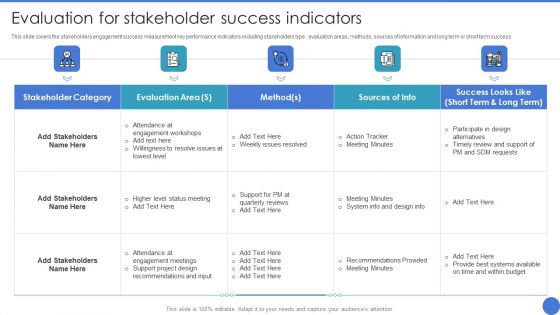
Managing Stakeholder Relationship Evaluation For Stakeholder Success Indicators Template PDF
This slide covers the stakeholders engagement success measurement key performance indicators including stakeholders type , evaluation areas, methods, sources of information and long term or short term success . Take your projects to the next level with our ultimate collection of Managing Stakeholder Relationship Evaluation For Stakeholder Success Indicators Template PDF. Slidegeeks has designed a range of layouts that are perfect for representing task or activity duration, keeping track of all your deadlines at a glance. Tailor these designs to your exact needs and give them a truly corporate look with your own brand colors theyll make your projects stand out from the rest.
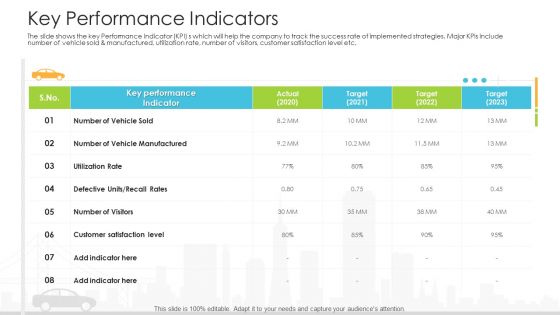
Vehicle Sales Plunge In An Automobile Firm Key Performance Indicators Elements PDF
The slide shows the key Performance Indicator KPI s which will help the company to track the success rate of implemented strategies. Major KPIs include number of vehicle sold and manufactured, utilization rate, number of visitors, customer satisfaction level etc. Deliver an awe inspiring pitch with this creative vehicle sales plunge in an automobile firm key performance indicators elements pdf bundle. Topics like key performance indicators can be discussed with this completely editable template. It is available for immediate download depending on the needs and requirements of the user.
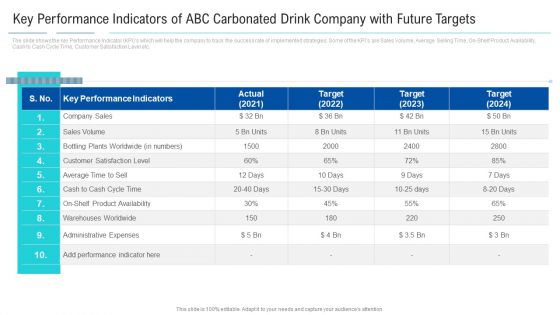
Key Performance Indicators Of ABC Carbonated Drink Company With Future Targets Introduction PDF
The slide shows the key Performance Indicator KPIs which will help the company to track the success rate of implemented strategies. Some of the KPIs are Sales Volume, Average Selling Time, On-Shelf Product Availability, Cash to Cash Cycle Time, Customer Satisfaction Level etc. Deliver an awe-inspiring pitch with this creative key performance indicators of abc carbonated drink company with future targets introduction pdf. bundle. Topics like key performance indicators, sales volume, average, warehouses worldwide, administrative expenses can be discussed with this completely editable template. It is available for immediate download depending on the needs and requirements of the user.
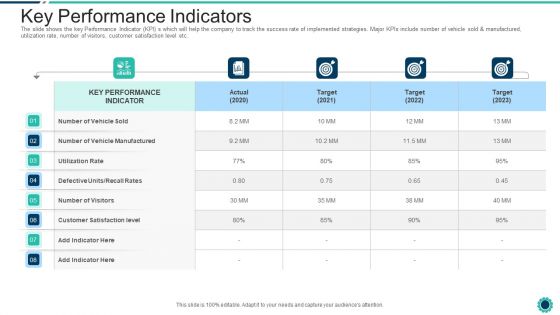
Declining Of A Motor Vehicle Company Key Performance Indicators Structure PDF
The slide shows the key Performance Indicator KPI s which will help the company to track the success rate of implemented strategies. Major KPIs include number of vehicle sold and manufactured, utilization rate, number of visitors, customer satisfaction level etc. Deliver and pitch your topic in the best possible manner with this declining of a motor vehicle company key performance indicators structure pdf. Use them to share invaluable insights on manufactured, target, utilization rate, performance indicator and impress your audience. This template can be altered and modified as per your expectations. So, grab it now.
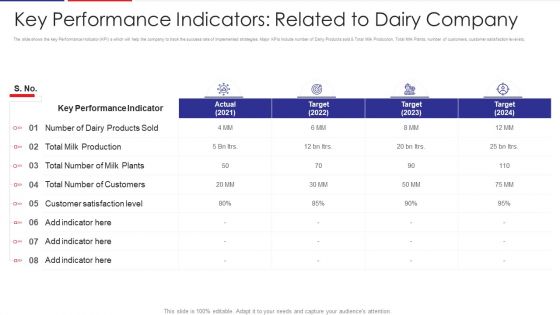
Examination Of Buyer Mindset Towards Dairy Products Key Performance Indicators Related Brochure PDF
The slide shows the key Performance Indicator KPIs which will help the company to track the success rate of implemented strategies. Major KPIs include number of Dairy Products sold and Total Milk Production, Total Milk Plants, number of customers, customer satisfaction level etc. Deliver and pitch your topic in the best possible manner with this examination of buyer mindset towards dairy products key performance indicators related brochure pdf. Use them to share invaluable insights on key performance indicators related to dairy company and impress your audience. This template can be altered and modified as per your expectations. So, grab it now.
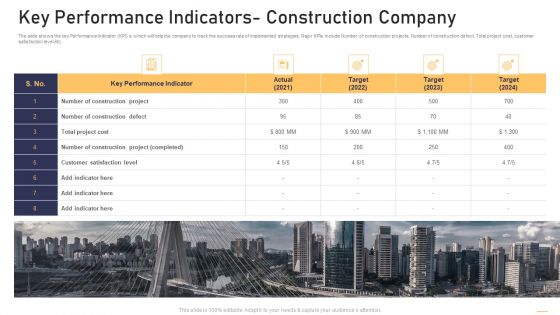
Surge In Construction Faults Lawsuits Case Competition Key Performance Indicators Construction Company Formats PDF
The slide shows the key Performance Indicator KPI s which will help the company to track the success rate of implemented strategies. Major KPIs include Number of construction projects, Number of construction defect, Total project cost, customer satisfaction level etc. Presenting surge in construction faults lawsuits case competition key performance indicators construction company formats pdf to provide visual cues and insights. Share and navigate important information on five stages that need your due attention. This template can be used to pitch topics like performance indicator, project cost, target, construction project. In addtion, this PPT design contains high resolution images, graphics, etc, that are easily editable and available for immediate download.

Upselling Technique Additional Product Key Performance Indicators Related To Upsell Themes PDF
The slide shows the key Performance Indicator KPI s which will help the company to track the success rate of implemented strategies. Major KPIs include number of products sold and manufactured, utilization rate, number of visitors, customer satisfaction level etc. Deliver and pitch your topic in the best possible manner with this upselling technique additional product key performance indicators related to upsell themes pdf. Use them to share invaluable insights on key performance indicators related to upsell and impress your audience. This template can be altered and modified as per your expectations. So, grab it now.

Factor Influencing User Experience Dairy Industry Key Performance Indicators Rules PDF
The slide shows the key Performance Indicator KPI s which will help the company to track the success rate of implemented strategies. Major KPIs include number of Dairy Products sold and Total Milk Production, Total Milk Plants, number of customers, customer satisfaction level etc. Deliver an awe inspiring pitch with this creative factor influencing user experience dairy industry key performance indicators rules pdf bundle. Topics like key performance indicators related to dairy company can be discussed with this completely editable template. It is available for immediate download depending on the needs and requirements of the user.

Enhancing Consumers Perception Towards Key Performance Indicators Related To Dairy Company Background PDF
The slide shows the key Performance Indicator KPI s which will help the company to track the success rate of implemented strategies. Major KPIs include number of Dairy Products sold and Total Milk Production, Total Milk Plants, number of customers, customer satisfaction level etc. Deliver and pitch your topic in the best possible manner with this enhancing consumers perception towards key performance indicators related to dairy company background pdf. Use them to share invaluable insights on key performance indicators related to dairy company and impress your audience. This template can be altered and modified as per your expectations. So, grab it now.
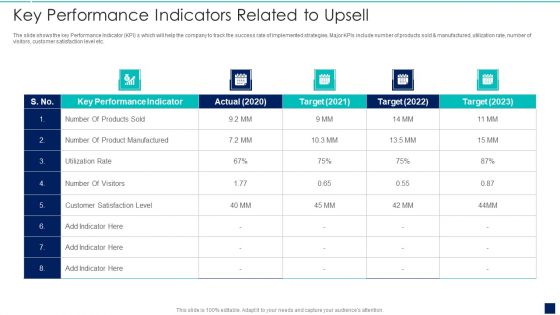
Influence Buyers To Purchase Additional High Key Performance Indicators Related To Upsell Summary PDF
The slide shows the key Performance Indicator KPIs which will help the company to track the success rate of implemented strategies. Major KPIs include number of products sold and manufactured, utilization rate, number of visitors, customer satisfaction level etc.Deliver an awe inspiring pitch with this creative Influence Buyers To Purchase Additional High Key Performance Indicators Related To Upsell Summary PDF bundle. Topics like Key Performance Indicators Related To Upsell can be discussed with this completely editable template. It is available for immediate download depending on the needs and requirements of the user.
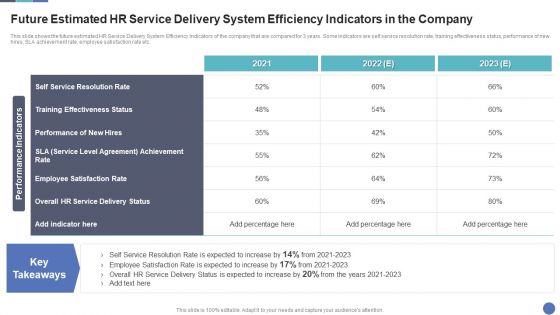
Future Estimated HR Service Delivery System Efficiency Indicators In The Company Professional PDF
This slide shows the future estimated HR Service Delivery System Efficiency Indicators of the company that are compared for 3 years. Some indicators are self service resolution rate, training effectiveness status, performance of new hires, SLA achievement rate, employee satisfaction rate etc. Deliver and pitch your topic in the best possible manner with this Future Estimated HR Service Delivery System Efficiency Indicators In The Company Professional PDF. Use them to share invaluable insights on Training Effectiveness, Level Agreement, Employee Satisfaction and impress your audience. This template can be altered and modified as per your expectations. So, grab it now.
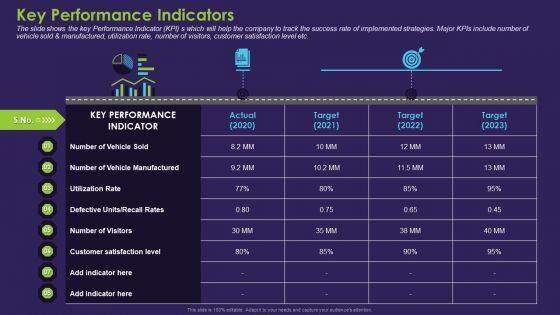
Business Case Contest Car Company Sales Deficit Key Performance Indicators Formats PDF
The slide shows the key Performance Indicator KPIs which will help the company to track the success rate of implemented strategies. Major KPIs include number of vehicle sold and manufactured, utilization rate, number of visitors, customer satisfaction level etc.Deliver an awe-inspiring pitch with this creative business case contest car company sales deficit key performance indicators formats pdf. bundle. Topics like number of vehicle sold, defective units recall rates, 2020 to 2023 can be discussed with this completely editable template. It is available for immediate download depending on the needs and requirements of the user.
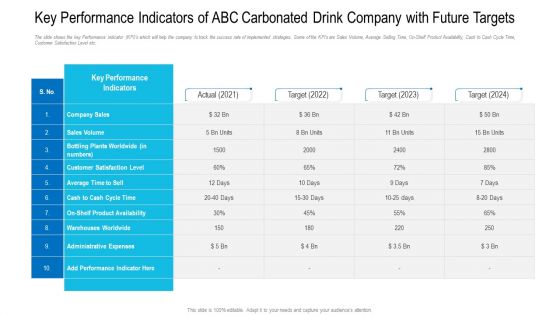
Key Performance Indicators Of ABC Carbonated Drink Company With Future Targets Infographics PDF
The slide shows the key Performance Indicator KPI s which will help the company to track the success rate of implemented strategies. Some of the KPIs are Sales Volume, Average Selling Time, On-Shelf Product Availability, Cash to Cash Cycle Time, Customer Satisfaction Level etc. Deliver and pitch your topic in the best possible manner with this key performance indicators of abc carbonated drink company with future targets infographics pdf. Use them to share invaluable insights on company sales, sales volume, average time to sell, cash to cash cycle time and impress your audience. This template can be altered and modified as per your expectations. So, grab it now.
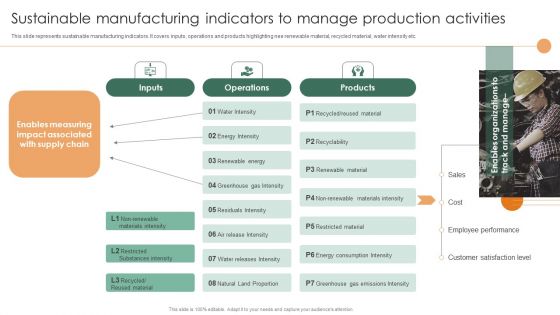
Smart Manufacturing Deployment Improve Production Procedures Sustainable Manufacturing Indicators Designs PDF
This slide represents sustainable manufacturing indicators. It covers inputs, operations and products highlighting nee renewable material, recycled material, water intensity etc.Take your projects to the next level with our ultimate collection of Smart Manufacturing Deployment Improve Production Procedures Sustainable Manufacturing Indicators Designs PDF. Slidegeeks has designed a range of layouts that are perfect for representing task or activity duration, keeping track of all your deadlines at a glance. Tailor these designs to your exact needs and give them a truly corporate look with your own brand colors they all make your projects stand out from the rest.
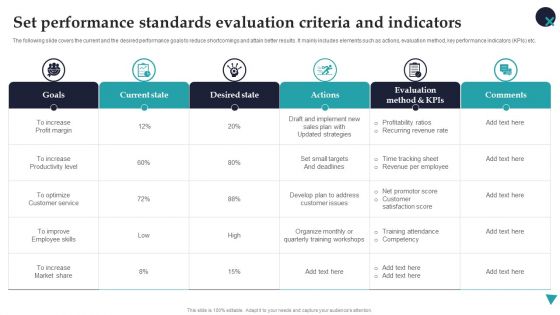
Set Performance Standards Evaluation Criteria And Indicators Employee Performance Management Designs PDF
The following slide covers the current and the desired performance goals to reduce shortcomings and attain better results. It mainly includes elements such as actions, evaluation method, key performance indicators KPIs etc. Take your projects to the next level with our ultimate collection of Set Performance Standards Evaluation Criteria And Indicators Employee Performance Management Designs PDF. Slidegeeks has designed a range of layouts that are perfect for representing task or activity duration, keeping track of all your deadlines at a glance. Tailor these designs to your exact needs and give them a truly corporate look with your own brand colors they all make your projects stand out from the rest.

Toolkit For Measuring And Assessing Communication Tactics Activities Background PDF
This slide demonstrates toolkit to assess and gauge communication acuities implemented by organisations to achieve higher level of workforce performance management and engagement. This slide includes communication activities and strategies and evaluation and measurement tools. Pitch your topic with ease and precision using this Toolkit For Measuring And Assessing Communication Tactics Activities Background PDF. This layout presents information on Communication Activities, Evaluation Tools, Measurement Tools. It is also available for immediate download and adjustment. So, changes can be made in the color, design, graphics or any other component to create a unique layout.
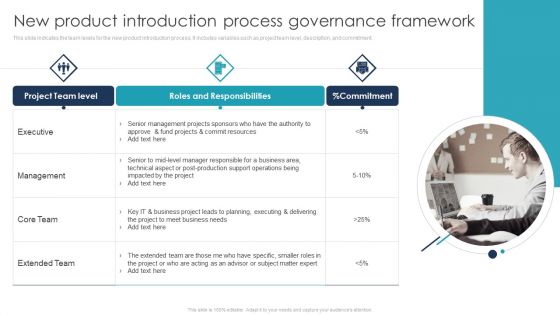
New Product Introduction Process Governance Framework Mockup PDF
This slide indicates the team levels for the new product introduction process. It includes variables such as project team level, description, and commitment. Presenting New Product Introduction Process Governance Framework Mockup PDF to dispense important information. This template comprises One stage. It also presents valuable insights into the topics including Project Team Level, Roles And Responsibilities, Extended Team. This is a completely customizable PowerPoint theme that can be put to use immediately. So, download it and address the topic impactfully.
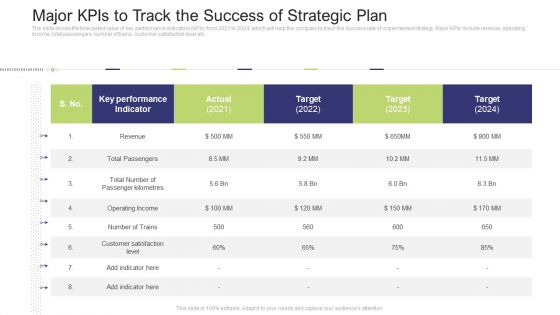
Major Kpis To Track The Success Of Strategic Plan Ideas PDF
The slide shows the forecasted value of key performance indicators KPIs from 2021 to 2024, which will help the company to track the success rate of implemented strategy. Major KPIs include revenue, operating income, total passengers, number of trains, customer satisfaction level etc.Deliver and pitch your topic in the best possible manner with this major kpis to track the success of strategic plan ideas pdf. Use them to share invaluable insights on key performance indicator, actual 2021 and impress your audience. This template can be altered and modified as per your expectations. So, grab it now.
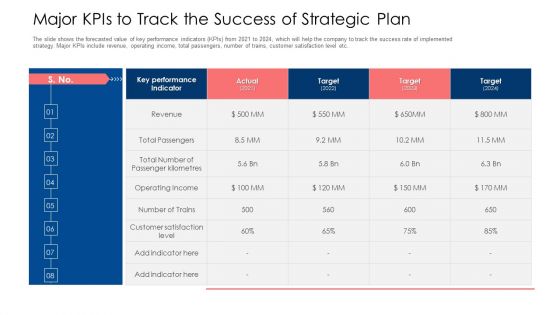
Major Kpis To Track The Success Of Strategic Plan Ppt Summary Influencers PDF
The slide shows the forecasted value of key performance indicators KPIs from 2021 to 2024, which will help the company to track the success rate of implemented strategy. Major KPIs include revenue, operating income, total passengers, number of trains, customer satisfaction level etc. Deliver an awe inspiring pitch with this creative major kpis to track the success of strategic plan ppt summary influencers pdf bundle. Topics like revenue, key performance indicator, target can be discussed with this completely editable template. It is available for immediate download depending on the needs and requirements of the user.
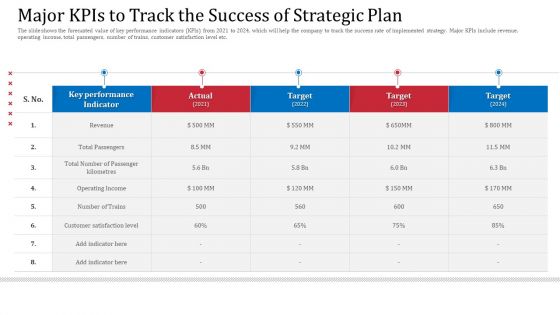
Major Kpis To Track The Success Of Strategic Plan Designs PDF
The slide shows the forecasted value of key performance indicators KPIs from 2021 to 2024, which will help the company to track the success rate of implemented strategy. Major KPIs include revenue, operating income, total passengers, number of trains, customer satisfaction level etc.Deliver an awe inspiring pitch with this creative major kpis to track the success of strategic plan designs pdf bundle. Topics like total passengers, operating income, performance indicator can be discussed with this completely editable template. It is available for immediate download depending on the needs and requirements of the user.
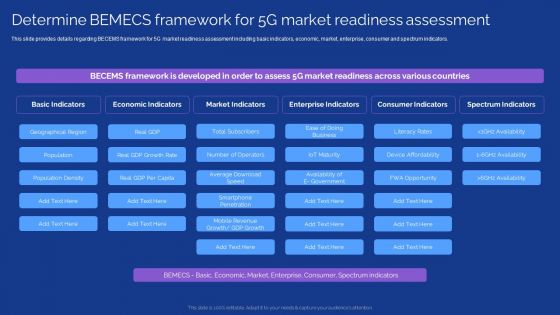
Development Guide For 5G World Determine Bemecs Framework For 5G Market Readiness Assessment Diagrams PDF
This slide provides details regarding BECEMS framework for 5G market readiness assessment including basic indicators, economic, market, enterprise, consumer and spectrum indicators. Take your projects to the next level with our ultimate collection of Development Guide For 5G World Determine Bemecs Framework For 5G Market Readiness Assessment Diagrams PDF. Slidegeeks has designed a range of layouts that are perfect for representing task or activity duration, keeping track of all your deadlines at a glance. Tailor these designs to your exact needs and give them a truly corporate look with your own brand colors they will make your projects stand out from the rest.

Ppt Correlated Arrows In Horizontal Create PowerPoint Macro 7 State Diagram Templates
PPT correlated arrows in horizontal create powerpoint macro 7 state diagram Templates-This Diagram is used to illustrate how information will move between interrelated systems in the accomplishment of a given function, task or process. The visual description of this information flow with each given level showing how data is fed into a given process step and subsequently passed along at the completion of that step.-PPT correlated arrows in horizontal create powerpoint macro 7 state diagram Templates-Aim, Arrow, Badge, Border, Color, Connection, Curve, Design, Direction, Download, Icon, Illustration, Indicator, Internet, Label, Link, Magenta, Mark, Next, Object, Orientation, Paper, Peeling, Pointer, Rounded, Set, Shadow, Shape, Sign

Ppt Correlated Arrows PowerPoint Templates Even Line 7 Stages
PPT correlated arrows powerpoint templates even line 7 stages-This Diagram is used to illustrate how information will move between interrelated systems in the accomplishment of a given function, task or process. The visual description of this information flow with each given level showing how data is fed into a given process step and subsequently passed along at the completion of that step.-PPT correlated arrows powerpoint templates even line 7 stages-Aim, Arrow, Badge, Border, Color, Connection, Curve, Design, Direction, Download, Icon, Illustration, Indicator, Internet, Label, Link, Magenta, Mark, Next, Object, Orientation, Paper, Peeling, Pointer, Rounded, Set, Shadow, Shape, Sign
Ppt Correlated Circular Arrows PowerPoint 2010 Horizontal Line 7 Stages Templates
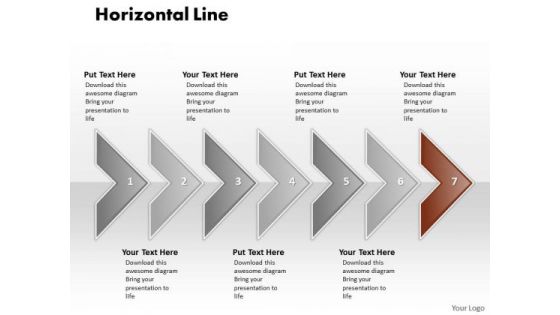
PPT correlated circular arrows powerpoint 2010 horizontal line 7 stages Templates-This Diagram is used to illustrate how information will move between interrelated systems in the accomplishment of a given function, task or process. The visual description of this information flow with each given level showing how data is fed into a given process step and subsequently passed along at the completion of that step.-PPT correlated circular arrows powerpoint 2010 horizontal line 7 stages Templates-Aim, Arrow, Badge, Border, Color, Connection, Curve, Design, Direction, Download, Icon, Illustration, Indicator, Internet, Label, Link, Magenta, Mark, Next, Object, Orientation, Paper, Peeling, Pointer, Rounded, Set, Shadow, Shape, Sign
Ppt Correlated Curved Arrows PowerPoint 2010 Regular Line 7 Stages Templates
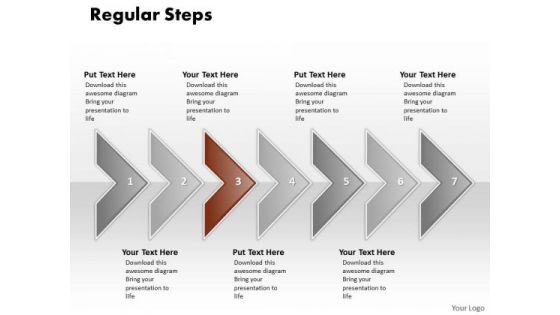
PPT correlated curved arrows powerpoint 2010 regular line 7 stages Templates-This Diagram is used to illustrate how information will move between interrelated systems in the accomplishment of a given function, task or process. The visual description of this information flow with each given level showing how data is fed into a given process step and subsequently passed along at the completion of that step.-PPT correlated curved arrows powerpoint 2010 regular line 7 stages Templates-Aim, Arrow, Badge, Border, Color, Connection, Curve, Design, Direction, Download, Icon, Illustration, Indicator, Internet, Label, Link, Magenta, Mark, Next, Object, Orientation, Paper, Peeling, Pointer, Rounded, Set, Shadow, Shape, Sign

 Home
Home