Kpis
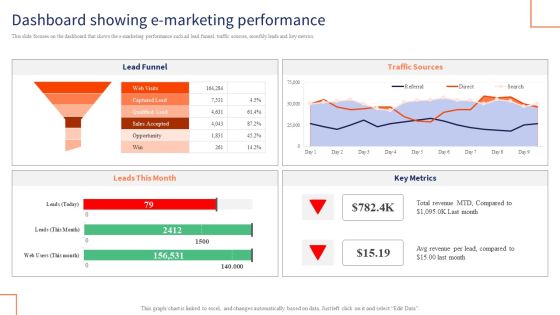
Optimizing Digital Channels To Enhance Marketing Strategy Dashboard Showing E Marketing Performance Brochure PDF
This slide focuses on the dashboard that shows the e marketing performance such ad lead funnel, traffic sources, monthly leads and key metrics. Do you know about Slidesgeeks Optimizing Digital Channels To Enhance Marketing Strategy Dashboard Showing E Marketing Performance Brochure PDF These are perfect for delivering any kind od presentation. Using it, create PowerPoint presentations that communicate your ideas and engage audiences. Save time and effort by using our pre designed presentation templates that are perfect for a wide range of topic. Our vast selection of designs covers a range of styles, from creative to business, and are all highly customizable and easy to edit. Download as a PowerPoint template or use them as Google Slides themes.

Performance KPI Dashboard To Analyze Healthcare Marketing Strategies Performance Guidelines PDF
The following slide showcases a comprehensive dashboard which can be used to evaluate the effectiveness of marketing strategies. The key metrics are total searches, brand mentions, customer value, total spending on advertisement etc. Do you know about Slidesgeeks Performance KPI Dashboard To Analyze Healthcare Marketing Strategies Performance Guidelines PDF. These are perfect for delivering any kind od presentation. Using it, create PowerPoint presentations that communicate your ideas and engage audiences. Save time and effort by using our pre designed presentation templates that are perfect for a wide range of topic. Our vast selection of designs covers a range of styles, from creative to business, and are all highly customizable and easy to edit. Download as a PowerPoint template or use them as Google Slides themes.
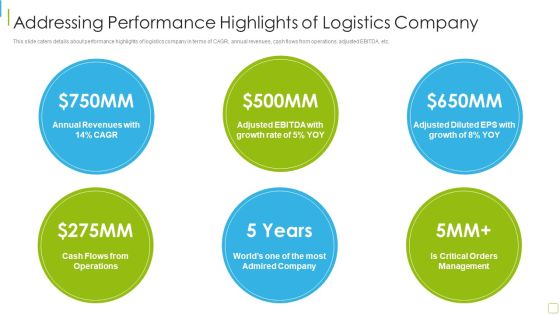
Performance Analysis Of New Product Development Addressing Performance Highlights Background PDF
This slide caters details about performance highlights of logistics company in terms of CAGR, annual revenues, cash flows from operations, adjusted EBITDA, etc. This is a performance analysis of new product development addressing performance highlights background pdf template with various stages. Focus and dispense information on six stages using this creative set, that comes with editable features. It contains large content boxes to add your information on topics like revenues, growth, management. You can also showcase facts, figures, and other relevant content using this PPT layout. Grab it now.
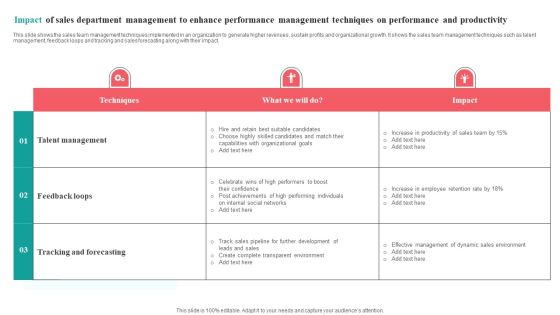
Impact Of Sales Department Management To Enhance Performance Management Techniques On Performance And Productivity Topics PDF
This slide shows the sales team management techniques implemented in an organization to generate higher revenues, sustain profits and organizational growth. It shows the sales team management techniques such as talent management, feedback loops and tracking and sales forecasting along with their impact.Pitch your topic with ease and precision using this Impact Of Sales Department Management To Enhance Performance Management Techniques On Performance And Productivity Topics PDF. This layout presents information on Capabilities Organizational, Performing Individuals, Candidates Match. It is also available for immediate download and adjustment. So, changes can be made in the color, design, graphics or any other component to create a unique layout.

BI Technique For Data Informed Decisions Sap Analytics Cloud Dashboard For Product Sales Analysis Sample PDF
This slide illustrates the SAP Analytics Cloud dashboard to monitor product sales performance. It provides information regarding the gross margin and net revenue earned, product performance state wise and year wise. Welcome to our selection of the Budget Plan For BI Technique For Data Informed Decisions Clipart PDF. These are designed to help you showcase your creativity and bring your sphere to life. Planning and Innovation are essential for any business that is just starting out. This collection contains the designs that you need for your everyday presentations. All of our PowerPoints are 100 percent editable, so you can customize them to suit your needs. This multi purpose template can be used in various situations. Grab these presentation templates today.

Four Companies With Web Services Powerpoint Slides
This PowerPoint template display graphics of four corporate buildings. You may use this PPT slide for financial and strategic analysis for web services companies. This dashboard slide may useful for multilevel status report creation and approval process.
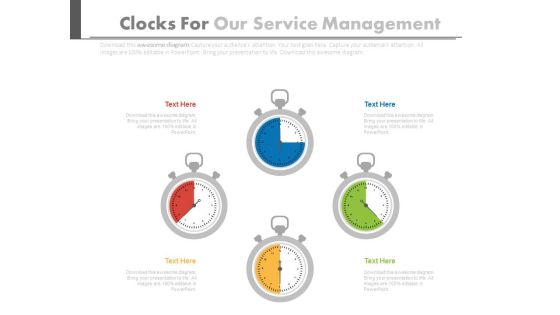
Four Stopwatches In Pie Chart Style Powerpoint Slides
This PPT slide has been designed with graphics of four stop watches in pie chart style. You may sue this PowerPoint template for time management. This dashboard slide may useful for multilevel status report creation and approval process.

Four Steps Circular Infographic Powerpoint Slides
This innovative, stunningly beautiful dashboard has been designed for data visualization. It contains circular infographic design. This PowerPoint template helps to display your information in a useful, simple and orderly way.

Stopwatch For Speed Calculation Powerpoint Slides
This innovative, stunningly beautiful dashboard has been designed for speed calculation. It contains graphics of stopwatch. This PowerPoint template helps to display your information in a useful, simple and orderly way.
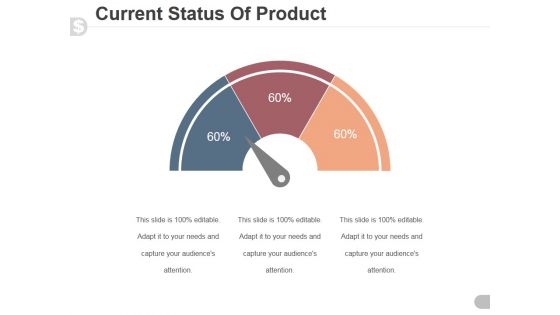
Current Status Of Product Ppt PowerPoint Presentation Designs Download
This is a current status of product ppt powerpoint presentation designs download. This is a three stage process. The stages in this process are speedometer, dashboard, business, marketing, finance.
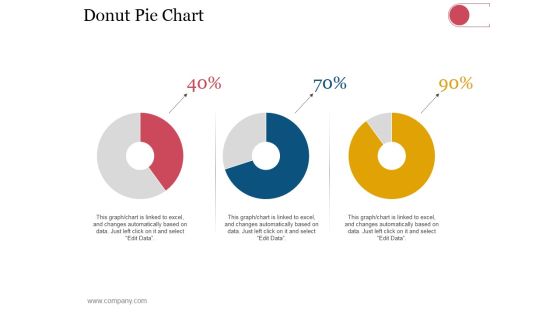
Donut Pie Chart Ppt PowerPoint Presentation Infographics Outfit
This is a donut pie chart ppt powerpoint presentation infographics outfit. This is a three stage process. The stages in this process are business, strategy, analysis, planning, dashboard, finance.

Web Analytics For Seo Marketing Ppt PowerPoint Presentation Examples
This is a web analytics for seo marketing ppt powerpoint presentation examples. This is a five stage process. The stages in this process are digital analytics, digital dashboard, marketing.

Web Analytics Traffic Sources And Conversion Rate Ppt PowerPoint Presentation Picture
This is a web analytics traffic sources and conversion rate ppt powerpoint presentation picture. This is a four stage process. The stages in this process are digital analytics, digital dashboard, marketing.

Most Common Hr Metrics Ppt PowerPoint Presentation Portfolio Gallery
This is a most common hr metrics ppt powerpoint presentation portfolio gallery. This is a six stage process. The stages in this process are turnover absence metrics, competencies training metrics, employee productivity metrics.

Application Patient Satisfaction Tactics Enhance Clinical Results Patient Satisfaction Measurement Structure PDF
Deliver and pitch your topic in the best possible manner with this application patient satisfaction tactics enhance clinical results patient satisfaction measurement structure pdf. Use them to share invaluable insights on patient satisfaction measurement dashboard and impress your audience. This template can be altered and modified as per your expectations. So, grab it now.

Cost And Income Optimization Price Optimization Dashboard Microsoft PDF
This slide covers the details of price optimization which focuses on price changes, leader, distribution, and benchmark. Deliver an awe inspiring pitch with this creative cost and income optimization price optimization dashboard microsoft pdf bundle. Topics like basic metric, additional metric, price appliance, portfolio under management, average shelf price can be discussed with this completely editable template. It is available for immediate download depending on the needs and requirements of the user.
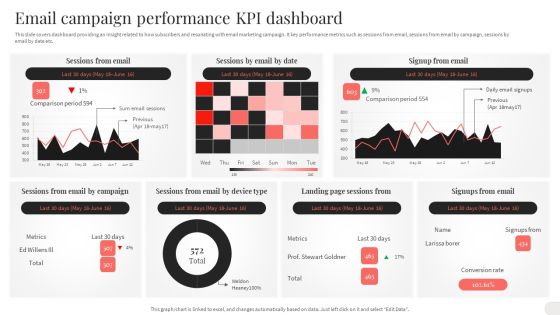
Analyzing And Implementing Effective CMS Email Campaign Performance KPI Dashboard Ideas PDF
This slide covers dashboard providing an insight related to how subscribers and resonating with email marketing campaign. It key performance metrics such as sessions from email, sessions from email by campaign, sessions by email by date etc. This Analyzing And Implementing Effective CMS Email Campaign Performance KPI Dashboard Ideas PDF from Slidegeeks makes it easy to present information on your topic with precision. It provides customization options, so you can make changes to the colors, design, graphics, or any other component to create a unique layout. It is also available for immediate download, so you can begin using it right away. Slidegeeks has done good research to ensure that you have everything you need to make your presentation stand out. Make a name out there for a brilliant performance.
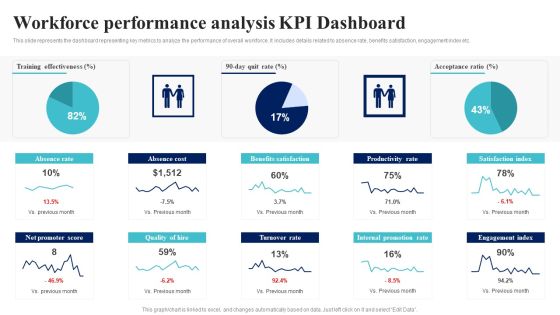
BI Implementation To Enhance Hiring Process Workforce Performance Analysis Kpi Dashboard Formats PDF
This slide represents the dashboard representing key metrics to analyze the performance of overall workforce. It includes details related to absence rate, benefits satisfaction, engagement index etc.Are you in need of a template that can accommodate all of your creative concepts This one is crafted professionally and can be altered to fit any style. Use it with Google Slides or PowerPoint. Include striking photographs, symbols, depictions, and other visuals. Fill, move around, or remove text boxes as desired. Test out color palettes and font mixtures. Edit and save your work, or work with colleagues. Download BI Implementation To Enhance Hiring Process Workforce Performance Analysis Kpi Dashboard Formats PDF and observe how to make your presentation outstanding. Give an impeccable presentation to your group and make your presentation unforgettable.

Analyzing And Deploying Effective CMS Email Campaign Performance KPI Dashboard Guidelines PDF
This slide covers dashboard providing an insight related to how subscribers and resonating with email marketing campaign. It key performance metrics such as sessions from email, sessions from email by campaign, sessions by email by date etc. This Analyzing And Deploying Effective CMS Email Campaign Performance KPI Dashboard Guidelines PDF from Slidegeeks makes it easy to present information on your topic with precision. It provides customization options, so you can make changes to the colors, design, graphics, or any other component to create a unique layout. It is also available for immediate download, so you can begin using it right away. Slidegeeks has done good research to ensure that you have everything you need to make your presentation stand out. Make a name out there for a brilliant performance.

Email Campaign Performance Kpi Dashboard Deploying Ecommerce Order Management Software Professional PDF
This slide covers dashboard providing an insight related to how subscribers and resonating with email marketing campaign. It key performance metrics such as sessions from email, sessions from email by campaign, sessions by email by date etc.Are you in need of a template that can accommodate all of your creative concepts This one is crafted professionally and can be altered to fit any style. Use it with Google Slides or PowerPoint. Include striking photographs, symbols, depictions, and other visuals. Fill, move around, or remove text boxes as desired. Test out color palettes and font mixtures. Edit and save your work, or work with colleagues. Download Email Campaign Performance Kpi Dashboard Deploying Ecommerce Order Management Software Professional PDF and observe how to make your presentation outstanding. Give an impeccable presentation to your group and make your presentation unforgettable.
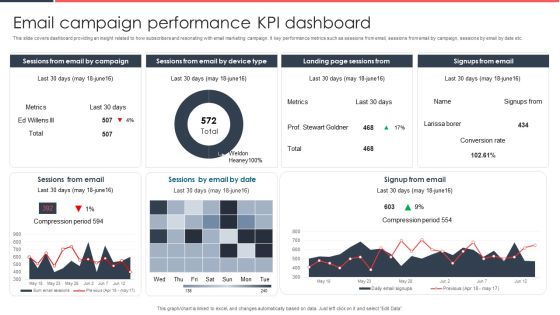
Implementing Management System To Enhance Ecommerce Processes Email Campaign Performance KPI Dashboard Download PDF
This slide covers dashboard providing an insight related to how subscribers and resonating with email marketing campaign. It key performance metrics such as sessions from email, sessions from email by campaign, sessions by email by date etc. This Implementing Management System To Enhance Ecommerce Processes Email Campaign Performance KPI Dashboard Download PDF from Slidegeeks makes it easy to present information on your topic with precision. It provides customization options, so you can make changes to the colors, design, graphics, or any other component to create a unique layout. It is also available for immediate download, so you can begin using it right away. Slidegeeks has done good research to ensure that you have everything you need to make your presentation stand out. Make a name out there for a brilliant performance.

Guide To Healthcare Services Administration Performance KPI Dashboard To Analyze Healthcare Marketing Clipart PDF
The following slide showcases a comprehensive dashboard which can be used to evaluate the effectiveness of marketing strategies. The key metrics are total searches, brand mentions, customer value, total spending on advertisement etc. Slidegeeks is one of the best resources for PowerPoint templates. You can download easily and regulate Guide To Healthcare Services Administration Performance KPI Dashboard To Analyze Healthcare Marketing Clipart PDF for your personal presentations from our wonderful collection. A few clicks is all it takes to discover and get the most relevant and appropriate templates. Use our Templates to add a unique zing and appeal to your presentation and meetings. All the slides are easy to edit and you can use them even for advertisement purposes.

Transform Management Instruction Schedule Dashboard To Track And Analyse Change Mockup PDF
This slide represents the KPI dashboard to track and monitor the effectiveness of change management training program conducted by the organization. It includes key metrics such as active employees, no.of trainings, cost etc. Slidegeeks is one of the best resources for PowerPoint templates. You can download easily and regulate Transform Management Instruction Schedule Dashboard To Track And Analyse Change Mockup PDF for your personal presentations from our wonderful collection. A few clicks is all it takes to discover and get the most relevant and appropriate templates. Use our Templates to add a unique zing and appeal to your presentation and meetings. All the slides are easy to edit and you can use them even for advertisement purposes.

Hoshin Kanri Strategic Planning System Chart With Annual Goals Ppt PowerPoint Presentation Gallery Graphics Design PDF
This slide illustrates the timeline for executing annual strategic goals and actions to be measured with key performance indicators. Showcasing this set of slides titled hoshin kanri strategic planning system chart with annual goals ppt powerpoint presentation gallery graphics design pdf. The topics addressed in these templates are product design, product development, annual goals. All the content presented in this PPT design is completely editable. Download it and make adjustments in color, background, font etc. as per your unique business setting.

Customer Behavior Analytics Dashboard For Media Companies Ppt Ideas Visuals PDF
The following slide showcases analytics dashboard to assess consumer behavior. key performance indicators covered are streaming hours by device, average views and user sharing credentials. Showcasing this set of slides titled Customer Behavior Analytics Dashboard For Media Companies Ppt Ideas Visuals PDF. The topics addressed in these templates are Streaming Hours Device, Average Streaming Hours, Per User, Users Sharing Credentials. All the content presented in this PPT design is completely editable. Download it and make adjustments in color, background, font etc. as per your unique business setting.
Shipping And Logistics Tracking Dashboard With Shipments And Fleet Status Elements PDF
This slide covers Key performance indicators to track the automation system of the company. This dashboard includes Logistics Efficiency Status, delivery time accuracy etc. Take your projects to the next level with our ultimate collection of Shipping And Logistics Tracking Dashboard With Shipments And Fleet Status Elements PDF. Slidegeeks has designed a range of layouts that are perfect for representing task or activity duration, keeping track of all your deadlines at a glance. Tailor these designs to your exact needs and give them a truly corporate look with your own brand colors they ll make your projects stand out from the rest.
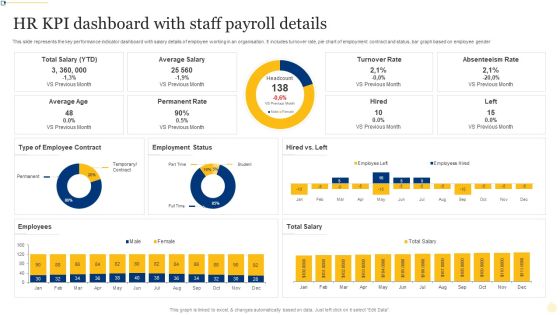
HR KPI Dashboard With Staff Payroll Details Ppt PowerPoint Presentation File Layout Ideas PDF
This slide represents the key performance indicator dashboard with salary details of employee working in an organisation. It includes turnover rate, pie chart of employment contract and status, bar graph based on employee gender. Showcasing this set of slides titled HR KPI Dashboard With Staff Payroll Details Ppt PowerPoint Presentation File Layout Ideas PDF. The topics addressed in these templates are Turnover Rate, Absenteeism Rate, Permanent Rate. All the content presented in this PPT design is completely editable. Download it and make adjustments in color, background, font etc. as per your unique business setting.
Robotic Process Automation Shipping And Logistics Tracking Dashboard With Shipments Clipart PDF
This slide covers Key performance indicators to track the automation system of the company. This dashboard includes Logistics Efficiency Status, delivery time accuracy etc. If your project calls for a presentation, then Slidegeeks is your go-to partner because we have professionally designed, easy-to-edit templates that are perfect for any presentation. After downloading, you can easily edit Robotic Process Automation Shipping And Logistics Tracking Dashboard With Shipments Clipart PDF and make the changes accordingly. You can rearrange slides or fill them with different images. Check out all the handy templates

KPI Dashboard To Monitor Real Time Issues In Logistics Chain Rules PDF
This slide presents a dashboard which can be used by suppliers to monitor any issues taking place in the supply chain and take timely steps for improvement. The key performing indicators are activities due, issue severity, issues unassigned, issues under inspection etc. Pitch your topic with ease and precision using this KPI Dashboard To Monitor Real Time Issues In Logistics Chain Rules PDF. This layout presents information on Activities Due, Issues By Severity, Issues Rejected, Inspection Status. It is also available for immediate download and adjustment. So, changes can be made in the color, design, graphics or any other component to create a unique layout.
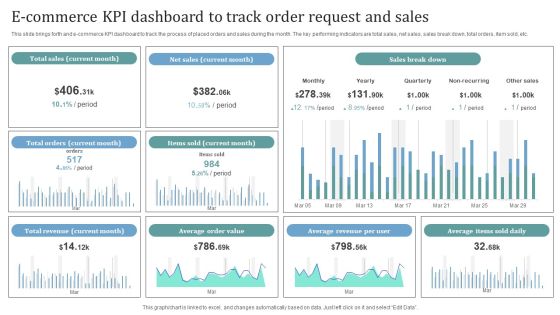
E Commerce KPI Dashboard To Track Order Request And Sales Introduction PDF
This slide brings forth and e commerce KPI dashboard to track the process of placed orders and sales during the month. The key performing indicators are total sales, net sales, sales break down, total orders, item sold, etc. Showcasing this set of slides titled E Commerce KPI Dashboard To Track Order Request And Sales Introduction PDF. The topics addressed in these templates are Total Sales, Net Sales, Sales Break Down. All the content presented in this PPT design is completely editable. Download it and make adjustments in color, background, font etc. as per your unique business setting.

KPI Dashboard To Track Borrowing System Management System Ppt Visual Aids Portfolio PDF
This slide depicts a dashboard which can be used by banks or financial institutions to track the status of loan activities and management systems. Key performing indicators include existing customers, ongoing loans, loan trends etc. Showcasing this set of slides titled KPI Dashboard To Track Borrowing System Management System Ppt Visual Aids Portfolio PDF. The topics addressed in these templates are Existing Customers, Ongoing Loans, Todays Payment Received. All the content presented in this PPT design is completely editable. Download it and make adjustments in color, background, font etc. as per your unique business setting.

Search Engine Marketing Website Traffic Analysis With KPI Dashboard Brochure PDF
The following slide depicts the website analysis dashboard to get better visibility over search engines. It mainly includes key performance indicators such as sessions, users, page views, sources of traffic, phone call to actions etc. Want to ace your presentation in front of a live audience Our Search Engine Marketing Website Traffic Analysis With KPI Dashboard Brochure PDF can help you do that by engaging all the users towards you.. Slidegeeks experts have put their efforts and expertise into creating these impeccable powerpoint presentations so that you can communicate your ideas clearly. Moreover, all the templates are customizable, and easy-to-edit and downloadable. Use these for both personal and commercial use.

Dashboard To Track Progress Post Implementing Drug Launch Strategy Slides PDF
Following dashboard provides a brief overview of progress post implementing drug launch strategy which can be used by medical representatives to monitor the effectiveness. The key performance indicators are units sold, target, revenue, units unsold etc. Showcasing this set of slides titled Dashboard To Track Progress Post Implementing Drug Launch Strategy Slides PDF. The topics addressed in these templates are Planning, Design, Development, Testing, Launch. All the content presented in this PPT design is completely editable. Download it and make adjustments in color, background, font etc. as per your unique business setting.

Kpi Dashboard For Monitoring Status Of Nonprofit Advertising Strategy Portrait PDF
This slide brings forth dashboard which assists project managers in tracking the status of marketing plans and activities for timely decision making. The key performance indicators are project title, tag, responsibility, date assigned, project team, progress, deadline and status Pitch your topic with ease and precision using this Kpi Dashboard For Monitoring Status Of Nonprofit Advertising Strategy Portrait PDF. This layout presents information on Tag, Responsibility, Date Assigned. It is also available for immediate download and adjustment. So, changes can be made in the color, design, graphics or any other component to create a unique layout.

Dashboard To Monitor International Footprint Of Supply Chain Operations Brochure PDF
This slide depicts a dashboard that will be used by managers to monitor the global footprint of supply chain operations. Major key performance indicators include total global emissions, time frame, allocation, electricity, etc. Showcasing this set of slides titled Dashboard To Monitor International Footprint Of Supply Chain Operations Brochure PDF. The topics addressed in these templates are Electricity, Footprint Emissions, Allocation. All the content presented in this PPT design is completely editable. Download it and make adjustments in color, background, font etc. as per your unique business setting.

Corporate Financial KPI Dashboard To Statement Cash Flow Of Company Diagrams PDF
This slide presents a financial dashboard of an enterprise which is being used to report the total spending power of a company. Key performing indicators include cash burn rate, monthly expenses, solvency etc. Showcasing this set of slides titled Corporate Financial KPI Dashboard To Statement Cash Flow Of Company Diagrams PDF. The topics addressed in these templates are Solvency, Debtors, Monthly Expenses. All the content presented in this PPT design is completely editable. Download it and make adjustments in color, background, font etc. as per your unique business setting.
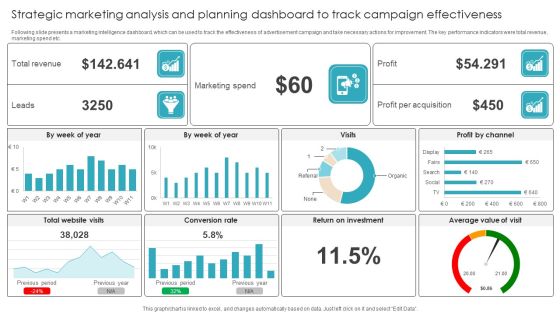
Strategic Marketing Analysis And Planning Dashboard To Track Campaign Effectiveness Summary PDF
Following slide presents a marketing intelligence dashboard, which can be used to track the effectiveness of advertisement campaign and take necessary actions for improvement. The key performance indicators were total revenue, marketing spend etc. Showcasing this set of slides titled Strategic Marketing Analysis And Planning Dashboard To Track Campaign Effectiveness Summary PDF. The topics addressed in these templates are Marketing Spend, Conversion Rate, Return Investment. All the content presented in this PPT design is completely editable. Download it and make adjustments in color, background, font etc. as per your unique business setting.
Illustrating Product Leadership Plan Incorporating Innovative Techniques Dashboard Depicting Sales Icons PDF
This slide focuses on dashboard that depicts sales product performance that includes top products in revenues, online verses offline purchases, incremental sales by campaign and cost of goods sold. Deliver an awe inspiring pitch with this creative illustrating product leadership plan incorporating innovative techniques dashboard depicting sales icons pdf bundle. Topics like incremental sales by campaign, top products in revenue, online vs offline purchases, cost of goods sold can be discussed with this completely editable template. It is available for immediate download depending on the needs and requirements of the user.

Dashboard Ppt PowerPoint Presentation Samples
This is a dashboard ppt powerpoint presentation samples. This is a three stage process. The stages in this process are medium, low, high.

Call Center Performance KPI Dashboard Formats PDF
This slide covers contact center performance metrics KPI dashboard. It involves details such as number of total calls, average answer speed, abandon rate, data of agents performance and call abandon rate by departments. Showcasing this set of slides titled Call Center Performance KPI Dashboard Formats PDF. The topics addressed in these templates are Department, Dashboard, Agreement Limits. All the content presented in this PPT design is completely editable. Download it and make adjustments in color, background, font etc. as per your unique business setting.

Four Stages Of Return Investment Model Engagement Ppt PowerPoint Presentation Inspiration Layout Ideas
Presenting this set of slides with name four stages of return investment model engagement ppt powerpoint presentation inspiration layout ideas. This is a four stage process. The stages in this process are dashboard, marketing, management, investment, analysis. This is a completely editable PowerPoint presentation and is available for immediate download. Download now and impress your audience.

Balance Scorecard Index Dashboard Ppt Slides
This is a balance scorecard index dashboard ppt slides. This is a one stage process. The stages in this process are sales by month, gross revenue, customer retention, executive scorecard, measures, status, trend, financial, option, customer, internal processes, learning and growth.

4 Key Project Management Responsibilities To Legal Services Rules PDF
This slide provides the glimpse about the legal market, regulatory and commercial factors which defines, plans, delivers and close the legal projects. This is a 4 key project management responsibilities to legal services rules pdf template with various stages. Focus and dispense information on four stages using this creative set, that comes with editable features. It contains large content boxes to add your information on topics like requirements, quality, metrics, pricing, resourcing. You can also showcase facts, figures, and other relevant content using this PPT layout. Grab it now.

4 Key Project Management Responsibilities To Legal Services Structure PDF
This slide provides the glimpse about the legal market, regulatory and commercial factors which defines, plans, delivers and close the legal projects. This is a 4 key project management responsibilities to legal services structure pdf template with various stages. Focus and dispense information on four stages using this creative set, that comes with editable features. It contains large content boxes to add your information on topics like requirements, financial, risk, management, metrics. You can also showcase facts, figures, and other relevant content using this PPT layout. Grab it now.

Key Characteristics To Drive Pipeline Management Themes PDF
This slide shows the major characteristics identify bottle necks, understand the reason behind the failure etc. that helps in driving pipeline management This is a Key Characteristics To Drive Pipeline Management Themes PDF template with various stages. Focus and dispense information on six stages using this creative set, that comes with editable features. It contains large content boxes to add your information on topics like Optimization, Management, Sales, Analyzing, Metrics. You can also showcase facts, figures, and other relevant content using this PPT layout. Grab it now.

Key Components Of Healthcare Risk Administration Plan Diagrams PDF
This slide outline fundamental components that must be incorporated into healthcare risk management plans to communicate the purpose behind the plan. It includes training and education, purpose goals and metrics, communication plan, reporting protocols, and response plan. Presenting Key Components Of Healthcare Risk Administration Plan Diagrams PDF to dispense important information. This template comprises five stages. It also presents valuable insights into the topics including Training And Education, Communication Plan, Reporting Protocols. This is a completely customizable PowerPoint theme that can be put to use immediately. So, download it and address the topic impactfully.

Productivity Services Diagram Sample Of Ppt Presentation
This is a productivity services diagram sample of ppt presentation. This is a four stage process. The stages in this process are performance measurement, supplier management, people and organization, process management.
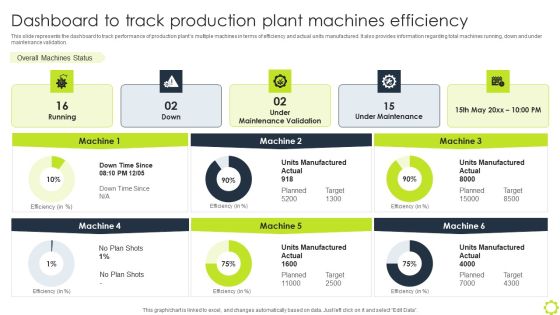
Machine Repairing And Servicing Dashboard To Track Production Plant Machines Formats PDF
This slide represents the dashboard to track performance of production plants multiple machines in terms of efficiency and actual units manufactured. It also provides information regarding total machines running, down and under maintenance validation. Want to ace your presentation in front of a live audience Our Machine Repairing And Servicing Dashboard To Track Production Plant Machines Formats PDF can help you do that by engaging all the users towards you. Slidegeeks experts have put their efforts and expertise into creating these impeccable powerpoint presentations so that you can communicate your ideas clearly. Moreover, all the templates are customizable, and easy-to-edit and downloadable. Use these for both personal and commercial use.

Positioning Metrics For Freelance Content Marketing Slides PDF
The following slide highlights the positioning metrics for freelance content marketing. It showcases search metrics, brand metrics, reputation metrics, follower growth, keyword value, pr metrics, reach and competitor metrics to monitor the positioning of content. Showcasing this set of slides titled Positioning Metrics For Freelance Content Marketing Slides PDF. The topics addressed in these templates are Keyword Growth, Pr Metrics, Brand Metrics. All the content presented in this PPT design is completely editable. Download it and make adjustments in color, background, font etc. as per your unique business setting.

Deploying Revitalization Strategy Enhance Product And Service Sales Product Repositioning KPI Monitoring Information PDF
This slide highlights the key performance indicator of product repositioning which includes product sales, product demand in the market, position in the market and social media channels growth rate. Whether you have daily or monthly meetings, a brilliant presentation is necessary. Deploying Revitalization Strategy Enhance Product And Service Sales Product Repositioning KPI Monitoring Information PDF can be your best option for delivering a presentation. Represent everything in detail using Deploying Revitalization Strategy Enhance Product And Service Sales Product Repositioning KPI Monitoring Information PDF and make yourself stand out in meetings. The template is versatile and follows a structure that will cater to your requirements. All the templates prepared by Slidegeeks are easy to download and edit. Our research experts have taken care of the corporate themes as well. So, give it a try and see the results.

Crm Dashboard Sales Dashboard Template Ppt PowerPoint Presentation Professional Layout
This is a crm dashboard sales dashboard template ppt powerpoint presentation professional layout. This is a four stage process. The stages in this process are lead owner breakdown, sales by product march 2017, total lead ownership, month over month closing trend.

Umbrella Branding Measures To Boost Brand Awareness Comparative Analysis Among Umbrella Individual Clipart PDF
This slide provides information regarding comparative analysis among umbrella and individual branding in terms of cost of promotion, product image, impact over product image, new product launch process, etc. From laying roadmaps to briefing everything in detail, our templates are perfect for you. You can set the stage with your presentation slides. All you have to do is download these easy to edit and customizable templates. Umbrella Branding Measures To Boost Brand Awareness Comparative Analysis Among Umbrella Individual Clipart PDF will help you deliver an outstanding performance that everyone would remember and praise you for. Do download this presentation today.

Business Intelligence Report Table Of Content Measurement Ppt Inspiration Graphics Tutorials PDF
Presenting this set of slides with name business intelligence report table of content measurement ppt inspiration graphics tutorials pdf. This is a one stage process. The stages in this process are touchpoint performance, dashboards. This is a completely editable PowerPoint presentation and is available for immediate download. Download now and impress your audience.

KPI Dashboards Per Industry FMCG Consumer Goods Dashboard Ppt PowerPoint Presentation Infographics Graphics Tutorials PDF
Deliver and pitch your topic in the best possible manner with this kpi dashboards per industry fmcg consumer goods dashboard ppt powerpoint presentation infographics graphics tutorials pdf. Use them to share invaluable insights on sales and margin trend, on shelf availability, overview, performance product category and impress your audience. This template can be altered and modified as per your expectations. So, grab it now.
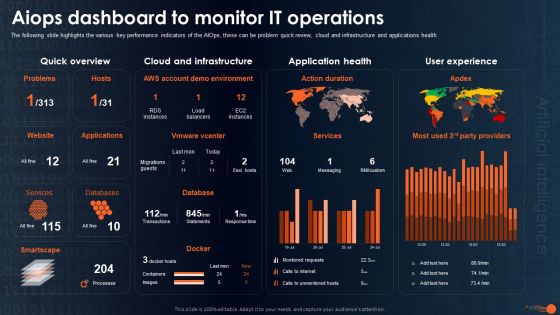
Integrating Aiops To Enhance Process Effectiveness Aiops Dashboard To Monitor Download PDF
The following slide highlights the various key performance indicators of the AIOps, these can be problem quick review, cloud and infrastructure and applications health Boost your pitch with our creative Integrating Aiops To Enhance Process Effectiveness Aiops Dashboard To Monitor Download PDF. Deliver an awe-inspiring pitch that will mesmerize everyone. Using these presentation templates you will surely catch everyones attention. You can browse the ppts collection on our website. We have researchers who are experts at creating the right content for the templates. So you dont have to invest time in any additional work. Just grab the template now and use them.
Project Tracking Issue Tracker Dashboard Rules PDF
The following slide highlights the project tracking issues in project management to determine and resolve them quickly. It includes metrics such as issue summary, priorities, responsible head, reporting and closing date etc. Showcasing this set of slides titled Project Tracking Issue Tracker Dashboard Rules PDF. The topics addressed in these templates are Inappropriate Supplies, Project, Tracker Dashboard. All the content presented in this PPT design is completely editable. Download it and make adjustments in color, background, font etc. as per your unique business setting.

Supplier Relationship Management Metrics Ppt PowerPoint Presentation Styles Designs
This is a supplier relationship management metrics ppt powerpoint presentation styles designs. This is a six stage process. The stages in this process are supplier relationship management metrics.
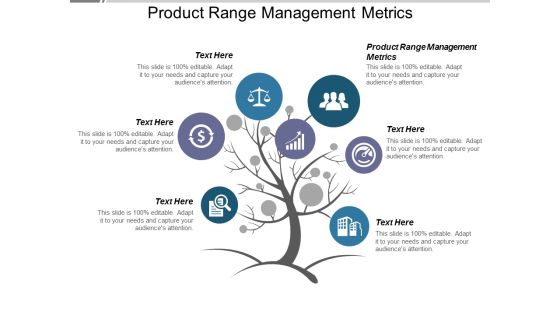
Product Range Management Metrics Ppt PowerPoint Presentation Deck
This is a product range management metrics ppt powerpoint presentation deck. This is a six stage process. The stages in this process are product range management metrics.
Marketing Metrics Track Ppt PowerPoint Presentation Slides Example File
This is a marketing metrics track ppt powerpoint presentation slides example file. This is a three stage process. The stages in this process are marketing metrics track.

Succession Planning Metrics Ppt Powerpoint Presentation Infographic Template Guide Cpb
This is a succession planning metrics ppt powerpoint presentation infographic template guide cpb. This is a four stage process. The stages in this process are succession planning metrics.
 Home
Home