AI PPT Maker
Templates
PPT Bundles
Design Services
Business PPTs
Business Plan
Management
Strategy
Introduction PPT
Roadmap
Self Introduction
Timelines
Process
Marketing
Agenda
Technology
Medical
Startup Business Plan
Cyber Security
Dashboards
SWOT
Proposals
Education
Pitch Deck
Digital Marketing
KPIs
Project Management
Product Management
Artificial Intelligence
Target Market
Communication
Supply Chain
Google Slides
Research Services
 One Pagers
All Categories
-
Home
- Customer Favorites
- Kpis
Kpis
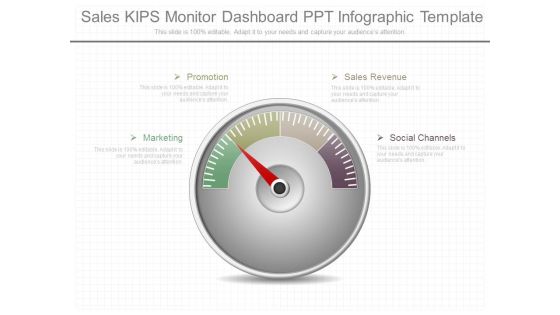
Sales Kips Monitor Dashboard Ppt Infographic Template
This is a sales kips monitor dashboard ppt infographic template. This is a four stage process. The stages in this process are promotion, marketing, sales revenue, social channels.
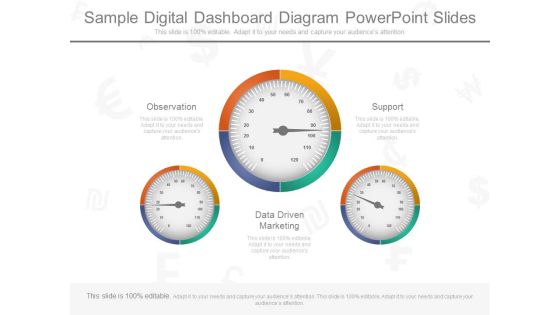
Sample Digital Dashboard Diagram Powerpoint Slides
This is a sample digital dashboard diagram powerpoint slides. This is a three stage process. The stages in this process are observation, support , data driven marketing.
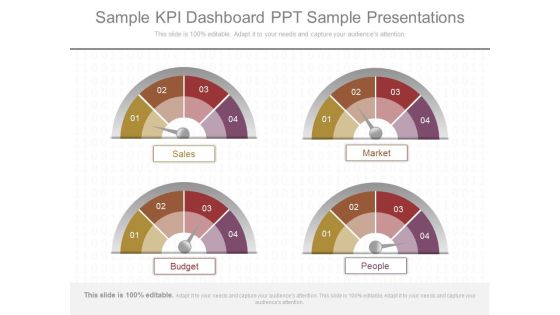
Sample Kpi Dashboard Ppt Sample Presentations
This is a sample kpi dashboard ppt sample presentations. This is a four stage process. The stages in this process are sales, market, budget, people.
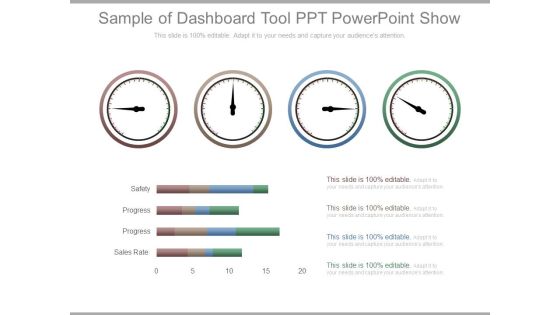
Sample Of Dashboard Tool Ppt Powerpoint Show
This is a sample of dashboard tool ppt powerpoint show. This is a four stage process. The stages in this process are safety, progress, sales rate.
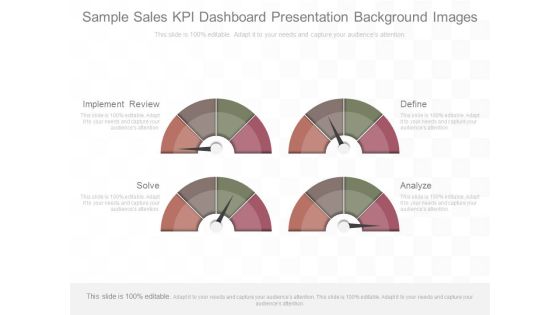
Sample Sales Kpi Dashboard Presentation Background Images
This is a sample sales kpi dashboard presentation background images. This is a four stage process. The stages in this process are implement review, define, solve, analyze.
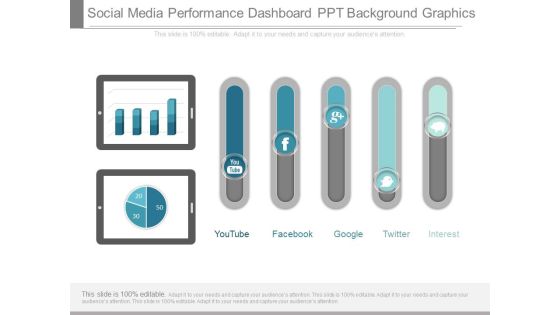
Social Media Performance Dashboard Ppt Background Graphics
This is a social media performance dashboard ppt background graphics. This is a seven stage process. The stages in this process are youtube, facebook, google, twitter, pinterest.

Enterprise Dashboard Ppt Presentation Powerpoint Example
This is a enterprise dashboard ppt presentation powerpoint example. This is a three stage process. The stages in this process are balance scorecard, enterprise performance, industry trends.

Executive Dashboard Design Business Diagram Powerpoint Slides
This is a executive dashboard design business diagram powerpoint slides. This is a three stage process. The stages in this process are jan, feb, mar, apr, may.
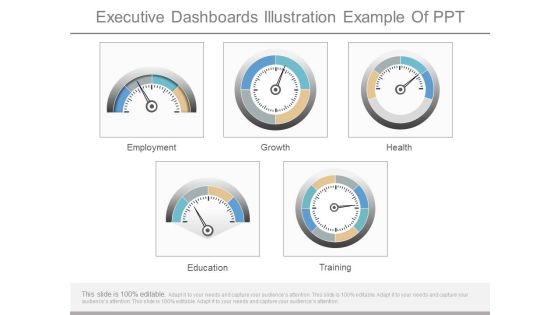
Executive Dashboards Illustration Example Of Ppt
This is a executive dashboards illustration example of ppt. This is a five stage process. The stages in this process are employment, growth, health, education, training.
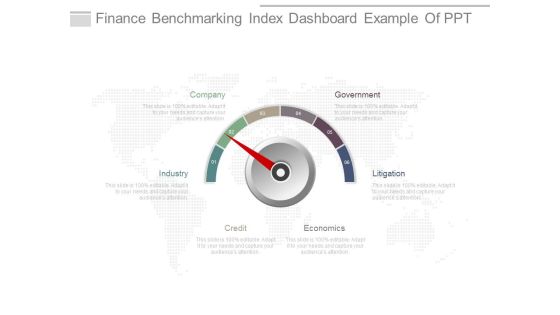
Finance Benchmarking Index Dashboard Example Of Ppt
This is a finance benchmarking index dashboard example of ppt. This is a six stage process. The stages in this process are industry, company, government, litigation, economics, credit.
Info Dashboard Ppt Presentation Powerpoint Example
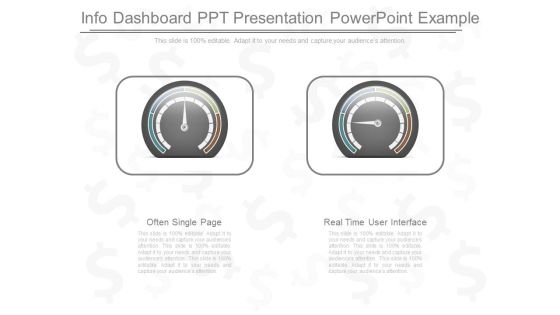
This is a info dashboard ppt presentation powerpoint example. This is a two stage process. The stages in this process are often single page, real time user interface.

Kpi Dashboard Diagram Example Of Ppt Presentation
This is a kpi dashboard diagram example of ppt presentation. This is a five stage process. The stages in this process are business, direction, objectives, data, study.

Kpi Dashboard Ppt Presentation Background Images
This is a kpi dashboard ppt presentation background images. This is a three stage process. The stages in this process are revenue, labor cost, customer satisfaction.

Kpi Reporting Dashboard Powerpoint Slide Background Designs
This is a kpi reporting dashboard powerpoint slide background designs. This is a three stage process. The stages in this process are stability, model assessment, characteristic.

Performance Indicators Dashboard Example Powerpoint Layout
This is a performance indicators dashboard example powerpoint layout. This is a four stage process. The stages in this process are management, resources, processes, analyze solution.
Project Tracking Dashboard Template Ppt Sample
This is a project tracking dashboard template ppt sample. This is a five stage process. The stages in this process are requirements, analytics, needs, performance, analysis.

Business Company Dashboards Ppt Powerpoint Slide Show
This is a business company dashboards ppt powerpoint slide show. This is a four stage process. The stages in this process are presentation, finance, management, business, strategy, success.

Business Dashboard Diagram Ppt Powerpoint Slides
This is a business dashboard diagram ppt powerpoint slides. This is a three stage process. The stages in this process are low, medium, high.

Business Kpi Dashboard Design Presentation Diagrams
This is a business kpi dashboard design presentation diagrams. This is a four stage process. The stages in this process are idea, plan, strategy, solution analysis.

Business Kpi Dashboard Example Powerpoint Presentation
This is a business kpi dashboard example powerpoint presentation. This is a four stage process. The stages in this process are marketing, sales, operations, customer.

Dashboard Design Tools Ppt Presentation Slides
This is a dashboard design tools ppt presentation slides. This is a three stage process. The stages in this process are performance, speed, energy.

Dashboard Project Plan Presentation Powerpoint Example
This is a dashboard project plan presentation powerpoint example. This is a four stage process. The stages in this process are build, test, design, analysis.
Kpi Index Dashboard Diagram Example Of Ppt
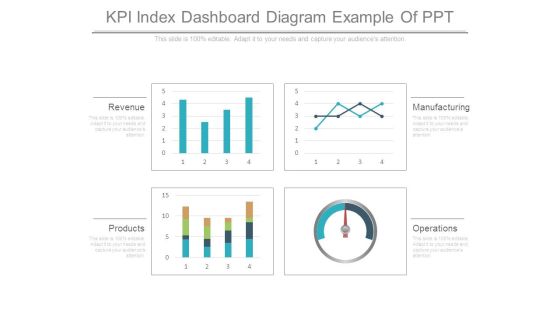
This is a kpi index dashboard diagram example of ppt. This is a four stage process. The stages in this process are revenue, products, operations, manufacturing.
Kpi Inventory Dashboard Example Powerpoint Graphics
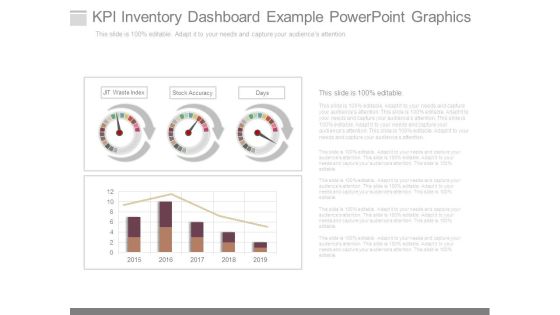
This is a kpi inventory dashboard example powerpoint graphics. This is a three stage process. The stages in this process are jit waste index, stock accuracy, days.
Kpi Leading Indicators Dashboard Diagram Powerpoint Guide
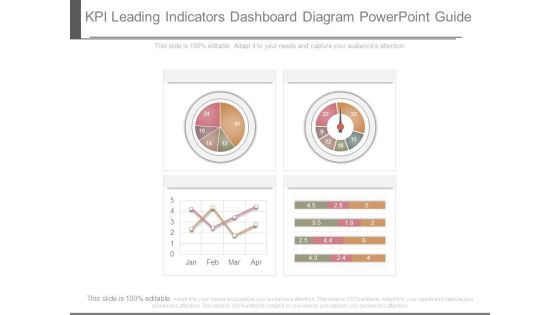
This is a kpi leading indicators dashboard diagram powerpoint guide. This is a four stage process. The stages in this process are business, success, process.
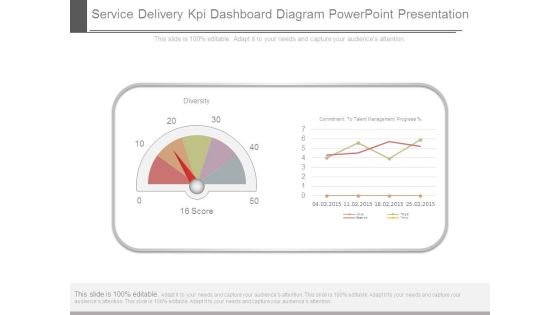
Service Delivery Kpi Dashboard Diagram Powerpoint Presentation
This is a service delivery kpi dashboard diagram powerpoint presentation. This is a two stage process. The stages in this process are diversity, commitment to talent management progress.

Dashboard Business Intelligence Diagram Powerpoint Slides
This is a dashboard business intelligence diagram powerpoint slides. This is a four stage process. The stages in this process are quickbase, flexible, simple, organized.
Team Work Analysis Dashboard Ppt Icon
This is a team work analysis dashboard ppt icon. This is a four stage process. The stages in this process are reward, completion, overdue plans, problems.
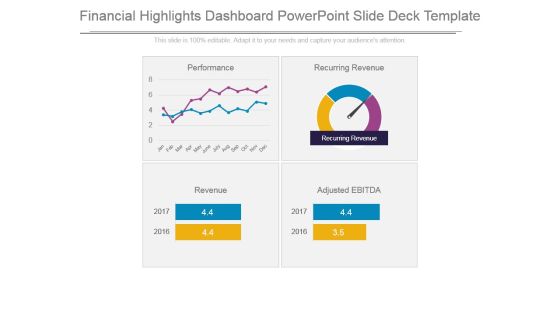
Financial Highlights Dashboard Powerpoint Slide Deck Template
This is a financial highlights dashboard powerpoint slide deck template. This is a four stage process. The stages in this process are recurring revenue, performance, revenue, adjusted ebitda.

Performance Dashboard Ppt PowerPoint Presentation Background Designs
This is a performance dashboard ppt powerpoint presentation background designs. This is a one stage process. The stages in this process are performance, management, marketing, strategy, business.

Dashboard Ppt PowerPoint Presentation Inspiration Introduction
This is a dashboard ppt powerpoint presentation inspiration introduction. This is a three stage process. The stages in this process are low, medium, high.

Dashboard Ppt PowerPoint Presentation File Designs Download
This is a dashboard ppt powerpoint presentation file designs download. This is a three stage process. The stages in this process are business, management, planning, strategy, marketing.
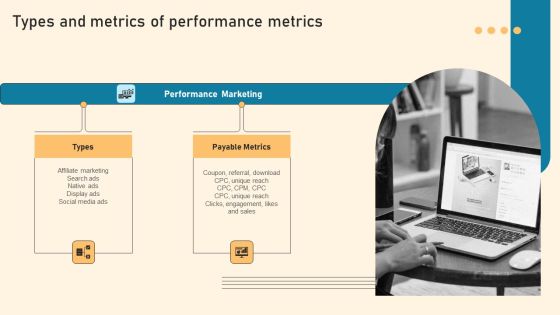
Types And Metrics Of Performance Metrics Ppt PowerPoint Presentation File Infographics PDF
Slidegeeks has constructed Types And Metrics Of Performance Metrics Ppt PowerPoint Presentation File Infographics PDF after conducting extensive research and examination. These presentation templates are constantly being generated and modified based on user preferences and critiques from editors. Here, you will find the most attractive templates for a range of purposes while taking into account ratings and remarks from users regarding the content. This is an excellent jumping off point to explore our content and will give new users an insight into our top notch PowerPoint Templates.

Performance Monitoring Dashboard For Consumer Goods Industry Analysis Of Food Infographics PDF
This slide showcase the performance monitoring dashboard for consumer goods providing information regarding the overview of food and beverages sales, top selling products and on shelf availability.There are so many reasons you need a Performance Monitoring Dashboard For Consumer Goods Industry Analysis Of Food Infographics PDF. The first reason is you can not spend time making everything from scratch, Thus, Slidegeeks has made presentation templates for you too. You can easily download these templates from our website easily.

Organizational Network Security Awareness Staff Learning Organization Cyber Security Dashboard Elements PDF
This slide covers the cyber security key performance indicators for the organization including application health, device license consumption, data encryption status and many more. Deliver and pitch your topic in the best possible manner with this organizational network security awareness staff learning organization cyber security dashboard elements pdf. Use them to share invaluable insights on organization cyber security dashboard and impress your audience. This template can be altered and modified as per your expectations. So, grab it now.
Environmental Assessment Financial Dashboard For Business Impact Tracking Ppt Layouts Guidelines PDF
This slide shows financial dashboard for business impact tracking with key performance indicators like quick ratio, current ratio, monthly cash flow etc Deliver and pitch your topic in the best possible manner with this environmental assessment financial dashboard for business impact tracking ppt layouts guidelines pdf. Use them to share invaluable insights on sales outstanding, cash balance, accounts payable and impress your audience. This template can be altered and modified as per your expectations. So, grab it now.
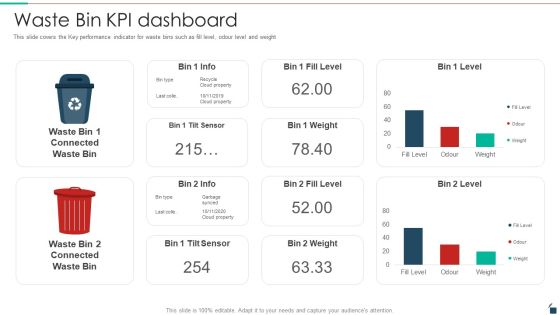
Waste Bin KPI Dashboard Resources Recycling And Waste Management Template PDF
This slide covers the Key performance indicator for waste bins such as fill level, odour level and weight. Deliver an awe inspiring pitch with this creative waste bin kpi dashboard resources recycling and waste management template pdf bundle. Topics like waste bin kpi dashboard can be discussed with this completely editable template. It is available for immediate download depending on the needs and requirements of the user.
Waste Management Tracking Dashboard Resources Recycling And Waste Management Pictures PDF
This slide covers the key performance indicators for waste management including waste trucks tracker, green house gasses emissions, energy used and many more. Deliver an awe inspiring pitch with this creative waste management tracking dashboard resources recycling and waste management pictures pdf bundle. Topics like waste management tracking dashboard can be discussed with this completely editable template. It is available for immediate download depending on the needs and requirements of the user.

AI And ML Driving Monetary Value For Organization Customer Engagement Tracking Kpi Dashboard Pictures PDF
This slide displays customer engagement dashboard. It include key performance indicators namely median lifetime spend. Average churn risk, brand affinities and highly engaged customers. Deliver an awe inspiring pitch with this creative ai and ml driving monetary value for organization customer engagement tracking kpi dashboard pictures pdf bundle. Topics like high earners, high engaged customers, return customers, brand affinities, interests can be discussed with this completely editable template. It is available for immediate download depending on the needs and requirements of the user.
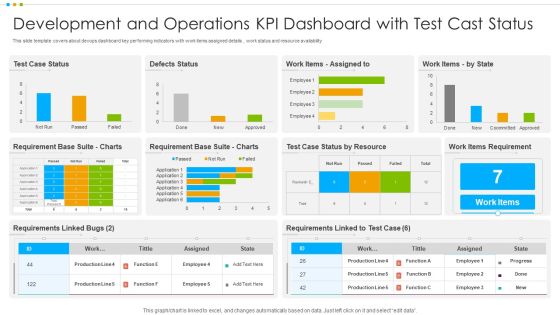
Development And Operations KPI Dashboard With Test Cast Status Graphics PDF
This slide template covers about devops dashboard key performing indicators with work items assigned details , work status and resource availability.Pitch your topic with ease and precision using this Development And Operations KPI Dashboard With Test Cast Status Graphics PDF This layout presents information on Items Requirement, Requirement Base, Assigned It is also available for immediate download and adjustment. So, changes can be made in the color, design, graphics or any other component to create a unique layout.
Shipping And Logistics Tracking Dashboard With Shipments And Fleet Status Pictures PDF
This slide covers Key performance indicators to track the automation system of the company. This dashboard includes Logistics Efficiency Status, delivery time accuracy etc. Deliver an awe inspiring pitch with this creative Shipping And Logistics Tracking Dashboard With Shipments And Fleet Status Pictures PDF bundle. Topics like Profit, Costs, Revenue can be discussed with this completely editable template. It is available for immediate download depending on the needs and requirements of the user.

KPI Dashboard To Manage Various Risks In Project Administration Sample PDF
This slide signifies the key performance indicator dashboard to manage various threats in company project. It covers information about corporate risk, control performance, open issues and map. Showcasing this set of slides titled KPI Dashboard To Manage Various Risks In Project Administration Sample PDF. The topics addressed in these templates are Control Performance, Open Issues, Corporate Risk. All the content presented in this PPT design is completely editable. Download it and make adjustments in color, background, font etc. as per your unique business setting.

Tactical Brand Extension Launching Kpi Dashboard To Monitor Sales And Orders Formats PDF
Following slide displays sales and orders performance monitoring dashboard. Key performance indicators covered in the slide are return reasons, perfect order rate, total orders, top seller by orders. From laying roadmaps to briefing everything in detail, our templates are perfect for you. You can set the stage with your presentation slides. All you have to do is download these easy-to-edit and customizable templates. Tactical Brand Extension Launching Kpi Dashboard To Monitor Sales And Orders Formats PDF will help you deliver an outstanding performance that everyone would remember and praise you for. Do download this presentation today.

Ecommerce KPI Dashboard With Pand L Statement Download PDF
This slide showcases ecommerce key performance indicators KPI dashboard with financial statement. It provides information about total sales, orders, net profit, net profit margin, average order value, channels, etc. This Ecommerce KPI Dashboard With Pand L Statement Download PDF from Slidegeeks makes it easy to present information on your topic with precision. It provides customization options, so you can make changes to the colors, design, graphics, or any other component to create a unique layout. It is also available for immediate download, so you can begin using it right away. Slidegeeks has done good research to ensure that you have everything you need to make your presentation stand out. Make a name out there for a brilliant performance.

Key Account Marketing Approach Present Account Based Performance Delivery Gap Formats PDF
This slide provides information regarding the present delivery gap that firm is facing in terms of its performance as compared to the industry standards. The firms performance is assessed on metrics such as number of accounts closed, conversion rate, etc. Deliver and pitch your topic in the best possible manner with this key account marketing approach present account based performance delivery gap formats pdf. Use them to share invaluable insights on performance metrics, industry benchmark, own firm and impress your audience. This template can be altered and modified as per your expectations. So, grab it now.
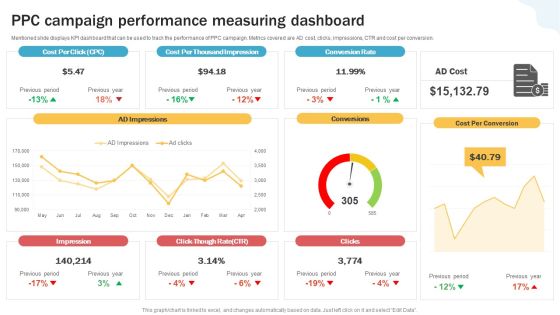
Developing Personal Brand On Social Media Channels Ppc Campaign Performance Measuring Sample PDF
Mentioned slide displays KPI dashboard that can be used to track the performance of PPC campaign. Metrics covered are AD cost, clicks, impressions, CTR and cost per conversion.Do you have an important presentation coming up Are you looking for something that will make your presentation stand out from the rest Look no further than Developing Personal Brand On Social Media Channels Ppc Campaign Performance Measuring Sample PDF. With our professional designs, you can trust that your presentation will pop and make delivering it a smooth process. And with Slidegeeks, you can trust that your presentation will be unique and memorable. So why wait Grab Developing Personal Brand On Social Media Channels Ppc Campaign Performance Measuring Sample PDF today and make your presentation stand out from the rest.
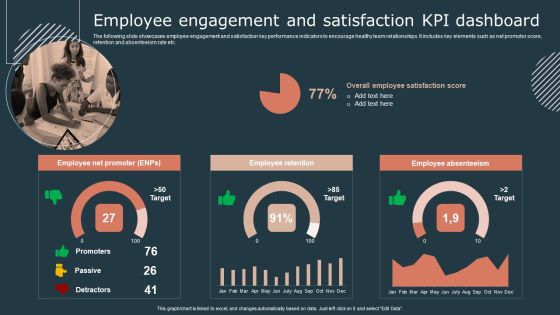
Effective Workforce Participation Action Planning Employee Engagement And Satisfaction Kpi Dashboard Themes PDF
The following slide showcases employee engagement and satisfaction key performance indicators to encourage healthy team relationships. It includes key elements such as net promotor score, retention and absenteeism rate etc. From laying roadmaps to briefing everything in detail, our templates are perfect for you. You can set the stage with your presentation slides. All you have to do is download these easy to edit and customizable templates. Effective Workforce Participation Action Planning Employee Engagement And Satisfaction Kpi Dashboard Themes PDF will help you deliver an outstanding performance that everyone would remember and praise you for. Do download this presentation today.
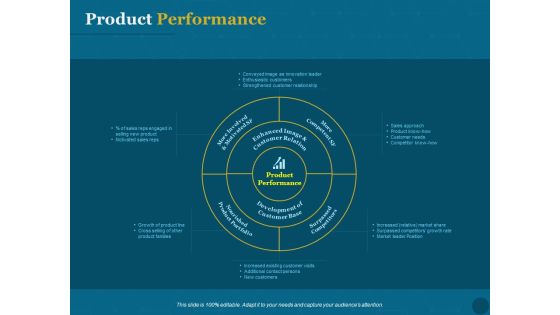
Product Portfolio Management For New Product Development Product Performance Sample PDF
Presenting this set of slides with name product portfolio management for new product development product performance sample pdf. This is a four stage process. The stages in this process are more involved and motivated sf nourished, product portfolio, surpassed competitions, more competent sf. This is a completely editable PowerPoint presentation and is available for immediate download. Download now and impress your audience.

Clear Point Strategy Dashboard Ppt Presentation
This is a clear point strategy dashboard ppt presentation. This is a four stage process. The stages in this process are financial perspective, internal processes perspective, learning and growth perspective, customer perspective.

Balanced Scorecard Dashboard Framework Ppt Sample
This is a balanced scorecard dashboard framework ppt sample. This is a four stage process. The stages in this process are learning and growth, financial, internal business processes, customer.

Software Dashboard Manager Test Diagram Presentation Examples
This is a software dashboard manager test diagram presentation examples. This is a four stage process. The stages in this process are issues by risk level, reported issues, location on map, top contributing factors.
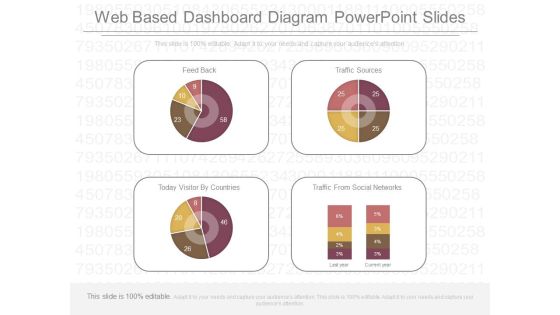
Web Based Dashboard Diagram Powerpoint Slides
This is a web based dashboard diagram powerpoint slides. This is a four stage process. The stages in this process are feed back, traffic sources, today visitor by countries, traffic from social networks.
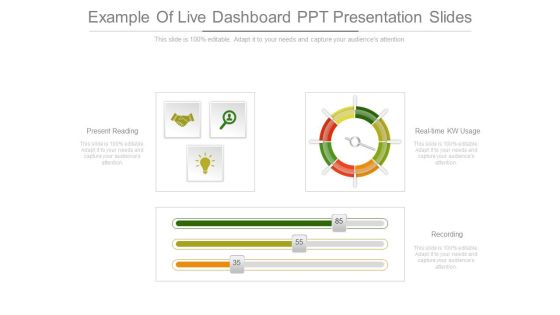
Example Of Live Dashboard Ppt Presentation Slides
This is a example of live dashboard ppt presentation slides. This is a three stage process. The stages in this process are present reading, real time kw usage, recording.
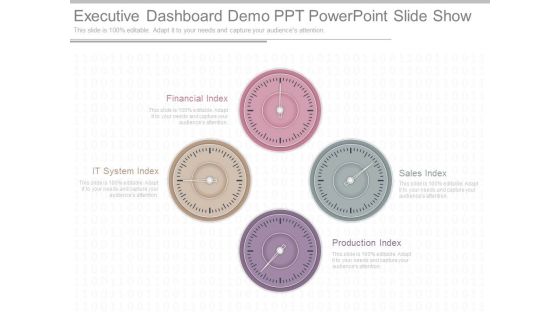
Executive Dashboard Demo Ppt Powerpoint Slide Show
This is a executive dashboard demo ppt powerpoint slide show. This is a four stage process. The stages in this process are financial index, it system index, production index, sales index.
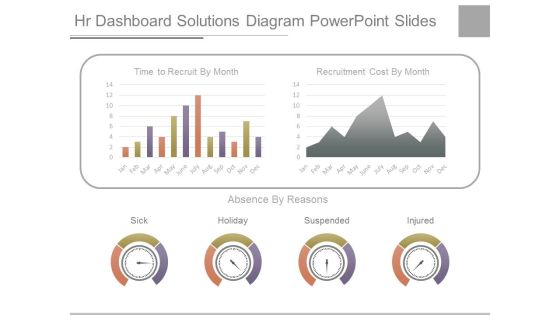
Hr Dashboard Solutions Diagram Powerpoint Slides
This is a hr dashboard solutions diagram powerpoint slides. This is a two stage process. The stages in this process are time to recruit by month, recruitment cost by month, sick, holiday, suspended, injured.

Project Management Kpi Dashboard Diagram Powerpoint Images
This is a project management kpi dashboard diagram powerpoint images. This is a four stage process. The stages in this process are project budget, project goals, project task management, project schedule.

Project Management Status Dashboard Diagram Powerpoint Ideas
This is a project management status dashboard diagram powerpoint ideas. This is a six stage process. The stages in this process are tabular reports, project s status, task status, visual reports, completed tasks, task in progress.
Project Management Status Dashboard Ppt Slides
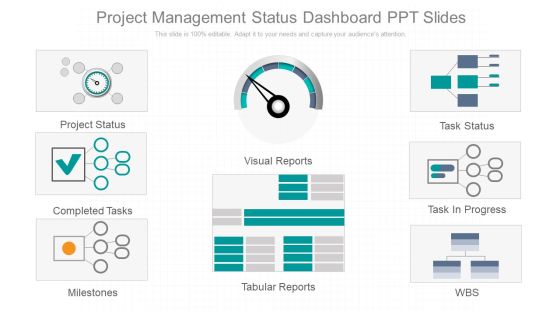
This is a project management status dashboard ppt slides. This is a eight stage process. The stages in this process are project status, completed tasks, milestones, visual reports, tabular reports, task status, task in progress, wbs.

Build Dashboard For Business Diagram Powerpoint Show
This is a build dashboard for business diagram powerpoint show. This is a four stage process. The stages in this process are average internal pv examination lead time, average entry variance, average internal audit lead time, amount contribution.

Business Management Dashboard Design Ppt Slides Show
This is a business management dashboard design ppt slides show. This is a four stage process. The stages in this process are crm system, property system, asset system, finance system.

Competitive Intelligence Dashboard Diagram Ppt Slides
This is a competitive intelligence dashboard diagram ppt slides. This is a four stage process. The stages in this process are monthly sales, inventory turns, customer complaints, company, subject area.
Dudes Charting Dashboard Diagram Powerpoint Design
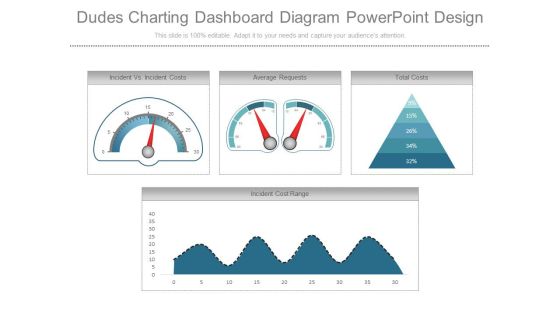
This is a dudes charting dashboard diagram powerpoint design. This is a four stage process. The stages in this process are incident vs incident costs, average requests, total costs, incident cost range.
Financial Dashboard Examples Ppt Powerpoint Slides Design
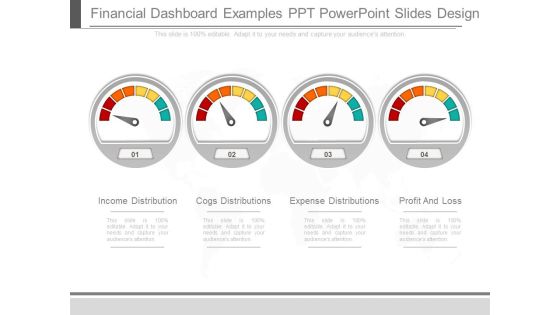
This is a financial dashboard examples ppt powerpoint slides design. This is a four stage process. The stages in this process are income distribution, cogs distributions, expense distributions, profit and loss.

Manufacturing Dashboard Examples Ppt Slide Show
This is a manufacturing dashboard examples ppt slide show. This is a five stage process. The stages in this process are units per hour, effective rate, units until, time unit, status information.
Visual Mining Dashboard Diagram Ppt Example
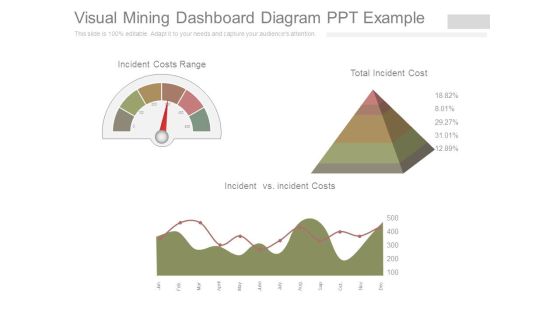
This is a visual mining dashboard diagram ppt example. This is a three stage process. The stages in this process are incident costs range, incident vs incident costs, total incident cost.

Business Object Dashboard Slide Good Ppt Example
This is a business object dashboard slide good ppt example. This is a seven stage process. The stages in this process are engineering, construction, finance, environment, safety, operations, maintenance.

Executive Dashboards Systems Example Of Ppt Presentation
This is a executive dashboards systems example of ppt presentation. This is a five stage process. The stages in this process are schedule management, resource management, document management, inventory management, meeting management.

Dashboards For Lead Scoring Powerpoint Topics
This is a dashboards for lead scoring powerpoint topics. This is a four stage process. The stages in this process are number of scoring rules, projects completed, adoption of lead scoring solutions chosen, number of dimensions.

Kpi Dashboard For Operations Powerpoint Slide Images
This is a kpi dashboard for operations powerpoint slide images. This is a four stage process. The stages in this process are outcasts, earned revenue, operations, successful adverts, sold products.
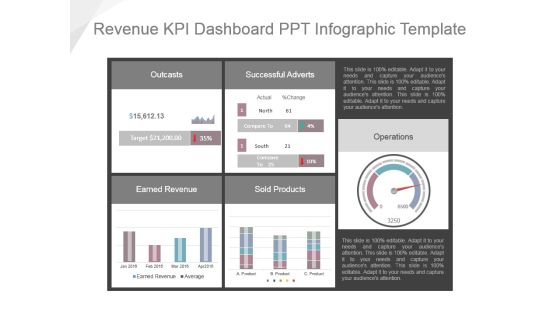
Revenue Kpi Dashboard Ppt Infographic Template
This is a revenue kpi dashboard ppt infographic template. This is a five stage process. The stages in this process are outcasts, successful adverts, earned revenue, sold products, operations.

Financial Highlights Growth Analysis Dashboard Powerpoint Slide
This is a financial highlights growth analysis dashboard powerpoint slide. This is a four stage process. The stages in this process are profit and loss, sales, operating expenses, operating income, net income, profitability.

Finance Dashboard Ppt PowerPoint Presentation Design Ideas
This is a finance dashboard ppt powerpoint presentation design ideas. This is a two stage process. The stages in this process are sales, operating expenses, operating income, net income.

Finance Dashboard Ppt PowerPoint Presentation Diagrams
This is a finance dashboard ppt powerpoint presentation diagrams. This is a four stage process. The stages in this process are increased efficiency, better business decision making, improved customer experience and engagement, achieved financial savings.

Project Dashboard Ppt PowerPoint Presentation Model Layouts
This is a project dashboard ppt powerpoint presentation model layouts. This is a five stage process. The stages in this process are key discussion items, project status, issues, objective, main focus.

Project Dashboard Ppt PowerPoint Presentation Professional Show
This is a project dashboard ppt powerpoint presentation professional show. This is a six stage process. The stages in this process are primary resources, timeline, objective, main focus, key discussion items.
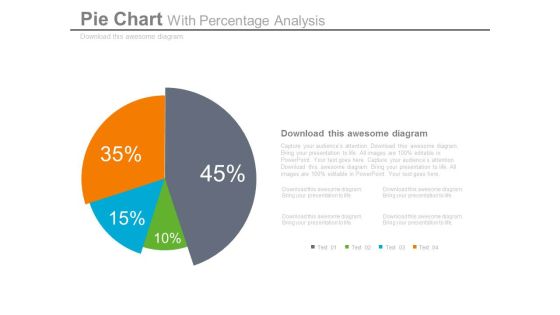
Pie Chart Dashboard Style For Percentage Analysis Powerpoint Slides
This dashboard PPT template contains graphics of pie chart. This dashboard PowerPoint template helps to display percentage analysis in a visual manner. Download this PPT slide for quick decision-making.

70 Dashboard Business Management Ppt PowerPoint Presentation Model Portfolio
This is a 70 dashboard business management ppt powerpoint presentation model portfolio. This is a four stage process. The stages in this process are dashboard, business, marketing, management, planning.

Dashboards For Retail Store Customer Service Retail Outlet Operations Performance Evaluation Pictures PDF
This slide includes dashboards for retail store customer service providing details of NPS, CSAT score. It also covers details of shoppers response towards product quality and price. Deliver an awe inspiring pitch with this creative Dashboards For Retail Store Customer Service Retail Outlet Operations Performance Evaluation Pictures PDF bundle. Topics like Customer Effort, Promoter Score, Customer Satisfaction can be discussed with this completely editable template. It is available for immediate download depending on the needs and requirements of the user.

Balanced Scorecard Pros And Cons With Efficiency Improvement Ppt PowerPoint Presentation Summary Infographic Template PDF
Presenting this set of slides with name balanced scorecard pros and cons with efficiency improvement ppt powerpoint presentation summary infographic template pdf. This is a two stage process. The stages in this process are benefits, provide structure to business strategy, improves efficiency and productivity, lack of risk analysis, increase labor and administrative costs, lack of external focus, drawbacks. This is a completely editable PowerPoint presentation and is available for immediate download. Download now and impress your audience.

Problems And Benefits Of Balanced Scorecard Ppt PowerPoint Presentation Infographics Pictures PDF
Presenting this set of slides with name problems and benefits of balanced scorecard ppt powerpoint presentation infographics pictures pdf. This is a three stage process. The stages in this process are benefits, strategy map, drawbacks, improve efficiency and productivity, increase customer loyalty, lack of risk analysis, no focus on external factors and competitors. This is a completely editable PowerPoint presentation and is available for immediate download. Download now and impress your audience.

Business Process Performance Measurement Client Testimonials For Measuring Business Performance Company Inspiration PDF
Presenting this set of slides with name business process performance measurement client testimonials for measuring business performance company inspiration pdf. This is a three stage process. The stages in this process are client testimonials, measuring, business, performance. This is a completely editable PowerPoint presentation and is available for immediate download. Download now and impress your audience.

Business Process Performance Measurement Client Testimonials For Measuring Business Performance Elements PDF
Presenting this set of slides with name business process performance measurement client testimonials for measuring business performance elements pdf. This is a two stage process. The stages in this process are client testimonials, measuring, business, performance. This is a completely editable PowerPoint presentation and is available for immediate download. Download now and impress your audience.

Business Process Performance Measurement Contact Us For Measuring Business Performance Microsoft PDF
Presenting this set of slides with name business process performance measurement contact us for measuring business performance microsoft pdf. This is a three stage process. The stages in this process are contact us, measuring, business, performance. This is a completely editable PowerPoint presentation and is available for immediate download. Download now and impress your audience.

Business Process Performance Measurement Cover Letter For Measuring Business Performance Mockup PDF
Presenting this set of slides with name business process performance measurement cover letter for measuring business performance mockup pdf. This is a one stage process. The stages in this process are cover letter, measuring, business, performance. This is a completely editable PowerPoint presentation and is available for immediate download. Download now and impress your audience.

Business Process Performance Measurement Our Team For Measuring Business Performance Development Microsoft PDF
Presenting this set of slides with name business process performance measurement our team for measuring business performance development microsoft pdf. This is a two stage process. The stages in this process are our team, measuring, business, performance. This is a completely editable PowerPoint presentation and is available for immediate download. Download now and impress your audience.

Business Process Performance Measurement Our Team For Measuring Business Performance Designs PDF
Presenting this set of slides with name business process performance measurement our team for measuring business performance designs pdf. This is a three stage process. The stages in this process are our team, measuring, business, performance. This is a completely editable PowerPoint presentation and is available for immediate download. Download now and impress your audience.

Business Process Performance Measurement Roadmap For Measuring Business Performance Background PDF
Presenting this set of slides with name business process performance measurement roadmap for measuring business performance background pdf. This is a six stage process. The stages in this process are roadmap, measuring, business, performance. This is a completely editable PowerPoint presentation and is available for immediate download. Download now and impress your audience.

Business Process Performance Measurement Timeline For Measuring Business Performance Summary PDF
Presenting this set of slides with name business process performance measurement timeline for measuring business performance summary pdf. This is a five stage process. The stages in this process are timeline, measuring, business, performance. This is a completely editable PowerPoint presentation and is available for immediate download. Download now and impress your audience.

Business Process Performance Measurement Why Us For Measuring Business Performance Microsoft PDF
Presenting this set of slides with name business process performance measurement why us for measuring business performance microsoft pdf. This is a four stage process. The stages in this process are measuring business performance. This is a completely editable PowerPoint presentation and is available for immediate download. Download now and impress your audience.

Measuring Brand Manager Measurement Channel Preferences Using Market Survey Results Professional PDF
Mentioned slide highlights key statistics which can be used for measuring brand manager channel preferences. The statistics mentioned in the slide are email marketing, social media marketing, online ads, print advertisement and trade shows. Pitch your topic with ease and precision using this measuring brand manager measurement channel preferences using market survey results professional pdf. This layout presents information on measuring brand manager measurement channel preferences using market survey results. It is also available for immediate download and adjustment. So, changes can be made in the color, design, graphics or any other component to create a unique layout.

Workforce Security Realization Coaching Plan Organization Cyber Security Dashboard Template PDF
This slide covers the cyber security key performance indicators for the organization including application health, device license consumption, data encryption status and many more. Deliver an awe-inspiring pitch with this creative workforce security realization coaching plan organization cyber security dashboard template pdf bundle. Topics like makes and models, operating systems, encryption status, application health, license consumption can be discussed with this completely editable template. It is available for immediate download depending on the needs and requirements of the user.
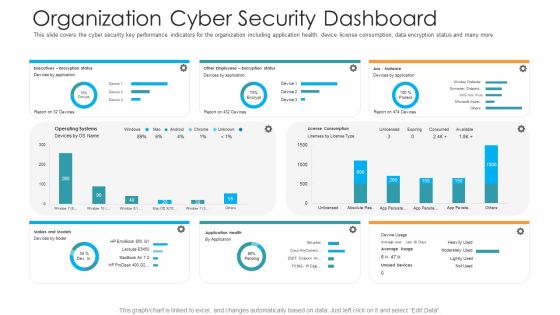
Organization Cyber Security Dashboard Hacking Prevention Awareness Training For IT Security Professional PDF
This slide covers the cyber security key performance indicators for the organization including application health, device license consumption, data encryption status and many more. Deliver and pitch your topic in the best possible manner with this organization cyber security dashboard hacking prevention awareness training for it security professional pdf. Use them to share invaluable insights on executives, license consumption, operating systems and impress your audience. This template can be altered and modified as per your expectations. So, grab it now.

Performance Analysis Of New Product Development Product Sales Vs Product Return Infographics PDF
Purpose of the following slide is to show the product sales vs. product return ratio of the organization, the provided graph displays the sales of the product in each month in comparison to the returns. Deliver an awe inspiring pitch with this creative performance analysis of new product development product sales vs product return infographics pdf bundle. Topics like comparison, sales, returns can be discussed with this completely editable template. It is available for immediate download depending on the needs and requirements of the user.
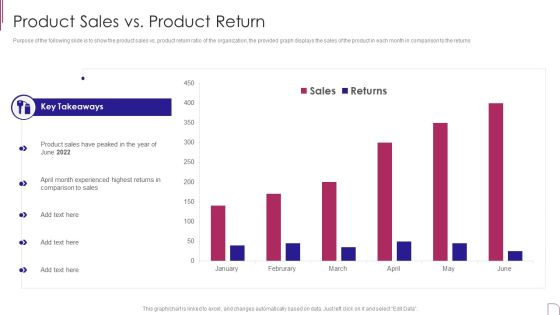
Yearly Product Performance Assessment Repor Product Sales Vs Product Return Information PDF
Purpose of the following slide is to show the product sales vs. product return ratio of the organization, the provided graph displays the sales of the product in each month in comparison to the returns.Deliver an awe inspiring pitch with this creative Yearly Product Performance Assessment Repor Product Sales Vs Product Return Information PDF bundle. Topics like Key Takeaways, Experienced Highest, Comparison Sales can be discussed with this completely editable template. It is available for immediate download depending on the needs and requirements of the user.
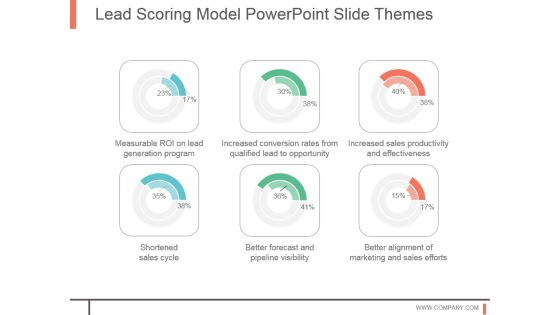
Lead Scoring Model Powerpoint Slide Themes
This is a lead scoring model powerpoint slide themes. This is a six stage process. The stages in this process are measurable roi on lead generation program, increased conversion rates from qualified lead to opportunity, increased sales productivity and effectiveness, shortened sales cycle, better forecast and pipeline visibility, better alignment of marketing and sales efforts.

Competition Scorecard For Merchandise Industry Operational Plan For Business Startup Elements PDF
The purpose of this slide is to provide glimpse about the major competitors and their scorecard on crucial parameters like market share, product quality, etc. Deliver and pitch your topic in the best possible manner with this competition scorecard for merchandise industry operational plan for business startup elements pdf. Use them to share invaluable insights on market share, advertising, global expansion, price competition, customer service and impress your audience. This template can be altered and modified as per your expectations. So, grab it now.

Our Lead Qualification Scorecard Business To Business Promotion Sales Lead Topics PDF
Purpose of the following slide is to display the lead qualification scorecard that the organization can utilize to understand the nature and qualification criterias for leads. It includes strength of conviction, their value, score etc.Deliver an awe inspiring pitch with this creative Our Lead Qualification Scorecard Business To Business Promotion Sales Lead Topics PDF bundle. Topics like Impact Business, Product Managerial, Each Category can be discussed with this completely editable template. It is available for immediate download depending on the needs and requirements of the user.

Product Performance And Product Competitive Analysis New Product Portfolio Management Download PDF
Presenting product performance and product competitive analysis new product portfolio management download pdf to provide visual cues and insights. Share and navigate important information on four stages that need your due attention. This template can be used to pitch topics like discovery, development, commercialization, basis of interest. In addtion, this PPT design contains high resolution images, graphics, etc, that are easily editable and available for immediate download.
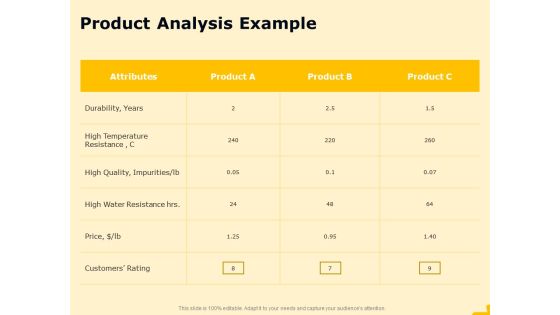
Product Performance And Product Competitive Analysis Product Analysis Example Information PDF
This is a product performance and product competitive analysis product analysis example information pdff template with various stages. Focus and dispense information on seven stages using this creative set, that comes with editable features. It contains large content boxes to add your information on topics like function, cost, customer, safety, environment. You can also showcase facts, figures, and other relevant content using this PPT layout. Grab it now.

Sales Kpi Dashboard Graphics Example Of Ppt
This is a sales kpi dashboard graphics example of ppt. This is a five stage process. The stages in this process are cost per lead, revenue per lead, new customers, customer satisfaction, revenue per sale, cost per sale, profit per sale.
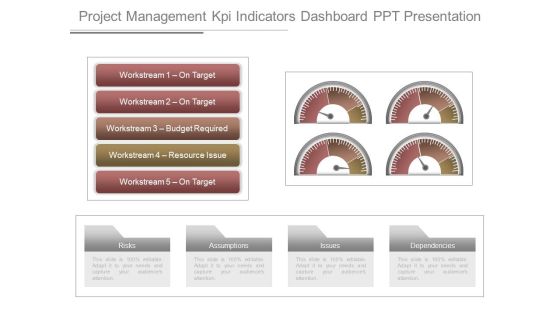
Project Management Kpi Indicators Dashboard Ppt Presentation
This is a project management kpi indicators dashboard ppt presentation. This is a three stage process. The stages in this process are workstream 1 on target, workstream 2 on target, workstream 3 budget required, workstream 4 resource issue, workstream 5 on target.
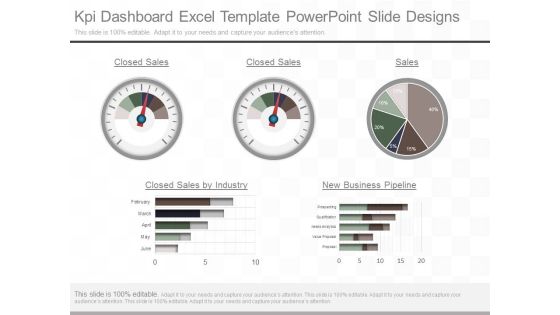
Kpi Dashboard Excel Template Powerpoint Slide Designs
This is a kpi dashboard excel template powerpoint slide designs. This is a five stage process. The stages in this process are closed sales, closed sales, sales, closed sales by industry, new business pipeline, february, march april, may, june, prospecting, qualification, needs analytics, value proposal, proposal.

Kpi Service Dashboard Ppt Powerpoint Slide Designs
This is a kpi service dashboard ppt powerpoint slide designs. This is a four stage process. The stages in this process are service requests resolved within target, service requests by priority, service requests by category, calls offered, jan, feb, mar, apr, may, june, july, aug, sep, oct, nov, dec.
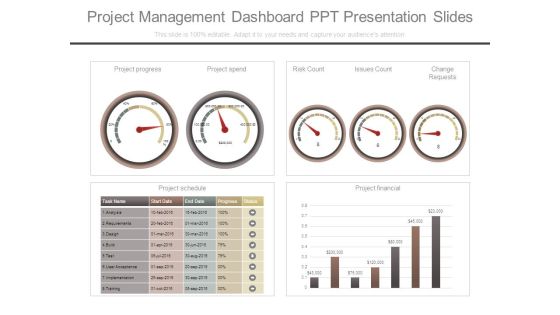
Project Management Dashboard Ppt Presentation Slides
This is a project management dashboard ppt presentation slides. This is a four stage process. The stages in this process are project progress, project spend, risk count, issues count, change requests, project schedule, project financial, task name, start date, end date, progress, status, analysis, requirements, design, build, test, user acceptance, implementation, training.

Digital Dashboard Resource Kit Ppt Powerpoint Slides Design
This is a digital dashboard resource kit ppt powerpoint slides design. This is a four stage process. The stages in this process are sales rate, progress, profits, safety.

High Low Risk Level Dashboard Powerpoint Slide Clipart
This is a high low risk level dashboard powerpoint slide clipart. This is a three stage process. The stages in this process are high, medium, low.

Dashboard For Risk Tolerance Levels Ppt Samples Download
This is a dashboard for risk tolerance levels ppt samples download. This is a three stage process. The stages in this process are low, middle, high, risk.

Dashboard For Risk Tolerance Analysis Good Ppt Example
This is a dashboard for risk tolerance analysis good ppt example. This is a three stage process. The stages in this process are low, medium, high, risk.

Dashboard For Product Quality Ppt PowerPoint Presentation Ideas
This is a dashboard for product quality ppt powerpoint presentation ideas. This is a five stage process. The stages in this process are bad, poor, average, good, excellent.
Performance Dashboard Management Ppt PowerPoint Presentation Icon Themes
This is a performance dashboard management ppt powerpoint presentation icon themes. This is a four stage process. The stages in this process are finance, marketing, analysis, business, investment.

Performance Dashboard Marketing Ppt PowerPoint Presentation Show Microsoft
This is a performance dashboard marketing ppt powerpoint presentation show microsoft. This is a four stage process. The stages in this process are finance, marketing, analysis, business, investment.

Performance Dashboard Ppt PowerPoint Presentation Model Graphics Example
This is a performance dashboard ppt powerpoint presentation model graphics example. This is a four stage process. The stages in this process are finance, marketing, analysis, business, investment.
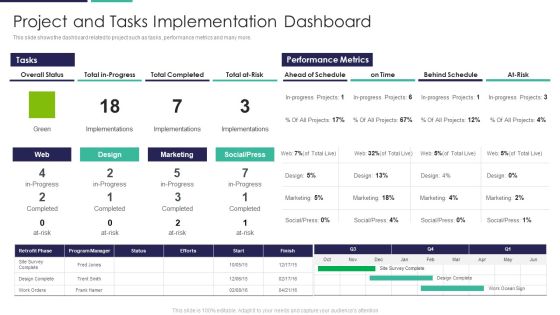
Project And Tasks Implementation Dashboard Sample PDF
This slide shows the dashboard related to project such as tasks, performance metrics and many more. Deliver an awe inspiring pitch with this creative project and tasks implementation dashboard sample pdf bundle. Topics like implementations, risk, design, marketing can be discussed with this completely editable template. It is available for immediate download depending on the needs and requirements of the user.

Objective Goals Strategies And Measures Framework With Marketing Strategies And Measures Diagrams PDF
This slide showcases OGSM framework that can help organization to identify the long term goals and formulate strategies to achieve them. It also showcases implementation progress of strategies and measures to quantify outcomes. Presenting Strategy, Owner, Measure to dispense important information. This template comprises three stages. It also presents valuable insights into the topics including Strategy, Owner, Measure. This is a completely customizable PowerPoint theme that can be put to use immediately. So, download it and address the topic impactfully.
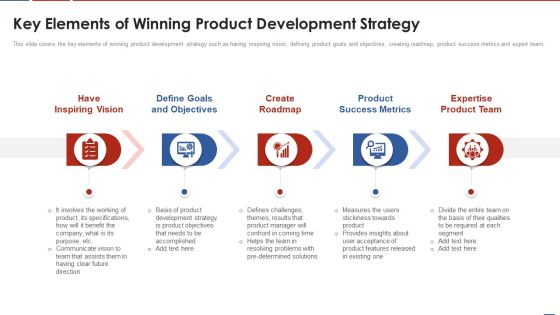
Formulating Product Development Action Plan To Enhance Client Experience Key Elements Of Winning Product Information PDF
This slide covers the key elements of winning product development strategy such as having inspiring vision, defining product goals and objectives, creating roadmap, product success metrics and expert team. Presenting formulating product development action plan to enhance client experience key elements of winning product information pdf to provide visual cues and insights. Share and navigate important information on five stages that need your due attention. This template can be used to pitch topics like inspiring vision, goals and objectives, create roadmap, product success metrics, expertise product team. In addtion, this PPT design contains high resolution images, graphics, etc, that are easily editable and available for immediate download.

Best Techniques To Enhance New Product Management Efficiency Key Elements Of Winning Product Icons PDF
This slide covers the key elements of winning product development strategy such as having inspiring vision, defining product goals and objectives, creating roadmap, product success metrics and expert team. Presenting best techniques to enhance new product management efficiency key criteria to evaluate new product information pdf to provide visual cues and insights. Share and navigate important information on five stages that need your due attention. This template can be used to pitch topics like define goals and objectives, create roadmap, product success metrics. In addtion, this PPT design contains high resolution images, graphics, etc, that are easily editable and available for immediate download.

Satisfying Consumers Through Strategic Product Building Plan Key Elements Of Winning Product Microsoft PDF
This slide covers the key elements of winning product development strategy such as having inspiring vision, defining product goals and objectives, creating roadmap, product success metrics and expert team. This is a satisfying consumers through strategic product building plan key elements of winning product microsoft pdf template with various stages. Focus and dispense information on five stages using this creative set, that comes with editable features. It contains large content boxes to add your information on topics like have inspiring vision, define goals and objectives, create roadmap, product success metrics, expertise product team. You can also showcase facts, figures, and other relevant content using this PPT layout. Grab it now.

New Product Development Process Optimization Key Elements Of Winning Product Brochure PDF
This slide covers the key elements of winning product development strategy such as having inspiring vision, defining product goals and objectives, creating roadmap, product success metrics and expert team. This is a new product development process optimization key elements of winning product brochure pdf template with various stages. Focus and dispense information on six stages using this creative set, that comes with editable features. It contains large content boxes to add your information on topics like and objectives, roadmap, success metrics, expertise product team. You can also showcase facts, figures, and other relevant content using this PPT layout. Grab it now.

Mortgage Recovery Strategy For Finance Companies Utilizing Key Debt Collection Tools Elements PDF
Purpose of the following slid is to show the key tools that the organization can use to manage their debts, these tools are evaluated on the basis of various metrics. These metrics can be price of the product, error rate and the response rate Presenting Mortgage Recovery Strategy For Finance Companies Utilizing Key Debt Collection Tools Elements PDF to provide visual cues and insights. Share and navigate important information on six stages that need your due attention. This template can be used to pitch topics like Error Rate, Debt Collection Tools. In addtion, this PPT design contains high resolution images, graphics, etc, that are easily editable and available for immediate download.
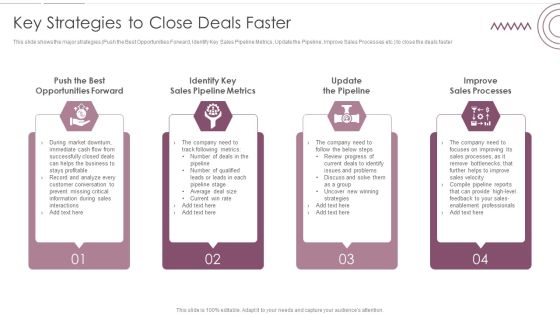
Sales Management Pipeline For Effective Lead Generation Key Strategies To Close Deals Faster Themes PDF
This slide shows the major strategies Push the Best Opportunities Forward, Identify Key Sales Pipeline Metrics, Update the Pipeline, Improve Sales Processes etc. to close the deals faster. Presenting Sales Management Pipeline For Effective Lead Generation Key Strategies To Close Deals Faster Themes PDF to provide visual cues and insights. Share and navigate important information on four stages that need your due attention. This template can be used to pitch topics like Sales Pipeline Metrics, Improve Sales Processes, Opportunities Forward. In addtion, this PPT design contains high resolution images, graphics, etc, that are easily editable and available for immediate download.
