Kpis

Tags To Measure Performance Powerpoint Slide Designs
This is a tags to measure performance powerpoint slide designs. This is a five stage process. The stages in this process are icons, marketing, business, strategy.
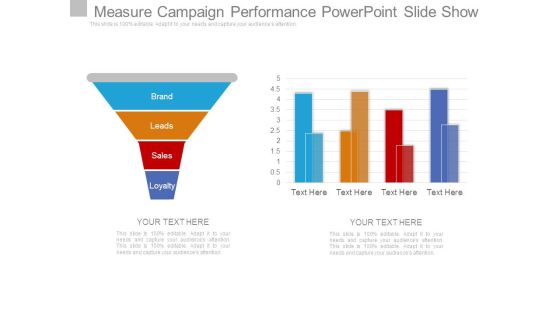
Measure Campaign Performance Powerpoint Slide Show
This is a measure campaign performance powerpoint slide show. This is a four stage process. The stages in this process are brand, leads, sales, loyalty.

Performance Management Measures Powerpoint Presentation Templates
This is a performance management measures powerpoint presentation templates. This is a five stage process. The stages in this process are specialty, acceptability, strategic congruence, reliability, validity.

Value Stream Mapping Measures Diagram Ppt Slides
This is a value stream mapping measures diagram ppt slides. This is a three stage process. The stages in this process are takt time, cycle time, lead time.
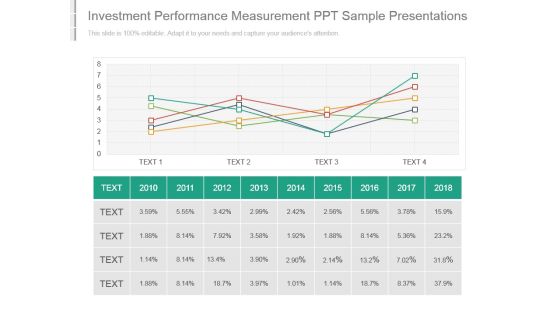
Investment Performance Measurement Ppt Sample Presentations
This is a investment performance measurement ppt sample presentations. This is a five stage process. The stages in this process are business, management, marketing, presentation, success.
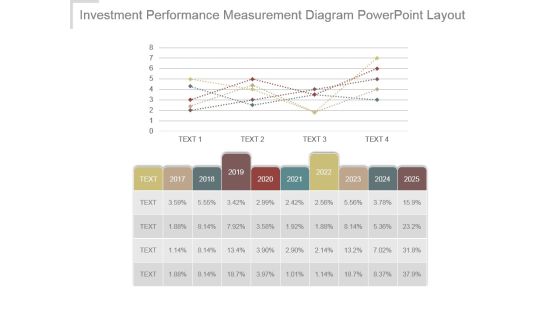
Investment Performance Measurement Diagram Powerpoint Layout
This is a investment performance measurement diagram powerpoint layout. This is a five stage process. The stages in this process are bar graph, growth, success, business, marketing.
Measure Cost Per Acquisition Ppt Icon
This is a measure cost per acquisition ppt icon. This is a three stage process. The stages in this process are rising, steady, falling.
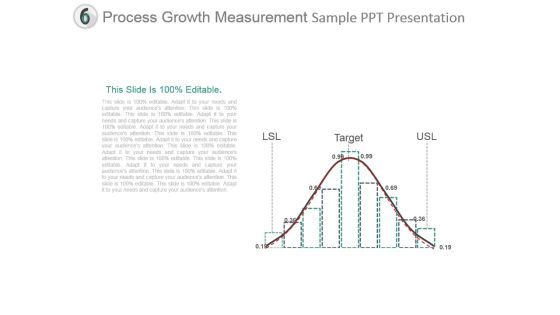
Process Growth Measurement Sample Ppt Presentation
This is a process growth measurement sample ppt presentation. This is a one stage process. The stages in this process are lsl, target, usl.
Measure Ppt PowerPoint Presentation Ideas Background Images
This is a measure ppt powerpoint presentation ideas background images. This is a five stage process. The stages in this process are strategy, process, business, marketing, analysis, icons.
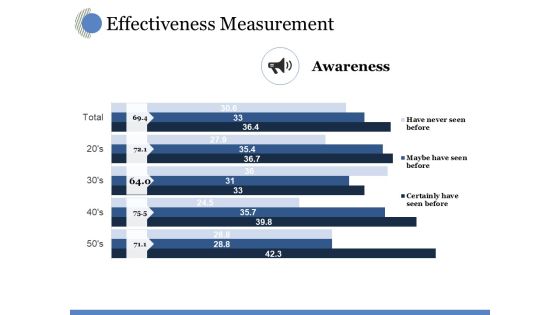
Effectiveness Measurement Ppt PowerPoint Presentation Inspiration Guide
This is a effectiveness measurement ppt powerpoint presentation inspiration guide. This is a five stage process. The stages in this process are awareness, business, marketing, strategy, finance.

Effectiveness Measurement Ppt PowerPoint Presentation Styles Ideas
This is a effectiveness measurement ppt powerpoint presentation styles ideas. This is a five stage process. The stages in this process are awareness, business, marketing, finance, strategy.

Effectiveness Measurement Ppt PowerPoint Presentation Professional Slide
This is a effectiveness measurement ppt powerpoint presentation professional slide. This is a three stage process. The stages in this process are awareness, business, marketing, strategy, finance.

Brand Measurement Ppt PowerPoint Presentation Pictures Shapes
This is a brand measurement ppt powerpoint presentation pictures shapes. This is a two stage process. The stages in this process are finance, marketing, management, investment, analysis.

Client Loyalty Measurement Experience Structure Background PDF
This slide covers the loyalty measurement framework to enhance the customer experience . It includes emotional and behavioral loyalty types with measurement approach. Persuade your audience using this Client Loyalty Measurement Experience Structure Background PDF. This PPT design covers Four stages, thus making it a great tool to use. It also caters to a variety of topics including Client Loyalty Measurement, Experience Structure. Download this PPT design now to present a convincing pitch that not only emphasizes the topic but also showcases your presentation skills.

Build Measure Learn Feedback Cycle Template PDF
The slide showcases a build measure learn cycle, a feedback loop to turn uncertainties, assumptions and risks into knowledge to guide organizations and business towards progress. It covers phases like build, measure and learn. Presenting Build Measure Learn Feedback Cycle Template PDF to dispense important information. This template comprises six stages. It also presents valuable insights into the topics including Build, Measure, Learn. This is a completely customizable PowerPoint theme that can be put to use immediately. So, download it and address the topic impactfully.

Dashboard For Inbound Marketing Efforts B2B Electronic Commerce Startup Inspiration PDF
The following slide displays key metrics that can help the organization to measure effectiveness of inbound marketing strategy, these can be cost per conversion, clicks, impressions, etc. Are you in need of a template that can accommodate all of your creative concepts This one is crafted professionally and can be altered to fit any style. Use it with Google Slides or PowerPoint. Include striking photographs, symbols, depictions, and other visuals. Fill, move around, or remove text boxes as desired. Test out color palettes and font mixtures. Edit and save your work, or work with colleagues. Download Dashboard For Inbound Marketing Efforts B2B Electronic Commerce Startup Inspiration PDF and observe how to make your presentation outstanding. Give an impeccable presentation to your group and make your presentation unforgettable.
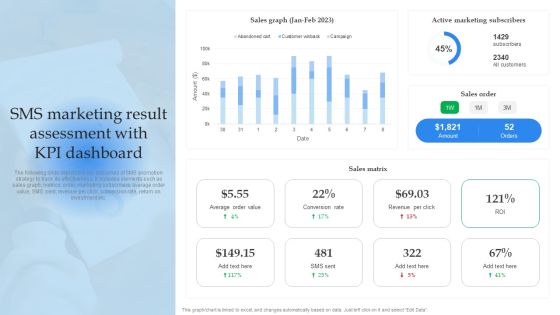
Mobile Promotion Strategic Guide For Micro Businesses Sms Marketing Result Assessment With Kpi Dashboard Slides PDF
The following slide depicts the key outcomes of SMS promotion strategy to track its effectiveness. It includes elements such as sales graph, metrics, order, marketing subscribers, average order value, SMS sent, revenue per click, conversion rate, return on investment etc. Slidegeeks is here to make your presentations a breeze with Mobile Promotion Strategic Guide For Micro Businesses Sms Marketing Result Assessment With Kpi Dashboard Slides PDF With our easy to use and customizable templates, you can focus on delivering your ideas rather than worrying about formatting. With a variety of designs to choose from, you are sure to find one that suits your needs. And with animations and unique photos, illustrations, and fonts, you can make your presentation pop. So whether you are giving a sales pitch or presenting to the board, make sure to check out Slidegeeks first.

Mechanisms Of Measurement And Analysis Ppt Design
This is a mechanisms of measurement and analysis ppt design. This is a ten stage process. The stages in this process are phenomena and analytical, data analysis and understand, general support capabilities, regional spatial, local spatial characterization, local point measurement, assess site monitoring requirements, monitoring plan and equipment, deploy instrumentation, instrument development.
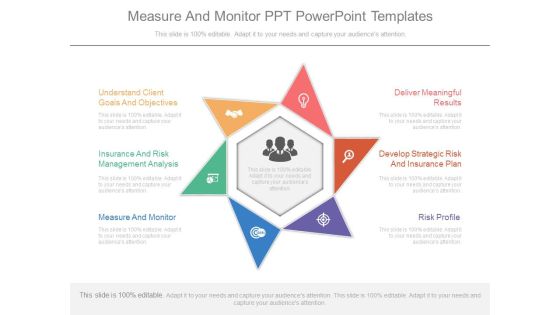
Measure And Monitor Ppt Powerpoint Templates
This is a measure and monitor ppt powerpoint templates. This is a six stage process. The stages in this process are understand client goals and objectives, insurance and risk management analysis, measure and monitor, risk profile, develop strategic risk and insurance plan, deliver meaningful results.
Icon To Measurement Brand Awareness Structure PDF
Showcasing this set of slides titled icon to measurement brand awareness structure pdf. The topics addressed in these templates are icon to measurement brand awareness. All the content presented in this PPT design is completely editable. Download it and make adjustments in color, background, font etc. as per your unique business setting.

Consumer Demand Kpi Measurement Icon Clipart PDF
Showcasing this set of slides titled Consumer Demand Kpi Measurement Icon Clipart PDF. The topics addressed in these templates are Consumer Demand KPI Measurement Icon. All the content presented in this PPT design is completely editable. Download it and make adjustments in color, background, font etc. as per your unique business setting.

Health IT Safety Measurement Framework Summary PDF
Showcasing this set of slides titled Health IT Safety Measurement Framework Summary PDF. The topics addressed in these templates are Expected Measurement Impact, Organizational Knowledge, Enabled Healthcare. All the content presented in this PPT design is completely editable. Download it and make adjustments in color, background, font etc. as per your unique business setting.

Analyzing Cost Reducing Measures Icon Ideas PDF
Persuade your audience using this Analyzing Cost Reducing Measures Icon Ideas PDF. This PPT design covers Three stages, thus making it a great tool to use. It also caters to a variety of topics including Analyzing Cost, Reducing Measures Icon. Download this PPT design now to present a convincing pitch that not only emphasizes the topic but also showcases your presentation skills.

Company Cost Reducing Measures Icon Infographics PDF
Persuade your audience using this Company Cost Reducing Measures Icon Infographics PDF. This PPT design covers Three stages, thus making it a great tool to use. It also caters to a variety of topics including Company Cost Reducing, Measures Icon. Download this PPT design now to present a convincing pitch that not only emphasizes the topic but also showcases your presentation skills.

Operational Cost Reducing Measures Icon Microsoft PDF
Presenting Operational Cost Reducing Measures Icon Microsoft PDF to dispense important information. This template comprises Three stages. It also presents valuable insights into the topics including Operational Cost, Reducing Measures Icon. This is a completely customizable PowerPoint theme that can be put to use immediately. So, download it and address the topic impactfully.

Data Management Performance Measurement Icon Microsoft PDF
Presenting Data Management Performance Measurement Icon Microsoft PDF to dispense important information. This template comprises three stages. It also presents valuable insights into the topics including Data Management, Performance Measurement Icon. This is a completely customizable PowerPoint theme that can be put to use immediately. So, download it and address the topic impactfully.

Optimizing Online Stores Email Campaign Performance KPI Dashboard Graphics PDF
This slide covers dashboard providing an insight related to how subscribers and resonating with email marketing campaign. It key performance metrics such as sessions from email, sessions from email by campaign, sessions by email by date etc. Crafting an eye-catching presentation has never been more straightforward. Let your presentation shine with this tasteful yet straightforward Optimizing Online Stores Email Campaign Performance KPI Dashboard Graphics PDF template. It offers a minimalistic and classy look that is great for making a statement. The colors have been employed intelligently to add a bit of playfulness while still remaining professional. Construct the ideal Optimizing Online Stores Email Campaign Performance KPI Dashboard Graphics PDF that effortlessly grabs the attention of your audience Begin now and be certain to wow your customers.

Diversity Metric Ppt PowerPoint Presentation Complete Deck
Share a great deal of information on the topic by deploying this Diversity Metric Ppt PowerPoint Presentation Complete Deck. Support your ideas and thought process with this prefabricated set. It includes a set of twenty slides, all fully modifiable and editable. Each slide can be restructured and induced with the information and content of your choice. You can add or remove large content boxes as well, to make this PPT slideshow more personalized. Its high-quality graphics and visuals help in presenting a well-coordinated pitch. This PPT template is also a resourceful tool to take visual cues from and implement the best ideas to help your business grow and expand. The main attraction of this well-formulated deck is that everything is editable, giving you the freedom to adjust it to your liking and choice. Changes can be made in the background and theme as well to deliver an outstanding pitch. Therefore, click on the download button now to gain full access to this multifunctional set.
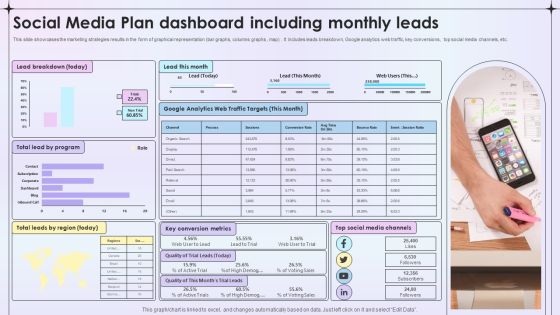
Social Media Plan Dashboard Including Monthly Leads Ppt File Slides PDF
This slide showcases the marketing strategies results in the form of graphical representation bar graphs, columns graphs , map. It includes leads breakdown, Google analytics web traffic, key conversions , top social media channels, etc. Showcasing this set of slides titled Social Media Plan Dashboard Including Monthly Leads Ppt File Slides PDF. The topics addressed in these templates are Lead Breakdown, Key Conversion Metrics, Social Media Channels. All the content presented in this PPT design is completely editable. Download it and make adjustments in color, background, font etc. as per your unique business setting.

Product Marketing For Generating Product Marketing Dashboard With Sales Trend Designs PDF
This graph or chart is linked to excel, and changes automatically based on data. Just left click on it and select Edit Data. From laying roadmaps to briefing everything in detail, our templates are perfect for you. You can set the stage with your presentation slides. All you have to do is download these easy-to-edit and customizable templates. Product Marketing For Generating Product Marketing Dashboard With Sales Trend Designs PDF will help you deliver an outstanding performance that everyone would remember and praise you for. Do download this presentation today.

Case Administration Dashboard With Resolved Cases Graphics PDF
This slide shows dashboard which can be used to monitor the status of case management solved in the organizations. It includes key performance indicators such as active cases by priority, by subject, by age, by branch, etc. Pitch your topic with ease and precision using this Case Administration Dashboard With Resolved Cases Graphics PDF. This layout presents information on Case Administration Dashboard, Resolved Cases. It is also available for immediate download and adjustment. So, changes can be made in the color, design, graphics or any other component to create a unique layout.

Energy Efficiency Dashboard To Track Campaign Effectiveness Pictures PDF
This slide consists of a dashboard which presents an energy saving dashboard which can be used to track effectiveness of energy saving program. The key performance indicators relate to energy sources, energy consumption by sectors, energy consumption by sectors etc. Pitch your topic with ease and precision using this Energy Efficiency Dashboard To Track Campaign Effectiveness Pictures PDF. This layout presents information on Energy Sources, Energy Usage, Trend Analysis. It is also available for immediate download and adjustment. So, changes can be made in the color, design, graphics or any other component to create a unique layout.

Dashboard For Tracking Green Financing Activities Themes PDF
This slide presents a finance dashboard to track the progress of sustainability activities based on finance allocations. The key performing indicators are overall progress, energy usage by month, budget allocation and application etc. Showcasing this set of slides titled Dashboard For Tracking Green Financing Activities Themes PDF. The topics addressed in these templates are Activities, Application, Dashboard. All the content presented in this PPT design is completely editable. Download it and make adjustments in color, background, font etc. as per your unique business setting.

Web 3 0 Blockchain Based P2E Mobile Game Sector Report Promotional Plan Dashboard For Measuring Unique Visitors Topics PDF
The following slide displays a detailed dashboard to measure website performance of P2E web3 based NFT game. It highlights essential elements such as session frequency, visit frequency, content origin etc. Do you have to make sure that everyone on your team knows about any specific topic. I yes, then you should give Web 3 0 Blockchain Based P2E Mobile Game Sector Report Promotional Plan Dashboard For Measuring Unique Visitors Information PDF a try. Our experts have put a lot of knowledge and effort into creating this impeccable Web 3 0 Blockchain Based P2E Mobile Game Sector Report Promotional Plan Dashboard For Measuring Unique Visitors Topics PDF. You can use this template for your upcoming presentations, as the slides are perfect to represent even the tiniest detail. You can download these templates from the Slidegeeks website and these are easy to edit. So grab these today.

Business Strategy And Promotional Approach For Multiplayer Oriented Mobile Game Dashboard For Measuring P2E Web 3 Game Pictures PDF
The following slide displays a detailed dashboard to measure website performance of P2E web3 based NFT game. It highlights essential elements such as lead per opportunity, new opportunities, income by in-game purchase Here you can discover an assortment of the finest PowerPoint and Google Slides templates. With these templates, you can create presentations for a variety of purposes while simultaneously providing your audience with an eye catching visual experience. Download Business Strategy And Promotional Approach For Multiplayer Oriented Mobile Game Dashboard For Measuring P2E Web 3 Game Pictures PDF to deliver an impeccable presentation. These templates will make your job of preparing presentations much quicker, yet still, maintain a high level of quality. Slidegeeks has experienced researchers who prepare these templates and write high quality content for you. Later on, you can personalize the content by editing the Business Strategy And Promotional Approach For Multiplayer Oriented Mobile Game Dashboard For Measuring P2E Web 3 Game Pictures PDF.

Dashboard To Track Ecommerce Website Performance Summary PDF
This slide showcases dashboard that can help organization to track the performance of ecommerce website. Its key components are users by region, traffic sources, audience metrics over time, mobile users etc. Do you know about Slidesgeeks Dashboard To Track Ecommerce Website Performance Summary PDF These are perfect for delivering any kind od presentation. Using it, create PowerPoint presentations that communicate your ideas and engage audiences. Save time and effort by using our pre designed presentation templates that are perfect for a wide range of topic. Our vast selection of designs covers a range of styles, from creative to business, and are all highly customizable and easy to edit. Download as a PowerPoint template or use them as Google Slides themes.

Operational Dashboard Powerpoint Images
This is a operational dashboard powerpoint images. This is a four stage process. The stages in this process are cash and equivalents, revenue and expenses actual and forecast, store sales vs budget, expenses actual budget forecast.

Web Based Balanced Scorecard Ppt PowerPoint Presentation Layouts Slide Download Cpb
Presenting this set of slides with name web based balanced scorecard ppt powerpoint presentation layouts slide download cpb. This is an editable Powerpoint five stages graphic that deals with topics like web based balanced scorecard to help convey your message better graphically. This product is a premium product available for immediate download and is 100 percent editable in Powerpoint. Download this now and use it in your presentations to impress your audience.

Data Quality Scorecard Examples Ppt PowerPoint Presentation Professional Clipart Images Cpb
Presenting this set of slides with name data quality scorecard examples ppt powerpoint presentation professional clipart images cpb. This is an editable Powerpoint eight stages graphic that deals with topics like data quality scorecard examples to help convey your message better graphically. This product is a premium product available for immediate download and is 100 percent editable in Powerpoint. Download this now and use it in your presentations to impress your audience.

Balanced Scorecard Project Portfolio Management Ppt PowerPoint Presentation Outline Diagrams Cpb Pdf
Presenting this set of slides with name balanced scorecard project portfolio management ppt powerpoint presentation outline diagrams cpb pdf. This is an editable Powerpoint three stages graphic that deals with topics like balanced scorecard project portfolio management to help convey your message better graphically. This product is a premium product available for immediate download and is 100 percent editable in Powerpoint. Download this now and use it in your presentations to impress your audience.
Human Resources Balanced Scorecard Ppt PowerPoint Presentation Icon Summary Cpb Pdf
Presenting this set of slides with name human resources balanced scorecard ppt powerpoint presentation icon summary cpb pdf. This is an editable Powerpoint three stages graphic that deals with topics like human resources balanced scorecard to help convey your message better graphically. This product is a premium product available for immediate download and is 100 percent editable in Powerpoint. Download this now and use it in your presentations to impress your audience.

Vendor Evaluation Scorecard Template Ppt PowerPoint Presentation Ideas Objects Cpb Pdf
Presenting this set of slides with name vendor evaluation scorecard template ppt powerpoint presentation ideas objects cpb pdf. This is an editable Powerpoint eight stages graphic that deals with topics like vendor evaluation scorecard template to help convey your message better graphically. This product is a premium product available for immediate download and is 100 percent editable in Powerpoint. Download this now and use it in your presentations to impress your audience.

Collaborative Balanced Scorecard Ppt PowerPoint Presentation Infographic Template Example 2015 Cpb Pdf
Presenting this set of slides with name collaborative balanced scorecard ppt powerpoint presentation infographic template example 2015 cpb pdf. This is an editable Powerpoint four stages graphic that deals with topics like collaborative balanced scorecard to help convey your message better graphically. This product is a premium product available for immediate download and is 100 percent editable in Powerpoint. Download this now and use it in your presentations to impress your audience.

Other Ways To Measure Brand Equity Guide To Brand Value Information PDF
Purpose of this slide is to address various approaches of measuring brand equity. Ways covered in the slide are brand awareness, financial metrics, preference metrics and competitive metrics.The best PPT templates are a great way to save time, energy, and resources. Slidegeeks have 100precent editable powerpoint slides making them incredibly versatile. With these quality presentation templates, you can create a captivating and memorable presentation by combining visually appealing slides and effectively communicating your message. Download Other Ways To Measure Brand Equity Guide To Brand Value Information PDF from Slidegeeks and deliver a wonderful presentation.

Other Ways To Measure Brand Equity Brand Value Estimation Guide Rules PDF
Purpose of this slide is to address various approaches of measuring brand equity. Ways covered in the slide are brand awareness, financial metrics, preference metrics and competitive metrics.Slidegeeks has constructed Other Ways To Measure Brand Equity Brand Value Estimation Guide Rules PDF after conducting extensive research and examination. These presentation templates are constantly being generated and modified based on user preferences and critiques from editors. Here, you will find the most attractive templates for a range of purposes while taking into account ratings and remarks from users regarding the content. This is an excellent jumping-off point to explore our content and will give new users an insight into our top-notch PowerPoint Templates.

Approaches To Measure Brand Equity Development On Customer Model Diagrams PDF
The following slide showcase the major approaches to measuring the brand equity model which includes the brand evaluation, brand strength, output and competitive metrics. Presenting Approaches To Measure Brand Equity Development On Customer Model Diagrams PDF to dispense important information. This template comprises four stages. It also presents valuable insights into the topics including Brand Evaluation, Brand Strength, Competitive Metrics, Output Metrics. This is a completely customizable PowerPoint theme that can be put to use immediately. So, download it and address the topic impactfully.
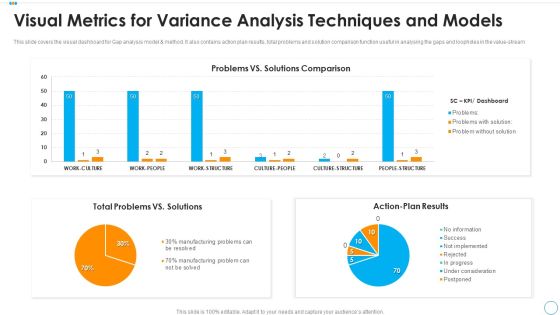
Visual Metrics For Variance Analysis Techniques And Models Mockup PDF
This slide covers the visual dashboard for Gap analysis model and method. It also contains action plan results, total problems and solution comparison function useful in analysing the gaps and loopholes in the value stream. Showcasing this set of slides titled visual metrics for variance analysis techniques and models mockup pdf. The topics addressed in these templates are total problems vs solutions, action plan results, problems vs solutions comparison. All the content presented in this PPT design is completely editable. Download it and make adjustments in color, background, font etc. as per your unique business setting.
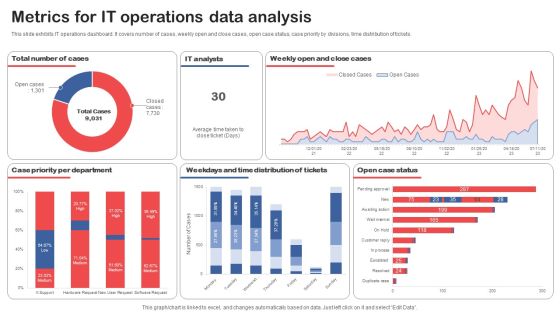
Metrics For IT Operations Data Analysis Topics PDF
This slide exhibits IT operations dashboard. It covers number of cases, weekly open and close cases, open case status, case priority by divisions, time distribution of tickets. Pitch your topic with ease and precision using this Metrics For IT Operations Data Analysis Topics PDF. This layout presents information on Case Priority Per Department, Distribution Of Tickets, Open Case Status. It is also available for immediate download and adjustment. So, changes can be made in the color, design, graphics or any other component to create a unique layout.

Change Metrics Showcasing Time Consumption Analysis By Status Clipart PDF
This slide showcases dashboard to analyze and monitor overall time consumption by various change cases in the organization. It includes elements such as escalated, solution proposed, waiting for customer approval, etc. Showcasing this set of slides titled Change Metrics Showcasing Time Consumption Analysis By Status Clipart PDF The topics addressed in these templates are Consuming, Status Analysis, Record Count. All the content presented in this PPT design is completely editable. Download it and make adjustments in color, background, font etc. as per your unique business setting.

Business Diagram Measuring Risk PowerPoint Ppt Presentation
Deliver The Right Dose With Our Business Diagram Measuring Risk PowerPoint PPT Presentation PowerPoint Templates. Your Ideas Will Get The Correct Illumination. Your Abilities Have Been Lying Dormant. Awaken Them With Our Business PowerPoint Templates.

Business Framework Build Measure Learn PowerPoint Presentation
This business power point diagram slide has been designed with build measure learn. This is used in lean manufacturing system where you have to show continuous deployment and minimal viable production. Use this PPT slide in your production related presentations.

Business Framework Demand Measurement PowerPoint Presentation
This image slide displays demand measurement business framework. Use this image slide to express views on segmentation in marketing. You may change color size and orientation of any icon to your liking. Create professional presentations by using this image slide.
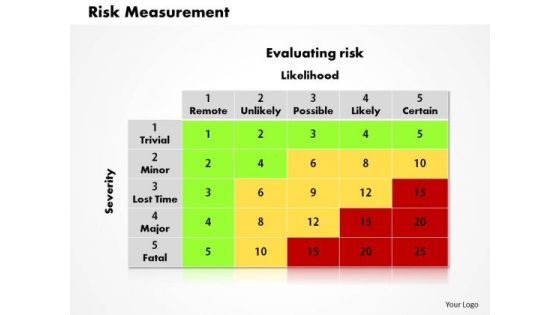
Business Framework Risk Measurement PowerPoint Presentation
The above slide has framework of risk measurement. Use this diagram for giving a clear message in a structured manner. This template helps you to grab the attention of your listener.
Measuring Brand Awareness Powerpoint Slides Show
This is a measuring brand awareness powerpoint slides show. This is a ten stage process. The stages in this process are credibility, innovation, price negotiation, loyalty, high profits, brand equity, regulatory under standing.

Measure Marketing Effectiveness Template Ppt Slides
This is a measure marketing effectiveness template ppt slides. This is a four stage process. The stages in this process are monitor value, define markets, deliver value, determine value proposition.

Net Promoter Score Measurement Ppt Powerpoint Idea
This is a net promoter score measurement ppt powerpoint idea. This is a three stage process. The stages in this process are promoters, passives, detractors, promoters, net promoter score.

Social Media Measurement Framework Powerpoint Slides
This is a social media measurement framework powerpoint slides. This is a six stage process. The stages in this process are innovation, brand health, customer experience, marketing optimization, business goal, revenue generation.\n\n\n\n\n\n
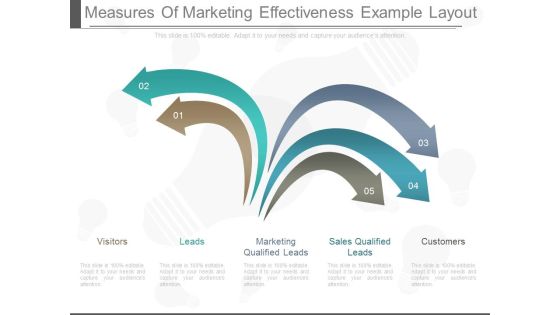
Measures Of Marketing Effectiveness Example Layout
This is a measures of marketing effectiveness example layout. This is a five stage process. The stages in this process are visitors, leads, marketing qualified leads, sales qualified leads, customers.
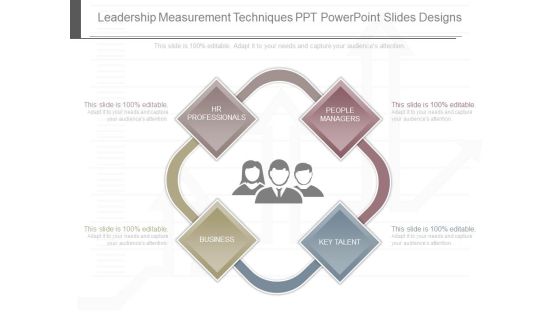
Leadership Measurement Techniques Ppt Powerpoint Slides Designs
This is a leadership measurement techniques ppt powerpoint slides designs. This is a four stage process. The stages in this process are hr professionals, people managers, key talent, business.

Measuring Brand Loyalty Diagram Powerpoint Ideas
This is a measuring brand loyalty diagram powerpoint ideas. This is a five stage process. The stages in this process are customer retention, overall satisfaction, perceived value for money, emotional commitment to brand, intention to repurchase, intention to recommend.
 Home
Home