Kpis

Cash Flow Statement Kpis Tabular Form Ppt PowerPoint Presentation Model Graphic Tips
This is a cash flow statement kpis tabular form ppt powerpoint presentation model graphic tips. This is a four stage process. The stages in this process are operations, investing activities, net increase in cash, financing activities.
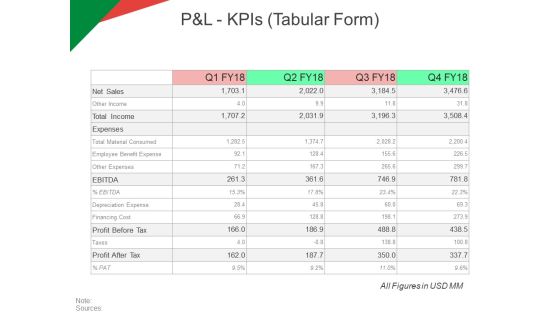
P And L Kpis Tabular Form Ppt PowerPoint Presentation Model Ideas
This is a p and l kpis tabular form ppt powerpoint presentation model ideas. This is a four stage process. The stages in this process are revenue, operating profit, cogs, net profit.

Balance Sheet Kpis Tabular Form Template 2 Ppt PowerPoint Presentation Inspiration Portfolio
This is a balance sheet kpis tabular form template 2 ppt powerpoint presentation inspiration portfolio. This is a four stage process. The stages in this process are business, management, compere, strategy, table.

Cash Flow Statement Kpis Tabular Form Ppt PowerPoint Presentation Styles Design Inspiration
This is a cash flow statement kpis tabular form ppt powerpoint presentation styles design inspiration. This is a four stage process. The stages in this process are finance, analysis, management, business, marketing.

Balance Sheet Kpis Template 1 Ppt PowerPoint Presentation Pictures Example Introduction
This is a balance sheet kpis template 1 ppt powerpoint presentation pictures example introduction. This is a four stage process. The stages in this process are total fixed assets, non current investments, inventories, trade receivables.

Balance Sheet Kpis Template 2 Ppt PowerPoint Presentation Portfolio Graphics Template
This is a balance sheet kpis template 2 ppt powerpoint presentation portfolio graphics template. This is a four stage process. The stages in this process are shareholders equity, trade payables, other current liabilities, current liabilities, total liabilities.

Cash Flow Statement Kpis Template 2 Ppt PowerPoint Presentation Summary Guidelines
This is a cash flow statement kpis template 2 ppt powerpoint presentation summary guidelines. This is a four stage process. The stages in this process are operations, investing activities, net increase in cash, financing activities.
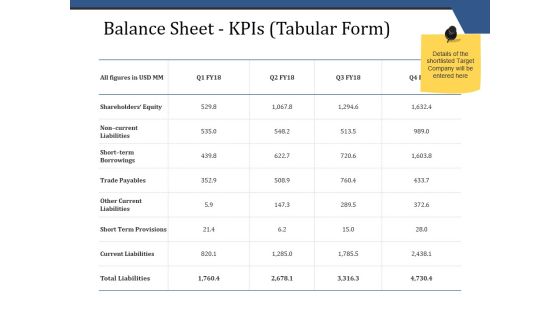
Balance Sheet Kpis Tabular Form Template 1 Ppt PowerPoint Presentation Infographics Picture
This is a balance sheet kpis tabular form template 1 ppt powerpoint presentation infographics picture. This is a four stage process. The stages in this process are business, finance, analysis, investment, strategy.
Balance Sheet Kpis Tabular Form Template 2 Ppt PowerPoint Presentation Icon Clipart
This is a balance sheet kpis tabular form template 2 ppt powerpoint presentation icon clipart. This is a four stage process. The stages in this process are business, finance, analysis, investment, strategy.

Cash Flow Statement Kpis Tabular Form Ppt PowerPoint Presentation Inspiration Master Slide
This is a cash flow statement kpis tabular form ppt powerpoint presentation inspiration master slide. This is a four stage process. The stages in this process are operations, financing activities, investing activities, net increase in cash.

Balance Sheet Kpis Tabular Form Template 1 Ppt PowerPoint Presentation Outline Pictures
This is a balance sheet kpis tabular form template 1 ppt powerpoint presentation outline pictures. This is a five stage process. The stages in this process are compere, business, marketing, table, strategy.
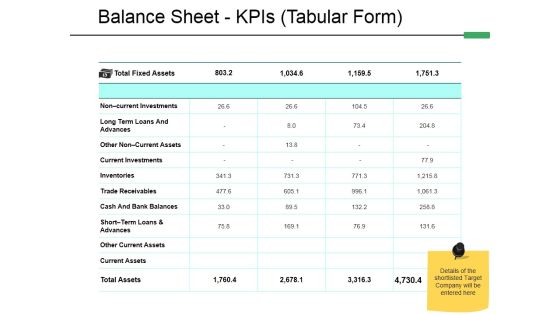
Balance Sheet Kpis Tabular Form Template 2 Ppt PowerPoint Presentation Styles Model
This is a balance sheet kpis tabular form template 2 ppt powerpoint presentation styles model. This is a four stage process. The stages in this process are advances, inventories, trade receivables, current investments, current assets, other current assets.
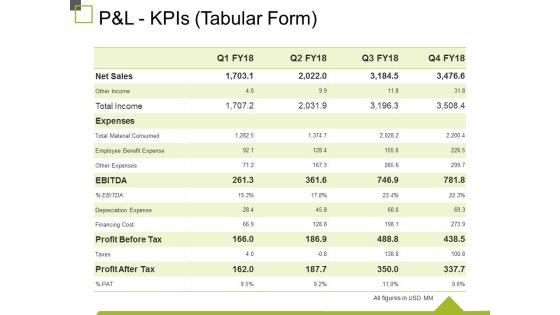
P And L Kpis Tabular Form Ppt PowerPoint Presentation Ideas Infographics
This is a p and l kpis tabular form ppt powerpoint presentation ideas infographics. This is a four stage process. The stages in this process are other income, expenses, other expenses, depreciation expense, financing cost.

Cash Flow Statement Kpis Template 1 Ppt PowerPoint Presentation Infographic Template Master Slide
This is a cash flow statement kpis template 1 ppt powerpoint presentation infographic template master slide. This is a four stage process. The stages in this process are business, table, management, analysis, success.

Cash Flow Statement Kpis Template 2 Ppt PowerPoint Presentation Layouts Visuals
This is a cash flow statement kpis template 2 ppt powerpoint presentation layouts visuals. This is a four stage process. The stages in this process are operations, financial activities, investing activities, net increase in cash.

P And L Kpis Template 1 Ppt PowerPoint Presentation Portfolio Visual Aids
This is a p and l kpis template 1 ppt powerpoint presentation portfolio visual aids. This is a four stage process. The stages in this process are business, table, management, analysis, strategy.
P And L Kpis Template 2 Ppt PowerPoint Presentation Summary Icon
This is a p and l kpis template 2 ppt powerpoint presentation summary icon. This is a four stage process. The stages in this process are revenue, cogs, operating profit, net profit.

Cash Flow Statement Kpis Tabular Form Ppt PowerPoint Presentation Summary Elements
This is a cash flow statement kpis tabular form ppt powerpoint presentation summary elements. This is a four stage process. The stages in this process are net increase cash, financial activities, operations, investing activities.

Cash Flow Statement Kpis Template Ppt PowerPoint Presentation Ideas Visual Aids
This is a cash flow statement kpis template ppt powerpoint presentation ideas visual aids. This is a four stage process. The stages in this process are operations, financing activities, investing activities, net increase in cash.
P And L Kpis Template 1 Ppt PowerPoint Presentation Icon Graphics Download
This is a p and l kpis template 1 ppt powerpoint presentation icon graphics download. This is a four stage process. The stages in this process are net sales, total income, expenses, financing cost, profit after tax.

P And L Kpis Template 2 Ppt PowerPoint Presentation Inspiration Grid
This is a p and l kpis template 2 ppt powerpoint presentation inspiration grid. This is a four stage process. The stages in this process are revenue, cogs, operating profit, net profit.

Balance Sheet Kpis Template 1 Ppt PowerPoint Presentation Professional Background Images
This is a balance sheet kpis template 1 ppt powerpoint presentation professional background images. This is a four stage process. The stages in this process are shareholders equity, trade payable, short term provisions, current liabilities, total liabilities.

Balance Sheet Kpis Template 2 Ppt PowerPoint Presentation Infographic Template Background Images
This is a balance sheet kpis template 2 ppt powerpoint presentation infographic template background images. This is a four stage process. The stages in this process are total fixed assets, current assets, total assets, inventories, current investments.

Cash Flow Statement Kpis Template 2 Ppt PowerPoint Presentation Portfolio Template
This is a cash flow statement kpis template 2 ppt powerpoint presentation portfolio template. This is a four stage process. The stages in this process are operations, financing activities, investing activities, net increase in cash.

Balance Sheet Kpis Template 1 Ppt PowerPoint Presentation Infographic Template Example 2015
This is a balance sheet kpis template 1 ppt powerpoint presentation infographic template example 2015. This is a four stage process. The stages in this process are balance sheet, finance, marketing, strategy, analysis.

Balance Sheet Kpis Template 2 Ppt PowerPoint Presentation Outline Graphics Pictures
This is a balance sheet kpis template 2 ppt powerpoint presentation outline graphics pictures. This is a four stage process. The stages in this process are balance sheet, finance, marketing, strategy, analysis.

Balance Sheet Kpis Template 3 Ppt PowerPoint Presentation Infographic Template Demonstration
This is a balance sheet kpis template 3 ppt powerpoint presentation infographic template demonstration. This is a four stage process. The stages in this process are balance sheet, finance, marketing, strategy, analysis.

Cash Flow Statement Kpis Template 1 Ppt PowerPoint Presentation Infographics Summary
This is a cash flow statement kpis template 1 ppt powerpoint presentation infographics summary. This is a four stage process. The stages in this process are business, management, table, strategy, analysis.

Cash Flow Statement Kpis Template 2 Ppt PowerPoint Presentation Styles Ideas
This is a cash flow statement kpis template 2 ppt powerpoint presentation styles ideas. This is a four stage process. The stages in this process are cash flow, finance, marketing, strategy, business.
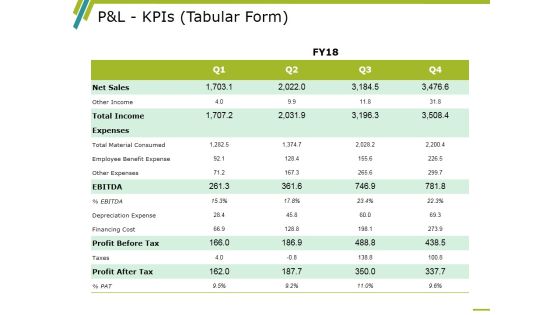
P And L Kpis Template 1 Ppt PowerPoint Presentation Infographics Professional
This is a p and l kpis template 1 ppt powerpoint presentation infographics professional. This is a four stage process. The stages in this process are Other Income, Total Income, Ebitda, Profit Before Tax, Profit After Tax.
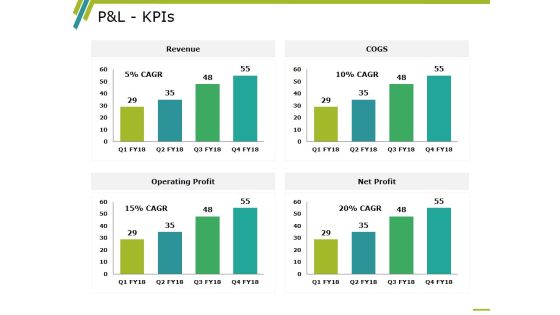
P And L Kpis Template 2 Ppt PowerPoint Presentation Professional Information
This is a p and l kpis template 2 ppt powerpoint presentation professional information. This is a four stage process. The stages in this process are revenue, operating profit, cogs, net profit, business.
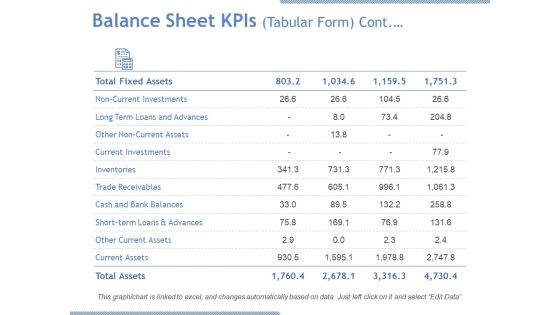
Balance Sheet Kpis Tabular Form Continuous Ppt PowerPoint Presentation Model Graphic Images
This is a balance sheet kpis tabular form continuous ppt powerpoint presentation model graphic images. This is a four stage process. The stages in this process are current investments, inventories, current assets, total assets, trade receivables.
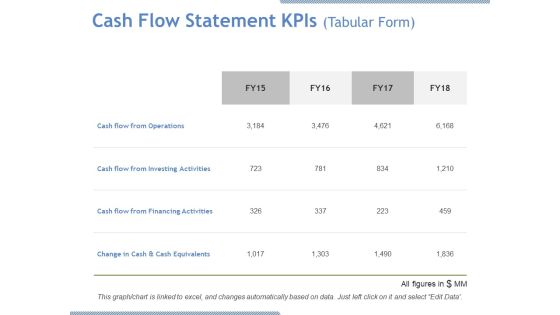
Cash Flow Statement Kpis Tabular Form Ppt PowerPoint Presentation Outline Slides
This is a cash flow statement kpis tabular form ppt powerpoint presentation outline slides. This is a four stage process. The stages in this process are cash flow from operations, cash flow from financing activities.

P And L Kpis Tabular Form Ppt PowerPoint Presentation Outline Aids
This is a p and l kpis tabular form ppt powerpoint presentation outline aids. This is a four stage process. The stages in this process are net sales, other income, total income, expenses, taxes.

Balance Sheet Kpis Template 1 Ppt PowerPoint Presentation Professional Graphics Download
This is a balance sheet kpis template 1 ppt powerpoint presentation professional graphics download. This is a four stage process. The stages in this process are current assets, current liabilities, total assets, total liabilities.

Balance Sheet Kpis Tabular Form Template 1 Ppt PowerPoint Presentation Pictures Tips
This is a balance sheet kpis tabular form template 1 ppt powerpoint presentation pictures tips. This is a four stage process. The stages in this process are noncurrent liabilities, short term borrowings, trade payables, other current liabilities, short term provisions.

Balance Sheet Kpis Tabular Form Template 2 Ppt PowerPoint Presentation Summary Structure
This is a balance sheet kpis tabular form template 2 ppt powerpoint presentation summary structure. This is a four stage process. The stages in this process are net sales, expenses, ebitda, profit after tax, finecing cost.

Cash Flow Statement - Kpis Ppt PowerPoint Presentation Layouts Graphics Template
This is a cash flow statement - kpis ppt powerpoint presentation layouts graphics template. This is a four stage process. The stages in this process are operations, financing activities, investing activities, net increase in cash.
P And L Kpis Template 1 Ppt PowerPoint Presentation Icon Background Image
This is a p and l kpis template 1 ppt powerpoint presentation icon background image. This is a four stage process. The stages in this process are business, management, analysis, table, strategy.

Balance Sheet Kpis Tabular Form Cont Ppt PowerPoint Presentation Model Graphics Tutorials
This is a balance sheet kpis tabular form cont ppt powerpoint presentation model graphics tutorials. This is a four stage process. The stages in this process are long term loans and advances, current investments, inventories, trade receivables.
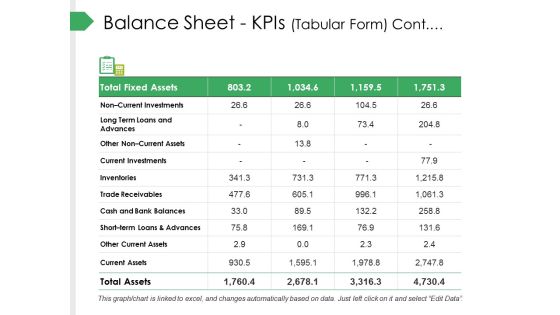
Balance Sheet Kpis Tabular Form Cont Ppt PowerPoint Presentation Summary Templates
This is a balance sheet kpis tabular form cont ppt powerpoint presentation summary templates. This is a four stage process. The stages in this process are current investments, inventories, trade receivables, cash and bank balances.
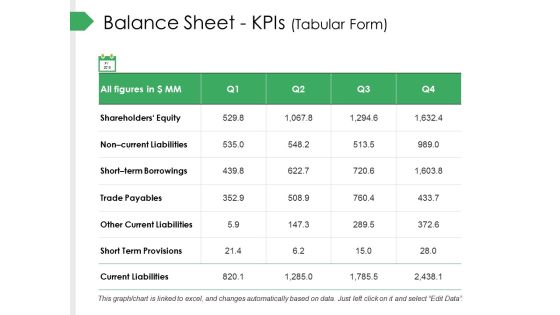
Balance Sheet Kpis Tabular Form Ppt PowerPoint Presentation Slides Designs Download
This is a balance sheet kpis tabular form ppt powerpoint presentation slides designs download. This is a four stage process. The stages in this process are trade payables, other current liabilities, short term provisions, current liabilities, short term borrowings.

P And L Kpis Tabular Form Ppt PowerPoint Presentation Pictures Gallery
This is a p and l kpis tabular form ppt powerpoint presentation pictures gallery. This is a four stage process. The stages in this process are business, marketing, graph, strategy, finance.
Warehouse Performance KPIS Inventory Accuracy Real Time Reporting Ppt PowerPoint Presentation Icon Maker
This is a warehouse performance kpis inventory accuracy real time reporting ppt powerpoint presentation icon maker. This is a five stage process. The stages in this process are supply chain management, order fulfilment.
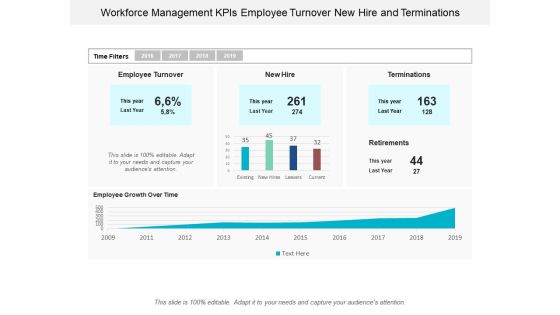
Workforce Management Kpis Employee Turnover New Hire And Terminations Ppt Powerpoint Presentation Portfolio Display
This is a workforce management kpis employee turnover new hire and terminations ppt powerpoint presentation portfolio display. This is a five stage process. The stages in this process are resource management, wealth management, capital management.
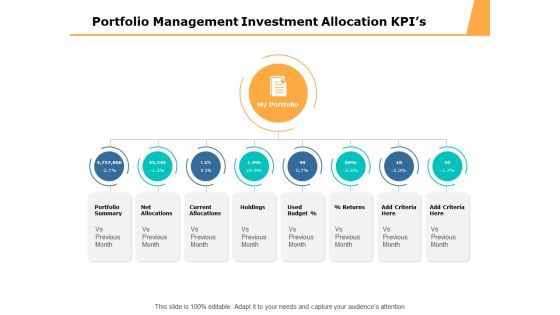
Portfolio Management Investment Allocation Kpis Ppt PowerPoint Presentation File Graphics Download
This is a portfolio management investment allocation kpis ppt powerpoint presentation file graphics download. This is a eight stage process. The stages in this process are business, management, marketing.
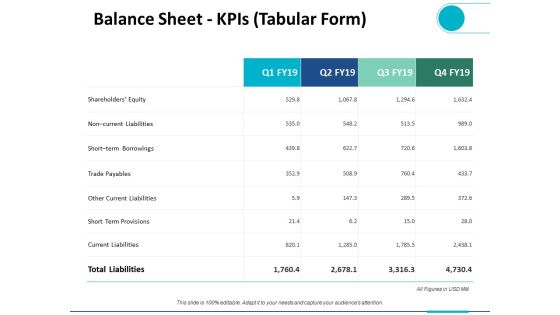
Balance Sheet Kpis Tabular Form Ppt PowerPoint Presentation Ideas Design Templates
This is a balance sheet kpis tabular form ppt powerpoint presentation ideas design templates. This is a four stage process. The stages in this process are finance, analysis, business, investment, marketing.

Cash Flow Statement Kpis Tabular Form Ppt PowerPoint Presentation Summary Infographic Template
This is a cash flow statement kpis tabular form ppt powerpoint presentation summary infographic template. This is a four stage process. The stages in this process are finance, analysis, business, investment, marketing.
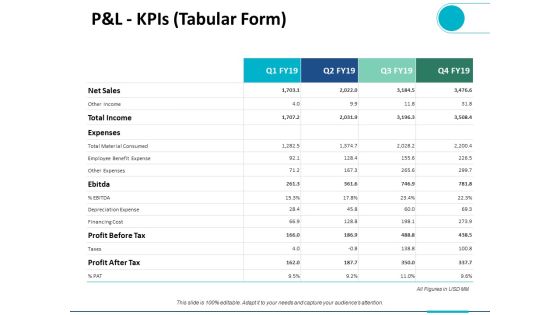
P And L Kpis Tabular Form Ppt PowerPoint Presentation Ideas Brochure
This is a p and l kpis tabular form ppt powerpoint presentation ideas brochure. This is a four stage process. The stages in this process are business, planning, strategy, marketing, management.
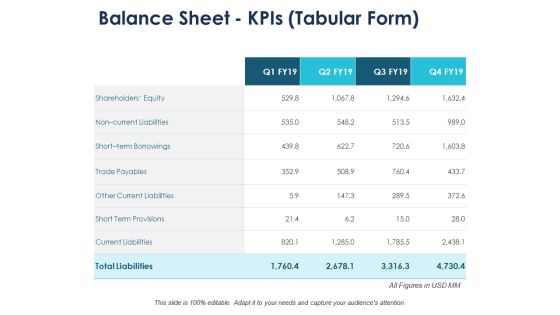
Balance Sheet Kpis Tabular Form Management Ppt PowerPoint Presentation Summary Pictures
This is a balance sheet kpis tabular form management ppt powerpoint presentation summary pictures. This is a four stage process. The stages in this process are compare, marketing, business, management, planning.

Cash Flow Statement Kpis Tabular Form Ppt PowerPoint Presentation Slides Themes
This is a cash flow statement kpis tabular form ppt powerpoint presentation slides themes. This is a four stage process. The stages in this process are finance, marketing, management, investment, analysis.

P And L Kpis Tabular Form Compare Ppt PowerPoint Presentation Gallery Maker
This is a p and l kpis tabular form compare ppt powerpoint presentation gallery maker. This is a four stage process. The stages in this process are compare, marketing, business, management, planning.
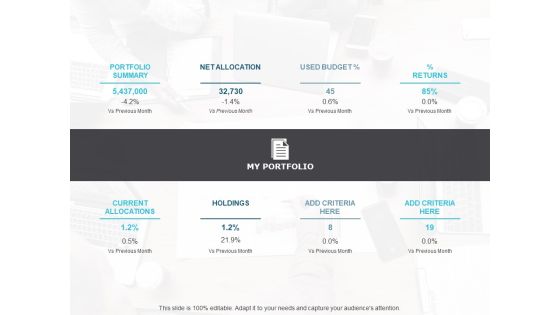
Portfolio Management Investment Allocation Kpis Ppt PowerPoint Presentation Infographic Template Templates
This is a portfolio management investment allocation kpis ppt powerpoint presentation infographic template templates. The topics discussed in this diagram are business, marketing, management. This is a completely editable PowerPoint presentation, and is available for immediate download.

Kpis To Effectively Track Mobile Seo Performance Mobile Search Engine Optimization Guide Infographics PDF
The purpose of this slide is to outline various kpis through which organization can evaluate the mobile search engine optimization SEO performance. The key kpis are organic clicks, pages per session, bounce rate, page speed, crawl errors and backlinks. Find highly impressive Kpis To Effectively Track Mobile Seo Performance Mobile Search Engine Optimization Guide Infographics PDF on Slidegeeks to deliver a meaningful presentation. You can save an ample amount of time using these presentation templates. No need to worry to prepare everything from scratch because Slidegeeks experts have already done a huge research and work for you. You need to download Kpis To Effectively Track Mobile Seo Performance Mobile Search Engine Optimization Guide Infographics PDF for your upcoming presentation. All the presentation templates are 100 precent editable and you can change the color and personalize the content accordingly. Download now.

Redefining IT Solutions Delivery In A Post Pandemic Kpis For Human Resource Service Delivery Summary PDF
This slide depicts the KPIs for human resource service delivery with the help of AI and how some of these KPIs will be analyzed automatically through AI. Crafting an eye-catching presentation has never been more straightforward. Let your presentation shine with this tasteful yet straightforward Redefining IT Solutions Delivery In A Post Pandemic Kpis For Human Resource Service Delivery Summary PDF template. It offers a minimalistic and classy look that is great for making a statement. The colors have been employed intelligently to add a bit of playfulness while still remaining professional. Construct the ideal Redefining IT Solutions Delivery In A Post Pandemic Kpis For Human Resource Service Delivery Summary PDF that effortlessly grabs the attention of your audience. Begin now and be certain to wow your customers.

Strategy To Enhance Supply Chain Operations Kpis Affected Post Implementation Of Effective Logistics Strategies Diagrams PDF
This slide covers impact on various performance indicators after implementing logistics strategies. It involves KPIs such as order accuracy rate, perfect order rate, on time delivery and average cycle time. Presenting this PowerPoint presentation, titled Strategy To Enhance Supply Chain Operations Kpis Affected Post Implementation Of Effective Logistics Strategies Diagrams PDF, with topics curated by our researchers after extensive research. This editable presentation is available for immediate download and provides attractive features when used. Download now and captivate your audience. Presenting this Strategy To Enhance Supply Chain Operations Kpis Affected Post Implementation Of Effective Logistics Strategies Diagrams PDF. Our researchers have carefully researched and created these slides with all aspects taken into consideration. This is a completely customizable Strategy To Enhance Supply Chain Operations Kpis Affected Post Implementation Of Effective Logistics Strategies Diagrams PDF that is available for immediate downloading. Download now and make an impact on your audience. Highlight the attractive features available with our PPTs.

Advertising Campaign Optimization Process Kpis To Track Success Of Content Marketing Campaign Diagrams PDF
This slide showcases the expected increase in content marketing performance indicators after conducting effective campaigns. The KPIs covered are lead and revenue generation, engagement rate, page views and backlinks. Presenting this PowerPoint presentation, titled Advertising Campaign Optimization Process Kpis To Track Success Of Content Marketing Campaign Diagrams PDF, with topics curated by our researchers after extensive research. This editable presentation is available for immediate download and provides attractive features when used. Download now and captivate your audience. Presenting this Advertising Campaign Optimization Process Kpis To Track Success Of Content Marketing Campaign Diagrams PDF. Our researchers have carefully researched and created these slides with all aspects taken into consideration. This is a completely customizable Advertising Campaign Optimization Process Kpis To Track Success Of Content Marketing Campaign Diagrams PDF that is available for immediate downloading. Download now and make an impact on your audience. Highlight the attractive features available with our PPTs.

People Process Systems With Measures And Kpis Ppt PowerPoint Presentation Infographic Template Show PDF
Presenting people process systems with measures and kpis ppt powerpoint presentation infographic template show pdf to dispense important information. This template comprises three stages. It also presents valuable insights into the topics including people, process, systems, innovative education, embedded ownership, process mapping, measures and kpis, policy reviews, risk assessment, compliance dashboard, system remediation. This is a completely customizable PowerPoint theme that can be put to use immediately. So, download it and address the topic impactfully.
HR Recruitment Dashboard Kpis With Active Pipeline Ppt Icon Slide Portrait PDF
This slide showcases the recruitment dashboard metrics to know monthly hiring rate. It include KPIs like sources, decline reasons, active pipeline, recruitment funnel. Showcasing this set of slides titled HR Recruitment Dashboard Kpis With Active Pipeline Ppt Icon Slide Portrait PDF. The topics addressed in these templates are Recruitment Funnel, Monthly Metrics, Application Sources. All the content presented in this PPT design is completely editable. Download it and make adjustments in color, background, font etc. as per your unique business setting.

360 Degree Performance Review Sheet With Productivity And Leadership Kpis Graphics PDF
This slide covers 360 degree employee feedback form. It includes evaluation KPIs based on productivity, leadership, communication, and personal development. Showcasing this set of slides titled 360 Degree Performance Review Sheet With Productivity And Leadership Kpis Graphics PDF The topics addressed in these templates are Productivity, Communication, Personal Development All the content presented in this PPT design is completely editable. Download it and make adjustments in color, background, font etc. as per your unique business setting.

 Home
Home