Kpis

Logistics KPI Metrics And Analytics Dashboard Ppt Slides Images PDF
Persuade your audience using this Logistics KPI Metrics And Analytics Dashboard Ppt Slides Images PDF. This PPT design covers four stages, thus making it a great tool to use. It also caters to a variety of topics including Logistics KPI, Metrics And Analytics, Dashboard. Download this PPT design now to present a convincing pitch that not only emphasizes the topic but also showcases your presentation skills.
Education Dashboard For Tracking Gender Based Retention Metrics Template PDF
This slide illustrates student retention analysis dashboard. It include metrics based on gender, campus, ethnicity, and age group. Pitch your topic with ease and precision using this Education Dashboard For Tracking Gender Based Retention Metrics Template PDF. This layout presents information on Gender Based, Retention Rates, Age Group, Campus Wise. It is also available for immediate download and adjustment. So, changes can be made in the color, design, graphics or any other component to create a unique layout.

Education Dashboard With Absenteeism And Grade Details Metrics Diagrams PDF
This slide covers dashboard for tracking causes and rates of student absenteeism. It also include metrics such as average grades by subject and department. Pitch your topic with ease and precision using this Education Dashboard With Absenteeism And Grade Details Metrics Diagrams PDF. This layout presents information on Grade Department, English Proficiency, Medical Abs. It is also available for immediate download and adjustment. So, changes can be made in the color, design, graphics or any other component to create a unique layout.

Education Dashboard With Application Acceptance Metrics Clipart PDF
This slide covers dashboard for tracking registration applications. It include metrics such as admission per intake and program, applications received, under review applications, acceptance rate, students enrolled. Showcasing this set of slides titled Education Dashboard With Application Acceptance Metrics Clipart PDF. The topics addressed in these templates are Admissions Per, Intake And Program, Enrollment. All the content presented in this PPT design is completely editable. Download it and make adjustments in color, background, font etc. as per your unique business setting.
Training And Education Metrics Tracking Dashboard Guidelines PDF
This slide showcases dashboard for tracking training programs details. It include metrics such as training to invited percentage, unique trained, training man-days, total program names, etc. Pitch your topic with ease and precision using this Training And Education Metrics Tracking Dashboard Guidelines PDF. This layout presents information on Location Wise Training, Training Concerning Vertical, Tennessee. It is also available for immediate download and adjustment. So, changes can be made in the color, design, graphics or any other component to create a unique layout.

Portfolio Wealth Management Metric Dashboard For Portfolio Evaluation Graphics PDF
This slide represents metric dashboard for portfolio evaluation and performance monitoring. It covers project completion, top project risk, portfolio completion etc. Deliver an awe inspiring pitch with this creative Portfolio Wealth Management Metric Dashboard For Portfolio Evaluation Graphics PDF bundle. Topics like Projects Completed, Top Risks, Project Completion can be discussed with this completely editable template. It is available for immediate download depending on the needs and requirements of the user.
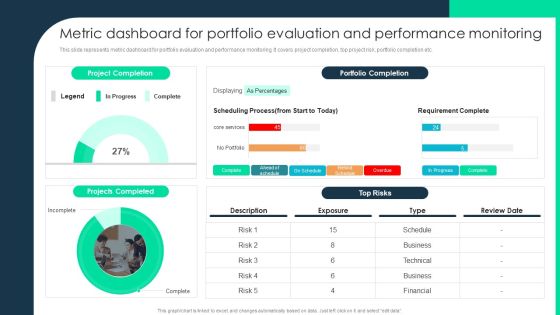
Metric Dashboard For Portfolio Evaluation And Performance Monitoring Themes PDF
This slide represents metric dashboard for portfolio evaluation and performance monitoring. It covers project completion, top project risk, portfolio completion etc. Deliver an awe inspiring pitch with this creative Metric Dashboard For Portfolio Evaluation And Performance Monitoring Themes PDF bundle. Topics like Projects Completed, Portfolio Completion, Requirement Complete can be discussed with this completely editable template. It is available for immediate download depending on the needs and requirements of the user.

Metric Dashboard For Portfolio Evaluation And Performance Monitoring Introduction PDF
This slide represents metric dashboard for portfolio evaluation and performance monitoring. It covers project completion, top project risk, portfolio completion etc. Deliver and pitch your topic in the best possible manner with this Metric Dashboard For Portfolio Evaluation And Performance Monitoring Introduction PDF. Use them to share invaluable insights on Portfolio Completion, Requirement Complete, Business and impress your audience. This template can be altered and modified as per your expectations. So, grab it now.

Asset Assessment Dashboard With ROI Metrics Topics PDF
This slide illustrates asset valuation dashboard with return on investment metrics. It provides information about internal rate of return, investment type, deal size, asset type, Pitch your topic with ease and precision using this Asset Assessment Dashboard With ROI Metrics Topics PDF. This layout presents information on Investment Amount, Asset Valuation, Internal Return. It is also available for immediate download and adjustment. So, changes can be made in the color, design, graphics or any other component to create a unique layout.
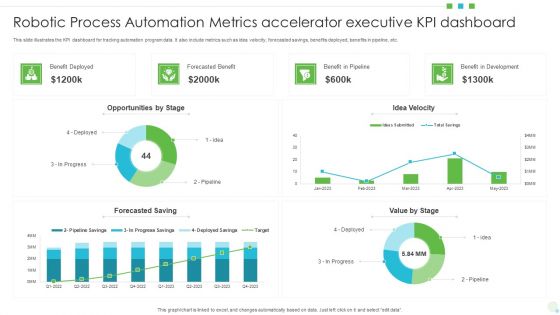
Robotic Process Automation Metrics Accelerator Executive KPI Dashboard Formats PDF
This slide illustrates the KPI dashboard for tracking automation program data. It also include metrics such as idea velocity, forecasted savings, benefits deployed, benefits in pipeline, etc. Showcasing this set of slides titled Robotic Process Automation Metrics Accelerator Executive KPI Dashboard Formats PDF. The topics addressed in these templates are Opportunities, Benefit In Development, Value. All the content presented in this PPT design is completely editable. Download it and make adjustments in color, background, font etc. as per your unique business setting.

Content Marketing Freelance Metrics Dashboard With Engagement Overview Demonstration PDF
Showcasing this set of slides titled Content Marketing Freelance Metrics Dashboard With Engagement Overview Demonstration PDF. The topics addressed in these templates are Metrics Summary, Engagement Overview. All the content presented in this PPT design is completely editable. Download it and make adjustments in color, background, font etc. as per your unique business setting.

Content Marketing Freelance Metrics Dashboard With Visitor Demographics Icons PDF
Showcasing this set of slides titled Content Marketing Freelance Metrics Dashboard With Visitor Demographics Icons PDF. The topics addressed in these templates are Content Level Metrics, Revenue Generated, Visitor Demographics. All the content presented in this PPT design is completely editable. Download it and make adjustments in color, background, font etc. as per your unique business setting.

Event Project Metrics Dashboard With Task Lengths Template PDF
This slide shows the event project management dashboard which focuses on task status such as complete, in progress, not started and overdue, workload on employees, lengths of tasks that covers creation of guest list, finalizing hires, planning event details, etc. Showcasing this set of slides titled Event Project Metrics Dashboard With Task Lengths Template PDF. The topics addressed in these templates are Event Project Metrics Dashboard, Cost. All the content presented in this PPT design is completely editable. Download it and make adjustments in color, background, font etc. as per your unique business setting.

Multi Project Metrics Dashboard With Overall Status Pictures PDF
This slide covers the dashboard that shows the status of project such as status of schedule, resource, quality with projects which are on schedule, in which issues has been occurred, that are critical, etc. That helps the project managers to understand the progress accurately. Pitch your topic with ease and precision using this Multi Project Metrics Dashboard With Overall Status Pictures PDF. This layout presents information on Multi Project, Metrics Dashboard. It is also available for immediate download and adjustment. So, changes can be made in the color, design, graphics or any other component to create a unique layout.

Project Metrics Dashboard Depicting Issue Description Rules PDF
This slide focuses on the project management dashboard which covers the name of the company, department, project manager, statuses with tally, priorities using pie graph describing not started, in progress and closed projects and describes the issues such as timing, milestones, etc. Showcasing this set of slides titled Project Metrics Dashboard Depicting Issue Description Rules PDF. The topics addressed in these templates are Project Metrics, Dashboard Depicting. All the content presented in this PPT design is completely editable. Download it and make adjustments in color, background, font etc. as per your unique business setting.
Project Metrics Dashboard Depicting Tracking System Inspiration PDF
This slide focuses on project management dashboard which covers the four spirit teams, iteration defects by priority with quarterly roadmap with legends such as high attention, low, none, normal and resolved immediately with time in iteration, etc. Pitch your topic with ease and precision using this Project Metrics Dashboard Depicting Tracking System Inspiration PDF. This layout presents information on Project Metrics, Dashboard Depicting, Tracking System. It is also available for immediate download and adjustment. So, changes can be made in the color, design, graphics or any other component to create a unique layout.
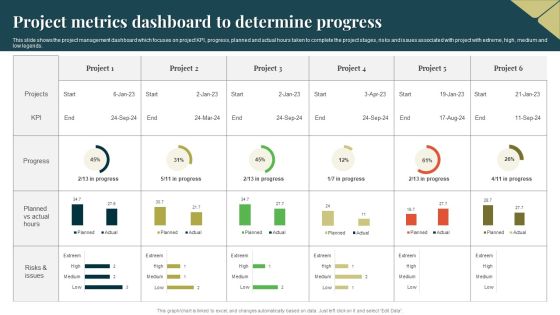
Project Metrics Dashboard To Determine Progress Guidelines PDF
This slide shows the project management dashboard which focuses on project KPI, progress, planned and actual hours taken to complete the project stages, risks and issues associated with project with extreme, high, medium and low legends. Showcasing this set of slides titled Project Metrics Dashboard To Determine Progress Guidelines PDF. The topics addressed in these templates are Project Metrics Dashboard, Determine Progress. All the content presented in this PPT design is completely editable. Download it and make adjustments in color, background, font etc. as per your unique business setting.

Project Metrics Dashboard With Active Issues Topics PDF
This slide focuses on the project management dashboard which shows the number of active emergency risks and issues, projects, current user count, splitting of project status by priority level, capacity percentage, top recent assignees with open, resolved and closed projects. Pitch your topic with ease and precision using this Project Metrics Dashboard With Active Issues Topics PDF. This layout presents information on Project Metrics, Dashboard With Active Issues. It is also available for immediate download and adjustment. So, changes can be made in the color, design, graphics or any other component to create a unique layout.

Project Metrics Dashboard With Monthly Workload Topics PDF
This slide shows the project management dashboard which covers the number of tasks completed in last one week, return on investment on overall project, milestones covered, performance of employees, tasks created, competed, work in progress, started, etc. Pitch your topic with ease and precision using this Project Metrics Dashboard With Monthly Workload Topics PDF. This layout presents information on Investment, Employee Performance, Project Metrics Dashboard. It is also available for immediate download and adjustment. So, changes can be made in the color, design, graphics or any other component to create a unique layout.
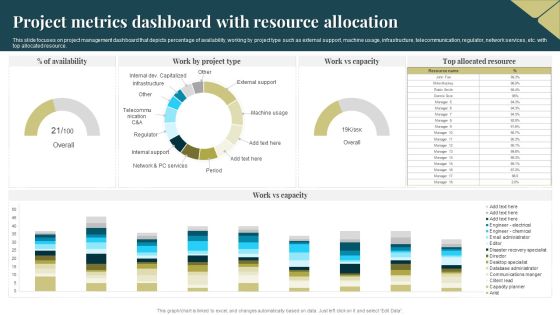
Project Metrics Dashboard With Resource Allocation Portrait PDF
This slide focuses on project management dashboard that depicts percentage of availability, working by project type such as external support, machine usage, infrastructure, telecommunication, regulator, network services, etc. with top allocated resource. Pitch your topic with ease and precision using this Project Metrics Dashboard With Resource Allocation Portrait PDF. This layout presents information on Project Metrics Dashboard, Resource Allocation. It is also available for immediate download and adjustment. So, changes can be made in the color, design, graphics or any other component to create a unique layout.
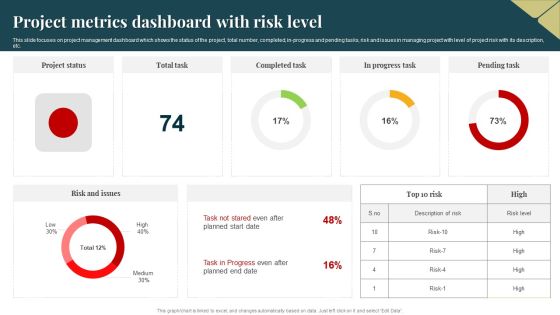
Project Metrics Dashboard With Risk Level Guidelines PDF
This slide focuses on project management dashboard which shows the status of the project, total number, completed, in progress and pending tasks, risk and issues in managing project with level of project risk with its description, etc. Pitch your topic with ease and precision using this Project Metrics Dashboard With Risk Level Guidelines PDF. This layout presents information on Project Metrics Dashboard, Risk Level. It is also available for immediate download and adjustment. So, changes can be made in the color, design, graphics or any other component to create a unique layout.
Project Metrics Dashboard With Task Summary Icons PDF
This slide shows the project management dashboard which covers the summary of different projects with time, cost, workload, tasks and progress with workload, created verses completed tasks, time spent on managing projects, etc. Showcasing this set of slides titled Project Metrics Dashboard With Task Summary Icons PDF. The topics addressed in these templates are Project Metrics Dashboard, Task Summary. All the content presented in this PPT design is completely editable. Download it and make adjustments in color, background, font etc. as per your unique business setting.

Project Metrics Dashboard With Team Requests Background PDF
This slide focuses on the project management dashboard which shows the creation of monthly number of requests, requests made by departmental teams, average completion time in days with the number of requests created on week days, etc. Pitch your topic with ease and precision using this Project Metrics Dashboard With Team Requests Background PDF. This layout presents information on Project Metrics Dashboard, Team Requests. It is also available for immediate download and adjustment. So, changes can be made in the color, design, graphics or any other component to create a unique layout.

Cyber Security Program Management Dashboard With KPI Metrics Ideas PDF
The following slide shows dashboard of CPM cyber security program management which helps to access high value assets and check threats , risks and policies on one platform. It includes current threat postures, risks, policy, service breakdown, assets by category and their control issues. Pitch your topic with ease and precision using this Cyber Security Program Management Dashboard With KPI Metrics Ideas PDF. This layout presents information on Cyber Security, Program Management Dashboard, Kpi Metrics. It is also available for immediate download and adjustment. So, changes can be made in the color, design, graphics or any other component to create a unique layout.
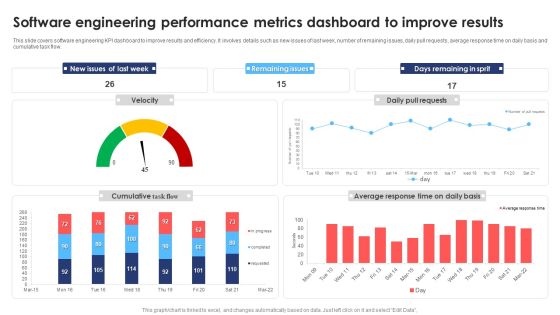
Software Engineering Performance Metrics Dashboard To Improve Results Infographics PDF
This slide covers software engineering KPI dashboard to improve results and efficiency. It involves details such as new issues of last week, number of remaining issues, daily pull requests, average response time on daily basis and cumulative task flow. Pitch your topic with ease and precision using this Software Engineering Performance Metrics Dashboard To Improve Results Infographics PDF. This layout presents information on Software Engineering Performance, Metrics Dashboard Improve Results. It is also available for immediate download and adjustment. So, changes can be made in the color, design, graphics or any other component to create a unique layout.
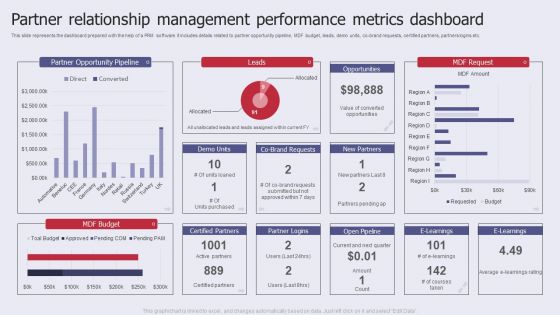
Partner Relationship Management Performance Metrics Dashboard Pictures PDF
This slide represents the dashboard prepared with the help of a PRM software. It includes details related to partner opportunity pipeline, MDF budget, leads, demo units, co brand requests, certified partners, partners logins etc. Showcasing this set of slides titled Partner Relationship Management Performance Metrics Dashboard Pictures PDF. The topics addressed in these templates are Partner Opportunity Pipeline, MDF Budget, Performance Metrics Dashboard. All the content presented in this PPT design is completely editable. Download it and make adjustments in color, background, font etc. as per your unique business setting.

Call Center Metrics And Metrics Dashboard With Tickets Raised Graphics PDF
Mentioned slide outlines a KPI dashboard showcasing the call center performance. The metrics covered in the slide are total dropped calls, waiting calls, total calls, team performance, recurring calls, tickets raised. Showcasing this set of slides titled Call Center Metrics And Metrics Dashboard With Tickets Raised Graphics PDF. The topics addressed in these templates are Call Management Data, Monthly Statics, Performance Records. All the content presented in this PPT design is completely editable. Download it and make adjustments in color, background, font etc. as per your unique business setting.
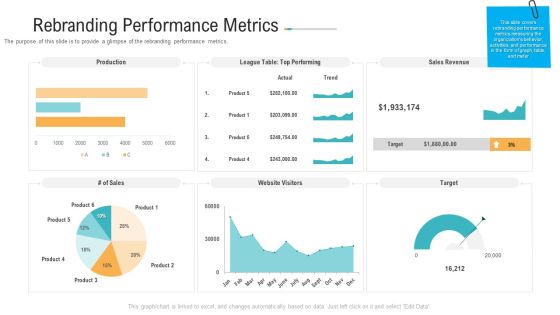
Rebranding Performance Metrics Ppt PowerPoint Presentation Pictures Shapes PDF
The purpose of this slide is to provide a glimpse of the sales projections and forecasting after rebranding.Deliver and pitch your topic in the best possible manner with this rebranding performance metrics ppt powerpoint presentation pictures shapes pdf. Use them to share invaluable insights on product, 2019 to 2021 and impress your audience. This template can be altered and modified as per your expectations. So, grab it now.
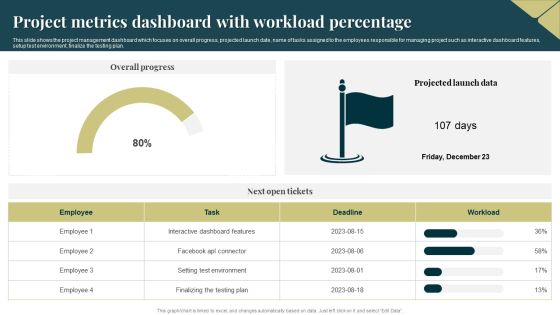
Project Metrics Dashboard With Workload Percentage Ideas PDF
This slide shows the project management dashboard which focuses on overall progress, projected launch date, name of tasks assigned to the employees responsible for managing project such as interactive dashboard features, setup test environment, finalize the testing plan. Showcasing this set of slides titled Project Metrics Dashboard With Workload Percentage Ideas PDF. The topics addressed in these templates are Environment, Plan, Dashboard. All the content presented in this PPT design is completely editable. Download it and make adjustments in color, background, font etc. as per your unique business setting.

Brand Analytics KPI Dashboard For Organization Ppt PowerPoint Presentation Diagram PDF
The following slide outlines key performance indicator KPI dashboard that can assist marketers to evaluate brand performance on social media channels. The metrics covered are age group, gender, brand perception, branding themes, celebrity analysis, etc. Take your projects to the next level with our ultimate collection of Brand Analytics KPI Dashboard For Organization Ppt PowerPoint Presentation Diagram PDF. Slidegeeks has designed a range of layouts that are perfect for representing task or activity duration, keeping track of all your deadlines at a glance. Tailor these designs to your exact needs and give them a truly corporate look with your own brand colors they will make your projects stand out from the rest.

Finance Metrics Dashboard Illustrating Monthly Gross Profit Formats PDF
This graph or chart is linked to excel, and changes automatically based on data. Just left click on it and select edit data. Showcasing this set of slides titled Finance Metrics Dashboard Illustrating Monthly Gross Profit Formats PDF. The topics addressed in these templates are Profit Metrics Gross, Profit Target Cum, Actual Cum Target. All the content presented in this PPT design is completely editable. Download it and make adjustments in color, background, font etc. as per your unique business setting.

KPI Metrics Dashboard Icon For Freelance Content Marketing Ideas PDF
Persuade your audience using this KPI Metrics Dashboard Icon For Freelance Content Marketing Ideas PDF. This PPT design covers four stages, thus making it a great tool to use. It also caters to a variety of topics including Kpi Metrics, Freelance Content Marketing. Download this PPT design now to present a convincing pitch that not only emphasizes the topic but also showcases your presentation skills.

Key Performance Measure Dashboard Template Example Of Ppt
This is a key performance measure dashboard template example of ppt. This is a three stage process. The stages in this process are resources and tasks, sales, budget.

Supply Chain Approaches Dashboard Depicting Supply Chain Metrics Background PDF
This slide shows the dashboard that depicts supply chain metrics such as total net sales, supply chain expenses, average cash to cash cycle in days, carrying costs of inventory, etc.Deliver and pitch your topic in the best possible manner with this Supply Chain Approaches Dashboard Depicting Supply Chain Metrics Background PDF. Use them to share invaluable insights on Supply Chain, Expenses Based Category, Chain Expenses and impress your audience. This template can be altered and modified as per your expectations. So, grab it now.

Freelance Content Marketing Performance Metrics Dashboard Elements PDF
The following slide highlights the freelance content marketing performance metrics dashboard. It depicts content visitor and number of leads for last 24 hours, cost per click, number of content visitor, daily content visitor, lead generation source, top converting landing pages, top converting marketing channels and return on investment. Showcasing this set of slides titled Freelance Content Marketing Performance Metrics Dashboard Elements PDF. The topics addressed in these templates are Lead Generation Source, Return On Investment, Converting Marketing Channels. All the content presented in this PPT design is completely editable. Download it and make adjustments in color, background, font etc. as per your unique business setting.

Dashboard For Education Institutes With Student Retention Metrics Slides PDF
This slide covers dashboard for tracking student and faculty members details. It include metrics such as faculty to student ratio, student attendance rate, faculty retention rate, student enrollment details, examination results overview, etc. Showcasing this set of slides titled Dashboard For Education Institutes With Student Retention Metrics Slides PDF. The topics addressed in these templates are Student Enrollment Details, Examination Results Overview, Faculty Student Ratio. All the content presented in this PPT design is completely editable. Download it and make adjustments in color, background, font etc. as per your unique business setting.
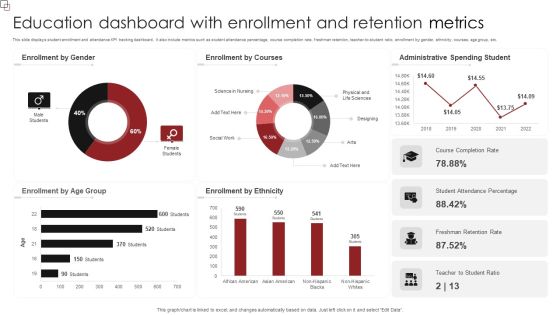
Education Dashboard With Enrollment And Retention Metrics Sample PDF
This slide displays student enrollment and attendance KPI tracking dashboard. It also include metrics such as student attendance percentage, course completion rate, freshman retention, teacher-to-student ratio, enrollment by gender, ethnicity, courses, age group, etc. Pitch your topic with ease and precision using this Education Dashboard With Enrollment And Retention Metrics Sample PDF. This layout presents information on Enrollment Gender, Enrollment Courses, Administrative Spending Student. It is also available for immediate download and adjustment. So, changes can be made in the color, design, graphics or any other component to create a unique layout.

Business Opportunity Dashboard With Customer Metrics Information PDF
This Slide illustrates market opportunity dashboard with customer metrics which contains favorable net promoter score NPS, standard customers, growth rate, cumulative average of customer location, net income vs projection, customer distribution, sales by representatives, etc. Pitch your topic with ease and precision using this Business Opportunity Dashboard With Customer Metrics Information PDF. This layout presents information on Customer Distribution, Growth Rate, Top Customers Locations. It is also available for immediate download and adjustment. So, changes can be made in the color, design, graphics or any other component to create a unique layout.
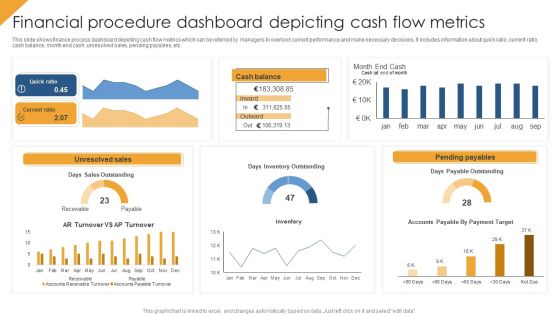
Financial Procedure Dashboard Depicting Cash Flow Metrics Structure PDF
This slide shows finance process dashboard depicting cash flow metrics which can be referred by managers to overlook current performance and make necessary decisions. It includes information about quick ratio, current ratio, cash balance, month end cash, unresolved sales, pending payables, etc. Pitch your topic with ease and precision using this Financial Procedure Dashboard Depicting Cash Flow Metrics Structure PDF. This layout presents information on Quick Ratio, Unresolved Sales, Pending Payables. It is also available for immediate download and adjustment. So, changes can be made in the color, design, graphics or any other component to create a unique layout.

Altcoins Portfolio Tracking Metrics Dashboard Ppt Inspiration Background Images PDF
This slide covers dashboard for tracking different cryptocurrencies value and growth. It includes metrics such as incomes and expenses, market values, cryptocurrency transactions history, overall growth percentages, exchange rates, etc. Showcasing this set of slides titled Altcoins Portfolio Tracking Metrics Dashboard Ppt Inspiration Background Images PDF. The topics addressed in these templates are Balance, 3 Currencies, Transactions. All the content presented in this PPT design is completely editable. Download it and make adjustments in color, background, font etc. as per your unique business setting.

Work Order Management Metric Dashboard Organization Physical Assets Template PDF
This slide represents KPI dashboard for work tracking and management. It covers metrics such as project health, time status, tasks, cost, progress and workload. Boost your pitch with our creative Work Order Management Metric Dashboard Organization Physical Assets Template PDF. Deliver an awe-inspiring pitch that will mesmerize everyone. Using these presentation templates you will surely catch everyones attention. You can browse the ppts collection on our website. We have researchers who are experts at creating the right content for the templates. So you do not have to invest time in any additional work. Just grab the template now and use them.
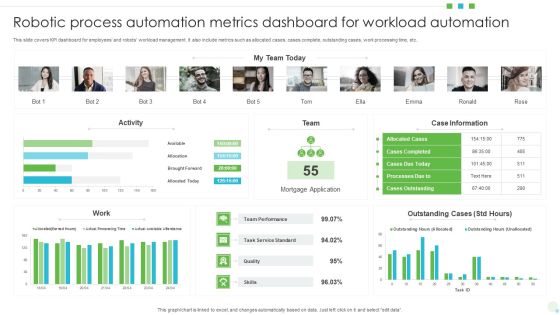
Robotic Process Automation Metrics Dashboard For Workload Automation Mockup PDF
This slide covers KPI dashboard for employees and robots workload management. It also include metrics such as allocated cases, cases complete, outstanding cases, work processing time, etc. Pitch your topic with ease and precision using this Robotic Process Automation Metrics Dashboard For Workload Automation Mockup PDF. This layout presents information on Mortgage Application, Team Performance, Case Information. It is also available for immediate download and adjustment. So, changes can be made in the color, design, graphics or any other component to create a unique layout.

Robotic Process Automation Metrics KPI Dashboard Themes PDF
This slide covers dashboard for service cases management with RPA deployment. It include metrics such as service cases by status, assignments within service level agreement, average handle time, NPS across channels, open cases past SLA, etc. Showcasing this set of slides titled Robotic Process Automation Metrics KPI Dashboard Themes PDF. The topics addressed in these templates are Average, Service Cases, Customer Satisfaction. All the content presented in this PPT design is completely editable. Download it and make adjustments in color, background, font etc. as per your unique business setting.

Dashboard For Tracking Sales Target Metrics Introduction PDF
This slide presents KPI dashboard for tracking Sales Target Metrics achievement monthly and region wise helpful in adjusting activities as per ongoing performance. It includes average weekly sales revenue, average sales target, annual sales growth, regional sales performance and average revenue per unit that should be regularly tracked. Showcasing this set of slides titled Dashboard For Tracking Sales Target Metrics Introduction PDF. The topics addressed in these templates are Average Revenue, Per Unit, Average Weekly, Sales Revenue. All the content presented in this PPT design is completely editable. Download it and make adjustments in color, background, font etc. as per your unique business setting.

Call Center Metrics Dashboard Highlighting Service Level Infographics PDF
Mentioned slide outlines comprehensive call center KPI dashboard. Information covered in this slide is related to various metrics such as queue calls, support and billing service level, inbound volume, outbound volume etc. Pitch your topic with ease and precision using this Call Center Metrics Dashboard Highlighting Service Level Infographics PDF. This layout presents information on All Agents, Queue Calls, Billing Service Level. It is also available for immediate download and adjustment. So, changes can be made in the color, design, graphics or any other component to create a unique layout.

Call Center Metrics Dashboard With Customer Satisfaction Score Ideas PDF
Mentioned slide outlines a comprehensive call center KPI dashboard which can be used for those customers who are seeking technical support. It provides detailed information about metrics such as ticket status, ticket by channels and type, overall customer satisfaction score, etc. Showcasing this set of slides titled Call Center Metrics Dashboard With Customer Satisfaction Score Ideas PDF. The topics addressed in these templates are Customer Satisfaction, Score Ticket Status, Satisfaction Score. All the content presented in this PPT design is completely editable. Download it and make adjustments in color, background, font etc. as per your unique business setting.
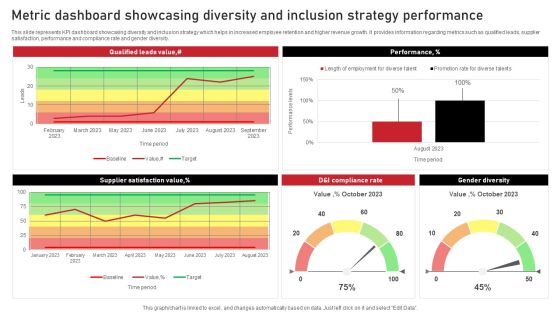
Metric Dashboard Showcasing Diversity And Inclusion Strategy Performance Background PDF
This slide represents KPI dashboard showcasing diversity and inclusion strategy which helps in increased employee retention and higher revenue growth. It provides information regarding metrics such as qualified leads, supplier satisfaction, performance and compliance rate and gender diversity. Showcasing this set of slides titled Metric Dashboard Showcasing Diversity And Inclusion Strategy Performance Background PDF. The topics addressed in these templates are Performance, Gender Diversity, Performance. All the content presented in this PPT design is completely editable. Download it and make adjustments in color, background, font etc. as per your unique business setting.

Brand Advertisement Plan Dashboard With Advertising Metrics Inspiration PDF
The following slide showcases marketing plan dashboard to improve the market share of brand and increase revenue. It includes metrics such as brand awareness, commitment, attributes, market share, repeat purchase and frequency profile etc Showcasing this set of slides titled Brand Advertisement Plan Dashboard With Advertising Metrics Inspiration PDF. The topics addressed in these templates are Brand Awareness, Brand Commitment, Awareness. All the content presented in this PPT design is completely editable. Download it and make adjustments in color, background, font etc. as per your unique business setting.

Continuous Performance Measurement Plan For Website Development Icons PDF
Pitch your topic with ease and precision using this Continuous Performance Measurement Plan For Website Development Icons PDF This layout presents information on Increased Customer Engagement, Increase In Conversion, Adding Upcoming Product It is also available for immediate download and adjustment. So, changes can be made in the color, design, graphics or any other component to create a unique layout.
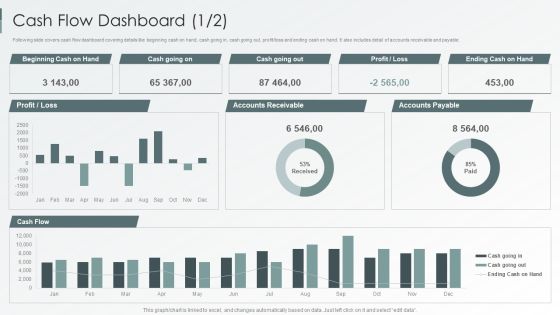
Enterprise Sustainability Performance Metrics Cash Flow Dashboard Inspiration PDF
Following slide covers cash flow dashboard covering details like beginning cash on hand, cash going in, cash going out, profit loss and ending cash on hand. It also includes detail of accounts receivable and payable.Deliver an awe inspiring pitch with this creative Enterprise Sustainability Performance Metrics Cash Flow Dashboard Inspiration PDF bundle. Topics like Accounts Receivable, Accounts Payable, Profit Loss can be discussed with this completely editable template. It is available for immediate download depending on the needs and requirements of the user.
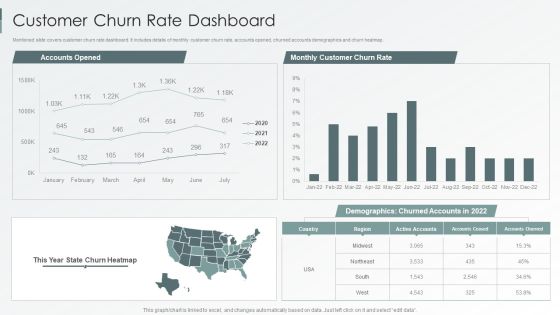
Enterprise Sustainability Performance Metrics Customer Churn Rate Dashboard Summary PDF
Mentioned slide covers customer churn rate dashboard. It includes details of monthly customer churn rate, accounts opened, churned accounts demographics and churn heatmap.Deliver an awe inspiring pitch with this creative Enterprise Sustainability Performance Metrics Customer Churn Rate Dashboard Summary PDF bundle. Topics like Accounts Opened, Demographics Churned, Monthly Customer can be discussed with this completely editable template. It is available for immediate download depending on the needs and requirements of the user.
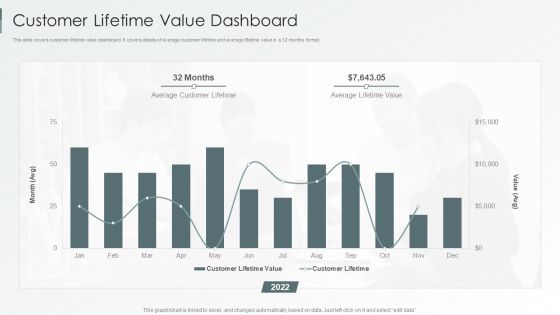
Enterprise Sustainability Performance Metrics Customer Lifetime Value Dashboard Graphics PDF
This slide covers customer lifetime value dashboard. It covers details of average customer lifetime and average lifetime value in a 12 months format.Deliver and pitch your topic in the best possible manner with this Enterprise Sustainability Performance Metrics Customer Lifetime Value Dashboard Graphics PDF. Use them to share invaluable insights on Average Customer, Lifetime Value, Customer Lifetime and impress your audience. This template can be altered and modified as per your expectations. So, grab it now.
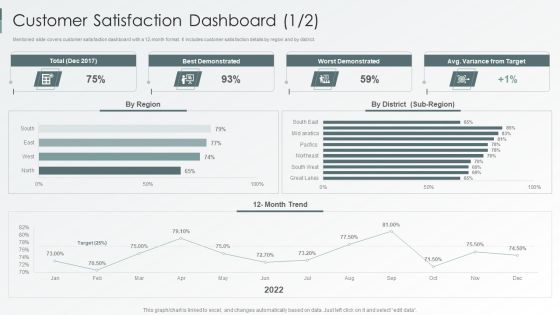
Enterprise Sustainability Performance Metrics Customer Satisfaction Dashboard Designs PDF
Mentioned slide covers customer satisfaction dashboard with a 12-month format. It includes customer satisfaction details by region and by district. Deliver an awe inspiring pitch with this creative Enterprise Sustainability Performance Metrics Customer Satisfaction Dashboard Designs PDF bundle. Topics like Best Demonstrated, Worst Demonstrated, Variance Target can be discussed with this completely editable template. It is available for immediate download depending on the needs and requirements of the user.

Enterprise Sustainability Performance Metrics Financial Performance Indicator Dashboard Themes PDF
This slide shows financial performance indicator dashboard covering net profit and net sales, profitability indicator ratios, cogs and net profit by region or channel.Deliver an awe inspiring pitch with this creative Enterprise Sustainability Performance Metrics Financial Performance Indicator Dashboard Themes PDF bundle. Topics like Profitability Indicator, Sold Breakdown, Target Actual can be discussed with this completely editable template. It is available for immediate download depending on the needs and requirements of the user.
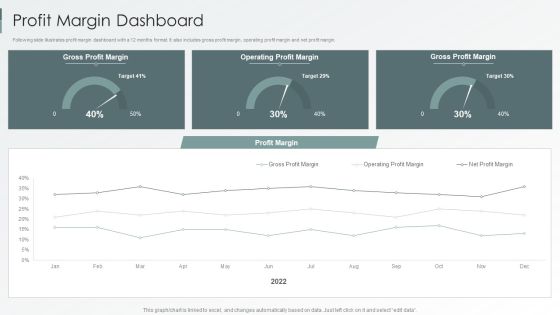
Enterprise Sustainability Performance Metrics Profit Margin Dashboard Brochure PDF
Following slide illustrates profit margin dashboard with a 12 months format. It also includes gross profit margin, operating profit margin and net profit margin.Deliver an awe inspiring pitch with this creative Enterprise Sustainability Performance Metrics Profit Margin Dashboard Brochure PDF bundle. Topics like Gross Profit, Margin Operating, Profit Margin can be discussed with this completely editable template. It is available for immediate download depending on the needs and requirements of the user.

Securities Allocation Dashboard For Project Metrics Information PDF
This slide shows the securities allocation dashboard for project management which focuses on expenses incurred on project which includes cash, commends, revenues and inventory with total allocation of securities with the percentage. Showcasing this set of slides titled Securities Allocation Dashboard For Project Metrics Information PDF. The topics addressed in these templates are Inventory, Project, Revenues. All the content presented in this PPT design is completely editable. Download it and make adjustments in color, background, font etc. as per your unique business setting.
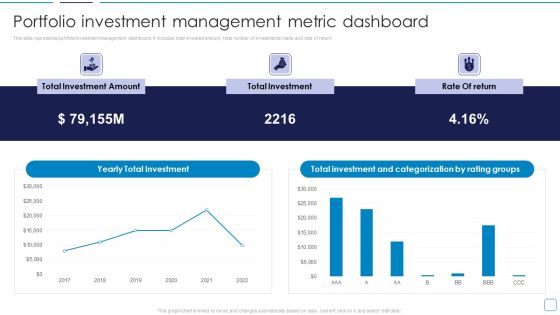
Portfolio Wealth Management Portfolio Investment Management Metric Dashboard Sample PDF
This slide represents portfolio investment management dashboard. It includes total invested amount, total number of investments made and rate of return. Deliver and pitch your topic in the best possible manner with this Portfolio Wealth Management Portfolio Investment Management Metric Dashboard Sample PDF. Use them to share invaluable insights on Yearly Total Investment, Total Investment, Rate Return, Total Investment Amount and impress your audience. This template can be altered and modified as per your expectations. So, grab it now.
Market Penetration Dashboard With Sales Metrics Ppt Icon Examples PDF
This slide shows market penetration dashboard for sales team. It provides information about regions, emerging markets, planned sales, actual sales, revenue, gender wise sales, etc. Pitch your topic with ease and precision using this Market Penetration Dashboard With Sales Metrics Ppt Icon Examples PDF. This layout presents information on Emerging Markets, Sales Gender, Actual Sales. It is also available for immediate download and adjustment. So, changes can be made in the color, design, graphics or any other component to create a unique layout.
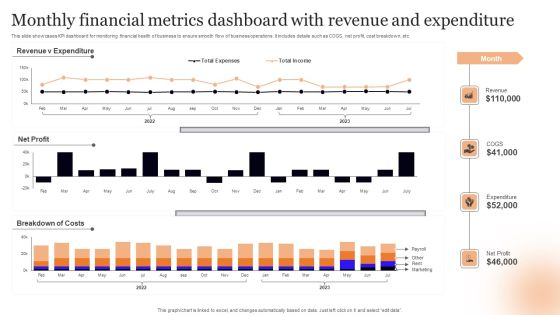
Monthly Financial Metrics Dashboard With Revenue And Expenditure Rules PDF
This slide showcases KPI dashboard for monitoring financial health of business to ensure smooth flow of business operations. It includes details such as COGS, net profit, cost breakdown, etc. Showcasing this set of slides titled Monthly Financial Metrics Dashboard With Revenue And Expenditure Rules PDF. The topics addressed in these templates are Net Profit, Costs, Expenditure. All the content presented in this PPT design is completely editable. Download it and make adjustments in color, background, font etc. as per your unique business setting.

Metric Dashboard Showcasing Workplace Gender Diversity Microsoft PDF
This slide represents KPI dashboard showcasing workplace gender diversity which helps uncover potential inequalities in workplace . It provides information regarding marital status, ethnicity, average tenure by gender and age. Showcasing this set of slides titled Metric Dashboard Showcasing Workplace Gender Diversity Microsoft PDF. The topics addressed in these templates are Marital Status, Ethnicity, Average. All the content presented in this PPT design is completely editable. Download it and make adjustments in color, background, font etc. as per your unique business setting.
 Home
Home