Kpis
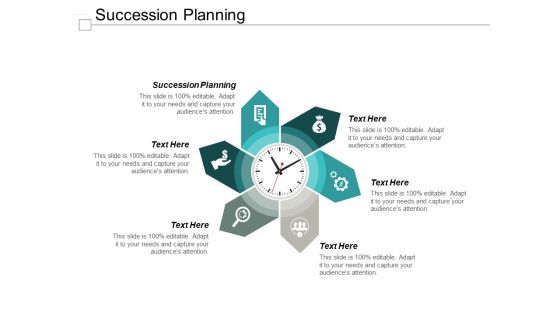
Succession Planning Ppt PowerPoint Presentation File Ideas
This is a succession planning ppt powerpoint presentation file ideas. This is a six stage process. The stages in this process are succession planning.

Business Intelligence Tool Ppt PowerPoint Presentation Outline Gridlines Cpb
This is a business intelligence tool ppt powerpoint presentation outline gridlines cpb. This is a eight stage process. The stages in this process are business intelligence tool.

Pyramid Showing Key Performance Indicators For IT Department Performance Evaluation Ppt PowerPoint Presentation Show Graphics Design PDF
Persuade your audience using this pyramid showing key performance indicators for it department performance evaluation ppt powerpoint presentation show graphics design pdf. This PPT design covers five stages, thus making it a great tool to use. It also caters to a variety of topics including it roi, team attrition rate, server downtime, number of new features developed, number of projects completed. Download this PPT design now to present a convincing pitch that not only emphasizes the topic but also showcases your presentation skills.

HR Scoreboard Manager Performance Inspiration PDF
The purpose of this slide is to showcase certain key performance indicators of human resource managers in order to measure their performance based on specific criteria. It includes key areas, metrics, targets, achieved, and performance rating. Showcasing this set of slides titled HR Scoreboard Manager Performance Inspiration PDF. The topics addressed in these templates are Target, Achieved, Performance Rating. All the content presented in this PPT design is completely editable. Download it and make adjustments in color, background, font etc. as per your unique business setting.

Employee Production Scorecard For Estimating Efficiency And Productivity Topics PDF
This is a Employee Production Scorecard For Estimating Efficiency And Productivity Topics PDF template with various stages. Focus and dispense information on three stages using this creative set, that comes with editable features. It contains large content boxes to add your information on topics like Location, Efficiency And Productivity, Employee Production Scorecard. You can also showcase facts, figures, and other relevant content using this PPT layout. Grab it now.

Risk Metrics Dashboard And Mitigation Expenditure Dashboard Ideas PDF
This slide illustrates facts and figures of expenditure incurred on different risks. It includes financial risk, operational risks and competition risks. Pitch your topic with ease and precision using this Risk Metrics Dashboard And Mitigation Expenditure Dashboard Ideas PDF. This layout presents information on Management, Expenditure, Risk. It is also available for immediate download and adjustment. So, changes can be made in the color, design, graphics or any other component to create a unique layout.
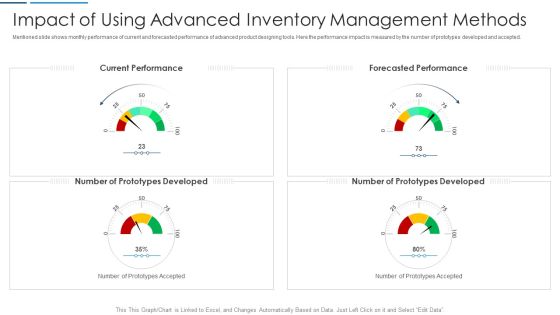
Information Technology Transformation Impact Of Using Advanced Inventory Management Methods Background PDF
Mentioned slide shows monthly performance of current and forecasted performance of advanced product designing tools. Here the performance impact is measured by the number of prototypes developed and accepted. Presenting information technology transformation impact of using advanced inventory management methods background pdf to provide visual cues and insights. Share and navigate important information on four stages that need your due attention. This template can be used to pitch topics like current performance, forecasted performance, developed. In addtion, this PPT design contains high resolution images, graphics, etc, that are easily editable and available for immediate download.

Information Technology Transformation Impact Of Using Advanced Manufacturing Machines Diagrams PDF
Mentioned slide shows daily performance of current and forecasted performance of advanced manufacturing machines. Here the performance impact is measured on average runtime of machine with product output and maintenance cost. This is a information technology transformation impact of using advanced manufacturing machines diagrams pdf template with various stages. Focus and dispense information on two stages using this creative set, that comes with editable features. It contains large content boxes to add your information on topics like forecasted performance, current performance, maintenance cost. You can also showcase facts, figures, and other relevant content using this PPT layout. Grab it now.

Staff Retention Plan Employee Retention Dashboard Ppt Portfolio Show PDF
The following slide displays the Human Resource Dashboard, as it highlights the key performance indicators for HR department, these metrics can be Employee count by department, employee details etc. Deliver an awe inspiring pitch with this creative staff retention plan employee retention dashboard ppt portfolio show pdf bundle. Topics like employee retention dashboard can be discussed with this completely editable template. It is available for immediate download depending on the needs and requirements of the user.

Measuring Our SEO Performance Ppt PowerPoint Presentation File Example PDF
The following slide provides various key performance indicators of the SEO strategy, these can be number of users, social networks and new vs returning If your project calls for a presentation, then Slidegeeks is your go to partner because we have professionally designed, easy to edit templates that are perfect for any presentation. After downloading, you can easily edit Measuring Our SEO Performance Ppt PowerPoint Presentation File Example PDF and make the changes accordingly. You can rearrange slides or fill them with different images. Check out all the handy templates

Dashboard To Measure Performance Of E Commerce Marketing Strategies Structure PDF
This following slide displays the key metrics that can help an organization to measure effectiveness of e-commerce strategies. These can be revenue generated using e-commerce platform, conversion rates etc.Create an editable Dashboard To Measure Performance Of E Commerce Marketing Strategies Structure PDF that communicates your idea and engages your audience. Whether you are presenting a business or an educational presentation, pre-designed presentation templates help save time. Dashboard To Measure Performance Of E Commerce Marketing Strategies Structure PDF is highly customizable and very easy to edit, covering many different styles from creative to business presentations. Slidegeeks has creative team members who have crafted amazing templates. So, go and get them without any delay.
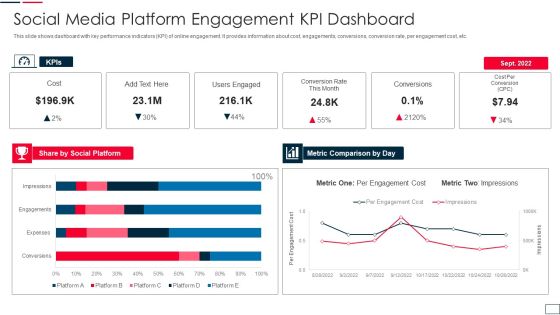
Social Media Platform Engagement Kpi Dashboard Elements PDF
This slide shows dashboard with key performance indicators KPI of online engagement. It provides information about cost, engagements, conversions, conversion rate, per engagement cost, etc. Showcasing this set of slides titled social media platform engagement kpi dashboard elements pdf. The topics addressed in these templates are social, metric, cost. All the content presented in this PPT design is completely editable. Download it and make adjustments in color, background, font etc. as per your unique business setting.

Business Intelligence And Big Success Metrics For Data Analytics Speculation Microsoft PDF
This slide shows the key success factors for evaluating the success of data analytics program. The foremost key metrics includes discovery, insights, outcomes and actions. This is a business intelligence and big success metrics for data analytics speculation microsoft pdf template with various stages. Focus and dispense information on four stages using this creative set, that comes with editable features. It contains large content boxes to add your information on topics like discovery, insights, actions, outcomes. You can also showcase facts, figures, and other relevant content using this PPT layout. Grab it now.

Digital Watch Graphics For Making Goals Measurable Ppt PowerPoint Presentation Gallery Rules PDF
Pitch your topic with ease and precision using this digital watch graphics for making goals measurable ppt powerpoint presentation gallery rules pdf. This layout presents information on digital watch graphics for making goals measurable. It is also available for immediate download and adjustment. So, changes can be made in the color, design, graphics or any other component to create a unique layout.
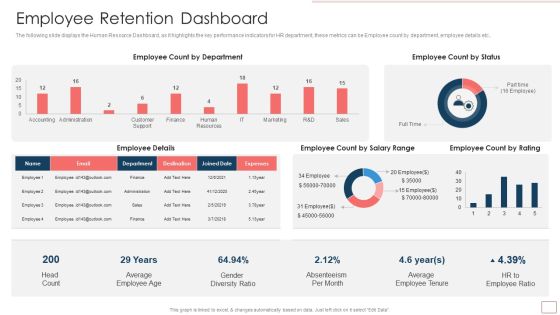
Strategic Human Resource Retention Management Employee Retention Dashboard Structure PDF
The following slide displays the Human Resource Dashboard, as it highlights the key performance indicators for HR department, these metrics can be Employee count by department, employee details etc.Deliver an awe inspiring pitch with this creative Strategic Human Resource Retention Management Employee Retention Dashboard Structure PDF bundle. Topics like Count By Department, Employee Count, Average Employee can be discussed with this completely editable template. It is available for immediate download depending on the needs and requirements of the user.
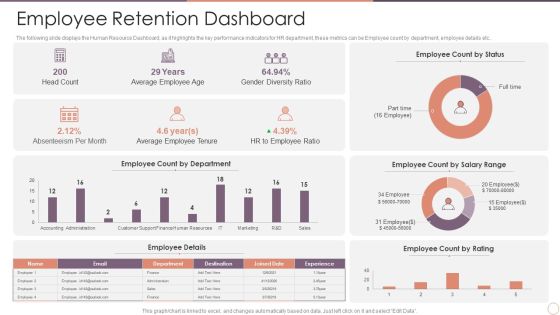
Managing Employee Turnover Employee Retention Dashboard Information PDF
The following slide displays the Human Resource Dashboard, as it highlights the key performance indicators for HR department, these metrics can be Employee count by department, employee details etc.Deliver and pitch your topic in the best possible manner with this Managing Employee Turnover Employee Retention Dashboard Information PDF. Use them to share invaluable insights on Employee Count, Gender Diversity, Average Employee and impress your audience. This template can be altered and modified as per your expectations. So, grab it now.

Customer Touch Point Values Powerpoint Slide Templates
This is a customer touch point values powerpoint slide templates. This is a one stage process. The stages in this process are digital touch point, website, portal, article, search, testimonial, price comparison, social media, online video, info social network, email, blog, performance dimension, web equity, pre purchase, post purchase, relationship building, trust, credibility, believability, influence, vitierc to buy, coupon, buy online, pre purchase research, compare brands, customer service, product support, learn more, customer relationship.
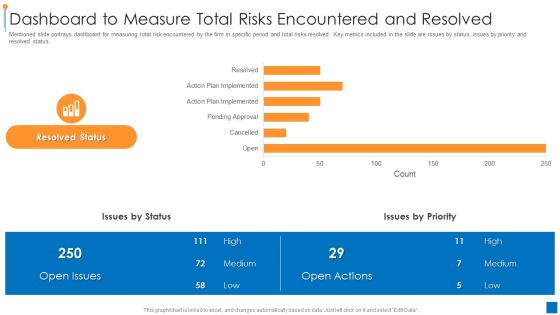
International Organization Standardization 270001 Dashboard To Measure Total Risks Encountered And Resolved Demonstration PDF
Mentioned slide portrays dashboard for measuring total risk encountered by the firm in specific period and total risks resolved. Key metrics included in the slide are issues by status, issues by priority and resolved status. Deliver and pitch your topic in the best possible manner with this international organization standardization 270001 dashboard to measure total risks encountered and resolved demonstration pdf. Use them to share invaluable insights on dashboard to measure total risks encountered and resolved and impress your audience. This template can be altered and modified as per your expectations. So, grab it now.

Corporate Resource Planning Dashboard To Measure Performance Of ERP Implementation Designs PDF
This slide describes the dashboard to measure the performance of ERP implementation, and it is coving details of production and revenues.Deliver and pitch your topic in the best possible manner with this Corporate Resource Planning Dashboard To Measure Performance Of ERP Implementation Designs PDF Use them to share invaluable insights on Dashboard To Measure, Performance Of ERP, Implementation and impress your audience. This template can be altered and modified as per your expectations. So, grab it now.

Automation Project Status Dashboard Of Consulting Firm Report Background PDF
This slide showcases project status dashboard that provides a concise visual of key indicators progress and allow to compare actual performance with pre-built objectives. Key metrics covered are cost performance, time v or s project phase, timeline v or s resource capacity. Showcasing this set of slides titled Automation Project Status Dashboard Of Consulting Firm Report Background PDF. The topics addressed in these templates are Project Phase, Planned Value, Cost Performance Index. All the content presented in this PPT design is completely editable. Download it and make adjustments in color, background, font etc. as per your unique business setting.

Product Development Status Icon With Bulb Ideas PDF
The following slide showcases dashboard that helps to track key performance indicators of product development. Key metrics covered overall progress, planning, design, development, testing, risks, summary, average handle time, overdue tasks, upcoming deadlines and projected launch date. Showcasing this set of slides titled Product Development Status Icon With Bulb Ideas PDF. The topics addressed in these templates are Design, Development, Planning. All the content presented in this PPT design is completely editable. Download it and make adjustments in color, background, font etc. as per your unique business setting.

Key Company Financials Business Intelligence Dashboard Graphics PDF
This slide showcases business intelligence dashboard to analyze key financial metrics for the organization. It includes information such as current working capital, vendor payment error rate, quick stats, budget variance, etc. Showcasing this set of slides titled Key Company Financials Business Intelligence Dashboard Graphics PDF. The topics addressed in these templates are Key Company Financials, Business Intelligence Dashboard. All the content presented in this PPT design is completely editable. Download it and make adjustments in color, background, font etc. as per your unique business setting.
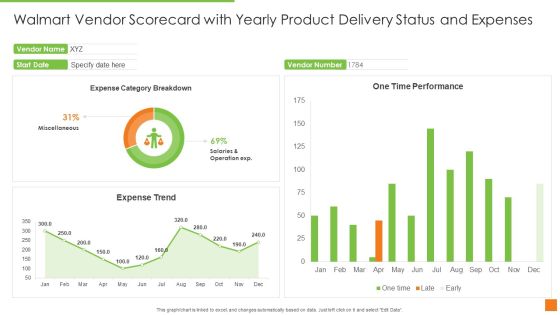
Walmart Vendor Scorecard With Yearly Product Delivery Status And Expenses Ppt Layouts Graphics PDF
Deliver an awe inspiring pitch with this creative walmart vendor scorecard with yearly product delivery status and expenses ppt layouts graphics pdf bundle. Topics like expense category breakdown, one time performance, expense trend can be discussed with this completely editable template. It is available for immediate download depending on the needs and requirements of the user.

Mini Charter For Data Analytics Project With Metrics Business Analysis Modification Toolkit Infographics PDF
This slide shows the formal document that describes the scope of business analytics project covering its goals, key metrics, resources, teams and milestones etc.Deliver and pitch your topic in the best possible manner with this Mini Charter For Data Analytics Project With Metrics Business Analysis Modification Toolkit Infographics PDF. Use them to share invaluable insights on Business Intelligence, Functional Requirement, Project Information and impress your audience. This template can be altered and modified as per your expectations. So, grab it now.

Business Intelligence And Mini Charter For Data Analytics Project With Metrics Professional PDF
This slide shows the formal document that describes the scope of business analytics project covering its goals, key metrics, resources, teams and milestones etc. Deliver an awe inspiring pitch with this creative business intelligence and mini charter for data analytics project with metrics professional pdf bundle. Topics like project overview, project team, project information, goal statement can be discussed with this completely editable template. It is available for immediate download depending on the needs and requirements of the user.

Cybersecurity Operations Cybersecops Metrics To Track Secops Impact On Business Icons PDF
This slide refers to the key metrics to track the impact of SecOps implementation on business. The purpose of this slide is to highlight the key metrics for SecOps tracking, including mean time to acknowledge, mean time to resolve, incidents remediated and escalations between each tier. Get a simple yet stunning designed Cybersecurity Operations Cybersecops Metrics To Track Secops Impact On Business Icons PDF. It is the best one to establish the tone in your meetings. It is an excellent way to make your presentations highly effective. So, download this PPT today from Slidegeeks and see the positive impacts. Our easy to edit Cybersecurity Operations Cybersecops Metrics To Track Secops Impact On Business Icons PDF can be your go to option for all upcoming conferences and meetings. So, what are you waiting for Grab this template today.
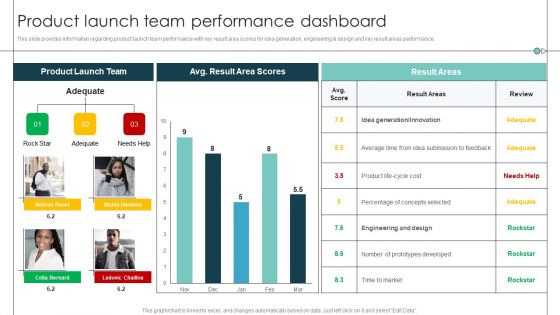
Product Launch Team Performance Dashboard Product Release Commencement Structure PDF
This slide provides information regarding product launch team performance with key result area scores for idea generation, engineering and design and key result areas performance. Deliver and pitch your topic in the best possible manner with this Product Launch Team Performance Dashboard Product Release Commencement Structure PDF. Use them to share invaluable insights on Average Time, Prototypes Developed, Percentage Concepts and impress your audience. This template can be altered and modified as per your expectations. So, grab it now.

Product Social Sustainability Scorecard With Product Packaging Recyclability Mockup PDF
Presenting product social sustainability scorecard with product packaging recyclability mockup pdf to provide visual cues and insights. Share and navigate important information on two stages that need your due attention. This template can be used to pitch topics like recyclable with dissolution, product packaging, non recyclable in the condition. In addtion, this PPT design contains high resolution images, graphics, etc, that are easily editable and available for immediate download.

Customer Support Team Dashboard For Measuring Differentiation Efforts Formats PDF
The following slide helps organization in understanding the effect of their differentiation strategy. It highlight essential metrics such as tickets raised by customer, support status and total unresolved tickets. Deliver an awe inspiring pitch with this creative Customer Support Team Dashboard For Measuring Differentiation Efforts Formats PDF bundle. Topics like Customer Support Team Dashboard, Measuring Differentiation Efforts can be discussed with this completely editable template. It is available for immediate download depending on the needs and requirements of the user.
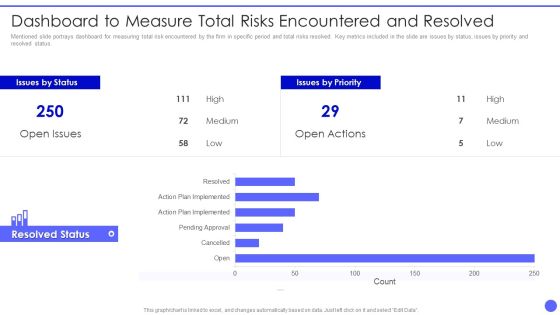
Info Safety And ISO 27001 Dashboard To Measure Total Risks Encountered Slides PDF
Mentioned slide portrays dashboard for measuring total risk encountered by the firm in specific period and total risks resolved. Key metrics included in the slide are issues by status, issues by priority and resolved status. Deliver an awe inspiring pitch with this creative Info Safety And ISO 27001 Dashboard To Measure Total Risks Encountered Slides PDF bundle. Topics like Issues by Status, Resolved Status, High, Medium, Low can be discussed with this completely editable template. It is available for immediate download depending on the needs and requirements of the user.

Ways To Accomplish ISO 27001 Accreditation Dashboard To Measure Total Risks Encountered Download PDF
Mentioned slide portrays dashboard for measuring total risk encountered by the firm in specific period and total risks resolved. Key metrics included in the slide are issues by status, issues by priority and resolved status. Deliver an awe inspiring pitch with this creative Ways To Accomplish ISO 27001 Accreditation Dashboard To Measure Total Risks Encountered Download PDF bundle. Topics like Pending Approval, Action Plan, Resolved Status can be discussed with this completely editable template. It is available for immediate download depending on the needs and requirements of the user.
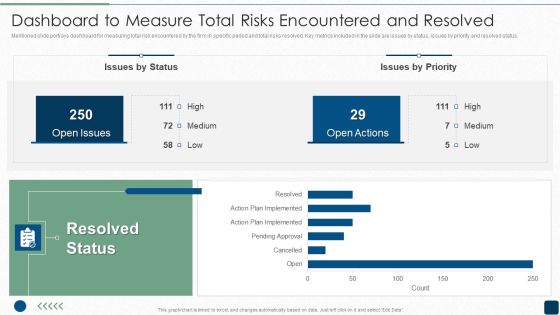
ISO 27001 Certification Procedure Dashboard To Measure Total Risks Encountered And Resolved Topics PDF
Mentioned slide portrays dashboard for measuring total risk encountered by the firm in specific period and total risks resolved. Key metrics included in the slide are issues by status, issues by priority and resolved status.Deliver and pitch your topic in the best possible manner with this ISO 27001 Certification Procedure Dashboard To Measure Total Risks Encountered And Resolved Topics PDF. Use them to share invaluable insights on Resolved Status, Open Issues, Open Actions and impress your audience. This template can be altered and modified as per your expectations. So, grab it now.

Metrics To Measure Business Performance Effective Rate Metrics By Customer And Offering Diagrams PDF
This slide covers effective rate metrics. It shows over year over comparison of effective rate per customer as well as effective rate per offering. Deliver and pitch your topic in the best possible manner with this Metrics To Measure Business Performance Effective Rate Metrics By Customer And Offering Diagrams PDF. Use them to share invaluable insights on Effective Rate, Per Customer, Per Offering and impress your audience. This template can be altered and modified as per your expectations. So, grab it now.

Dashboard Ppt PowerPoint Presentation Slides
This is a dashboard ppt powerpoint presentation slides. This is a three stage process. The stages in this process are dashboard, measure, marketing, strategy, business.

Dashboard Ppt PowerPoint Presentation Backgrounds
This is a dashboard ppt powerpoint presentation backgrounds. This is a two stage process. The stages in this process are dashboard, percentage, finance, measurement, business.

Dashboard Ppt PowerPoint Presentation Visuals
This is a dashboard ppt powerpoint presentation visuals. This is a four stage process. The stages in this process are dashboard, measure, management, business, marketing.

Dashboard Ppt PowerPoint Presentation Introduction
This is a dashboard ppt powerpoint presentation introduction. This is a four stage process. The stages in this process are dashboard, measure, strategy, business, success.

Dashboard Ppt PowerPoint Presentation Summary
This is a dashboard ppt powerpoint presentation summary. This is a three stage process. The stages in this process are business, management, marketing, dashboard, measure.

Dashboard Ppt PowerPoint Presentation Layout
This is a dashboard ppt powerpoint presentation layout. This is a one stage process. The stages in this process are dashboard, measurement, business, marketing.

Dashboard Ppt PowerPoint Presentation Rules
This is a dashboard ppt powerpoint presentation rules. This is a three stage process. The stages in this process are dashboard, measurement, percentage, analysis, business.

Dashboard Ppt PowerPoint Presentation Images
This is a dashboard ppt powerpoint presentation images. This is a one stage process. The stages in this process are dashboard, meter, speed, measure, business.

Three Dashboard For Financial Reporting Ppt Summary
This is a three dashboard for financial reporting ppt summary. This is a three stage process. The stages in this process are business, marketing, speed, dashboard, meter.

Dashboard Ppt PowerPoint Presentation Infographics Introduction
This is a dashboard ppt powerpoint presentation infographics introduction. This is a four stage process. The stages in this process are dashboard, meter, business, marketing, finance.

Dashboard Ppt PowerPoint Presentation Model Inspiration
This is a dashboard ppt powerpoint presentation model inspiration. This is a five stage process. The stages in this process are dashboard, business, marketing, strategy, meter.

Dashboard Ppt PowerPoint Presentation Styles Elements
This is a dashboard ppt powerpoint presentation styles elements. This is a three stage process. The stages in this process are percentage, finance, business, marketing, dashboard.

Dashboard Ppt PowerPoint Presentation Portfolio Demonstration
This is a dashboard ppt powerpoint presentation portfolio demonstration. This is a two stage process. The stages in this process are dashboard, finance, percentage, meter, speed.

Dashboard Ppt PowerPoint Presentation Portfolio Samples
This is a dashboard ppt powerpoint presentation portfolio samples. This is a two stage process. The stages in this process are dashboard, percentage, business, marketing, management.

Dashboard Ppt PowerPoint Presentation Outline Example File
This is a dashboard ppt powerpoint presentation outline example file. This is a one stage process. The stages in this process are high speed, dashboard, business, marketing.

Dashboard Ppt PowerPoint Presentation Ideas Elements
This is a dashboard ppt powerpoint presentation ideas elements. This is a two stage process. The stages in this process are dashboard, percentage, business, marketing, management.

Dashboard Ppt PowerPoint Presentation File Design Ideas
This is a dashboard ppt powerpoint presentation file design ideas. This is a three stage process. The stages in this process are dashboard, business, marketing, management.

Dashboard Ppt PowerPoint Presentation Infographics Tips
This is a dashboard ppt powerpoint presentation infographics tips. This is a three stage process. The stages in this process are low, medium, high, dashboard, business, percentage.

Dashboard Ppt PowerPoint Presentation Model Layout
This is a dashboard ppt powerpoint presentation model layout. This is a three stage process. The stages in this process are dashboard, meter, finance, speed, marketing.

Dashboard Ppt PowerPoint Presentation Show Deck
This is a dashboard ppt powerpoint presentation show deck. This is a three stage process. The stages in this process are low, medium, high, dashboard, business.

Dashboard Ppt PowerPoint Presentation Inspiration Slide Download
This is a dashboard ppt powerpoint presentation inspiration slide download. This is a three stage process. The stages in this process are dashboard, business, marketing, process, strategy.

Dashboard Ppt PowerPoint Presentation Show Designs
This is a dashboard ppt powerpoint presentation show designs. This is a three stage process. The stages in this process are business, marketing, strategy, dashboard, finance.

Dashboard Ppt PowerPoint Presentation File Deck
This is a dashboard ppt powerpoint presentation file deck. This is a three stage process. The stages in this process are dashboard, percentage, business, marketing, strategy.

Dashboard Ppt PowerPoint Presentation Layouts Files
This is a dashboard ppt powerpoint presentation layouts files. This is a three stage process. The stages in this process are low, medium, high, dashboard, business.

Dashboard Ppt PowerPoint Presentation Pictures Mockup
This is a dashboard ppt powerpoint presentation pictures mockup. This is a three stage process. The stages in this process are dashboard, business, marketing, strategy, low.

Dashboard Ppt PowerPoint Presentation Model Slide Download
This is a dashboard ppt powerpoint presentation model slide download. This is a one stage process. The stages in this process are finance, planning, meter, speed, dashboard.

Dashboard Ppt PowerPoint Presentation Gallery Ideas
This is a dashboard ppt powerpoint presentation gallery ideas. This is a two stage process. The stages in this process are business, marketing, dashboard, analysis, finance.
 Home
Home