AI PPT Maker
Templates
PPT Bundles
Design Services
Business PPTs
Business Plan
Management
Strategy
Introduction PPT
Roadmap
Self Introduction
Timelines
Process
Marketing
Agenda
Technology
Medical
Startup Business Plan
Cyber Security
Dashboards
SWOT
Proposals
Education
Pitch Deck
Digital Marketing
KPIs
Project Management
Product Management
Artificial Intelligence
Target Market
Communication
Supply Chain
Google Slides
Research Services
 One Pagers
All Categories
-
Home
- Customer Favorites
- Kpis
Kpis

Debt Retrieval Techniques Our Key Performance Indicators For Balance Sheet Ppt Pictures Gallery PDF
Purpose of the following side is to display the major KPI for the balance sheet as it highlight the key components such as current asset, current liabilities, total assets and total liability of the organization for the financial year 2020 2021 Deliver and pitch your topic in the best possible manner with this debt retrieval techniques our key performance indicators for balance sheet ppt pictures gallery pdf. Use them to share invaluable insights on current assets, current liabilities, total assets, total liabilities and impress your audience. This template can be altered and modified as per your expectations. So, grab it now.

Debt Collection Improvement Plan Our Key Performance Indicators For Balance Sheet Professional PDF
Purpose of the following side is to display the major KPI for the balance sheet as it highlight the key components such as current asset, current liabilities, total assets and total liability of the organization for the financial year 2021 to 2022. Deliver and pitch your topic in the best possible manner with this debt collection improvement plan our key performance indicators for balance sheet professional pdf. Use them to share invaluable insights on current assets, current liabilities, total assets, total liabilities and impress your audience. This template can be altered and modified as per your expectations. So, grab it now.
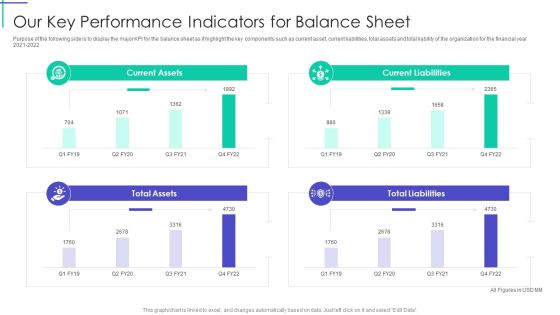
Mortgage Recovery Strategy For Finance Companies Our Key Performance Indicators For Balance Sheet Inspiration PDF
Purpose of the following side is to display the major KPI for the balance sheet as it highlight the key components such as current asset, current liabilities, total assets and total liability of the organization for the financial year 2021 to 2022. Deliver an awe inspiring pitch with this creative Mortgage Recovery Strategy For Finance Companies Our Key Performance Indicators For Balance Sheet Inspiration PDF bundle. Topics like Current Assets, Current Liabilities, Total Liabilities can be discussed with this completely editable template. It is available for immediate download depending on the needs and requirements of the user.

Key Performance Indicator For Sales And Marketing Business Plan Review Brochure PDF
The following slide showcases components of various department to track record and make further improvement plans. The key departments covered are marketing, sales and workforce and their status and owner. Pitch your topic with ease and precision using this Key Performance Indicator For Sales And Marketing Business Plan Review Brochure PDF. This layout presents information on Marketing, Sales, Workforce. It is also available for immediate download and adjustment. So, changes can be made in the color, design, graphics or any other component to create a unique layout.
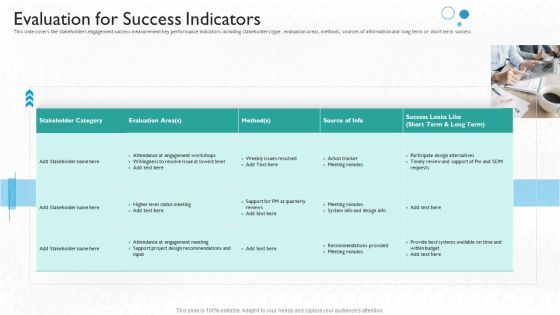
Partner Engagement Planning Procedure Evaluation For Success Indicators Mockup PDF
This slide covers the stakeholders engagement success measurement key performance indicators including stakeholders type, evaluation areas, methods, sources of information and long term or short term success. Deliver an awe-inspiring pitch with this creative partner engagement planning procedure evaluation for success indicators mockup pdf bundle. Topics like evaluation area, success, measurement, stakeholders, key performance can be discussed with this completely editable template. It is available for immediate download depending on the needs and requirements of the user.
Operational Risk Metrics Dashboard Icon Mockup PDF
Presenting Operational Risk Metrics Dashboard Icon Mockup PDF to dispense important information. This template comprises four stages. It also presents valuable insights into the topics including Operational Risk Metrics Dashboard Icon. This is a completely customizable PowerPoint theme that can be put to use immediately. So, download it and address the topic impactfully.

KPI Dashboard Metrics Security Icon Download PDF
Persuade your audience using this KPI Dashboard Metrics Security Icon Download PDF. This PPT design covers two stages, thus making it a great tool to use. It also caters to a variety of topics including Kpi Dashboard, Metrics Security Icon. Download this PPT design now to present a convincing pitch that not only emphasizes the topic but also showcases your presentation skills.

Maintenance Performance Metrics Dashboard Icon Inspiration PDF
Presenting Maintenance Performance Metrics Dashboard Icon Inspiration PDF to dispense important information. This template comprises three stages. It also presents valuable insights into the topics including Maintenance Performance, Metrics Dashboard Icon. This is a completely customizable PowerPoint theme that can be put to use immediately. So, download it and address the topic impactfully.

Performance Measurement Approaches Ppt PowerPoint Presentation Summary
Presenting this set of slides with name performance measurement approaches ppt powerpoint presentation summary. This is an editable Powerpoint five stages graphic that deals with topics like performance measurement approaches to help convey your message better graphically. This product is a premium product available for immediate download, and is 100 percent editable in Powerpoint. Download this now and use it in your presentations to impress your audience.

Determine IT Staff Performance Measurement Elements PDF
This slide provides information regarding IT staff performance measurement in terms of cost, quality, productivity and service level. Deliver and pitch your topic in the best possible manner with this Determine IT Staff Performance Measurement Elements PDF. Use them to share invaluable insights on Productivity, Quality, Cost and impress your audience. This template can be altered and modified as per your expectations. So, grab it now.

Supply Chain Metrics And Kpi Examples Presentation Visuals
This is a supply chain metrics and kpi examples presentation visuals. This is a four stage process. The stages in this process are carrying cost of inventory, inventory turnover, order tracking, rate of return.
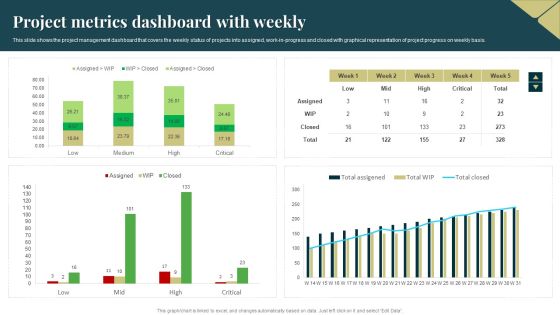
Project Metrics Dashboard With Weekly Formats PDF
This slide shows the project management dashboard that covers the weekly status of projects into assigned, work in progress and closed with graphical representation of project progress on weekly basis. Showcasing this set of slides titled Project Metrics Dashboard With Weekly Formats PDF. The topics addressed in these templates are Project Metrics, Dashboard With Weekly. All the content presented in this PPT design is completely editable. Download it and make adjustments in color, background, font etc. as per your unique business setting.
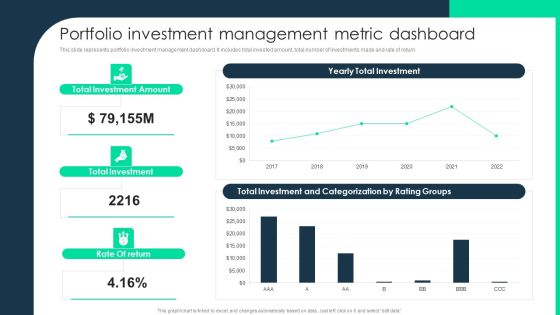
Portfolio Investment Management Metric Dashboard Brochure PDF
This slide represents portfolio investment management dashboard. It includes total invested amount, total number of investments made and rate of return. Deliver an awe inspiring pitch with this creative Portfolio Investment Management Metric Dashboard Brochure PDF bundle. Topics like Portfolio Investment Management, Metric Dashboard can be discussed with this completely editable template. It is available for immediate download depending on the needs and requirements of the user.

Portfolio Investment Management Metric Dashboard Slides PDF
This slide represents portfolio investment management dashboard. It includes total invested amount, total number of investments made and rate of return. Deliver an awe inspiring pitch with this creative Portfolio Investment Management Metric Dashboard Slides PDF bundle. Topics like Portfolio Investment Management, Metric Dashboard can be discussed with this completely editable template. It is available for immediate download depending on the needs and requirements of the user.

Metric Ruler For Length Measurement Ppt Powerpoint Presentation Pictures Good
This is a metric ruler for length measurement ppt powerpoint presentation pictures good. This is a three stage process. The stages in this process are dimensions, size, measurements.

Metrics Measure Talent Management Ppt PowerPoint Presentation Slides Maker Cpb
This is a metrics measure talent management ppt powerpoint presentation slides maker cpb. This is a three stage process. The stages in this process are metrics measure talent management.
Performance Measurement Metrics Examples Ppt PowerPoint Presentation Summary Slides Cpb
This is a performance measurement metrics examples ppt powerpoint presentation summary slides cpb. This is a two stage process. The stages in this process are performance measurement metrics examples.

Key Performance Indicator Tree Variable Revenue Ppt PowerPoint Presentation Complete Deck With Slides
This key performance indicator tree variable revenue ppt powerpoint presentation complete deck with slides acts as backup support for your ideas, vision, thoughts, etc. Use it to present a thorough understanding of the topic. This PPT slideshow can be utilized for both in-house and outside presentations depending upon your needs and business demands. Entailing twelve slides with a consistent design and theme, this template will make a solid use case. As it is intuitively designed, it suits every business vertical and industry. All you have to do is make a few tweaks in the content or any other component to design unique presentations. The biggest advantage of this complete deck is that it can be personalized multiple times once downloaded. The color, design, shapes, and other elements are free to modify to add personal touches. You can also insert your logo design in this PPT layout. Therefore a well-thought and crafted presentation can be delivered with ease and precision by downloading this key performance indicator tree variable revenue ppt powerpoint presentation complete deck with slides PPT slideshow.

Risk Metrics Dashboard Showing Priorities Infographics PDF
This slide illustrates graphical representation of corporate risk data. It includes monthly risks with their priorities, and risk summary quarter wise. Showcasing this set of slides titled Risk Metrics Dashboard Showing Priorities Infographics PDF. The topics addressed in these templates are Risk Metrics Dashboard Showing Priorities. All the content presented in this PPT design is completely editable. Download it and make adjustments in color, background, font etc. as per your unique business setting.

Financial Metrics And Kpi Template Presentation Visual Aids
This is a financial metrics and kpi template presentation visual aids. This is a three stage process. The stages in this process are operating profit last 12 months, total income act vs forecast between 2009 and 2010, income by qtr by tr between 2007 and 2010.
Key Performance Indicators Comparison Analysis Ppt PowerPoint Presentation Complete Deck With Slides
Improve your presentation delivery using this Key Performance Indicators Comparison Analysis Ppt PowerPoint Presentation Complete Deck With Slides. Support your business vision and objectives using this well-structured PPT deck. This template offers a great starting point for delivering beautifully designed presentations on the topic of your choice. Comprising twalve this professionally designed template is all you need to host discussion and meetings with collaborators. Each slide is self-explanatory and equipped with high-quality graphics that can be adjusted to your needs. Therefore, you will face no difficulty in portraying your desired content using this PPT slideshow. This PowerPoint slideshow contains every important element that you need for a great pitch. It is not only editable but also available for immediate download and utilization. The color, font size, background, shapes everything can be modified to create your unique presentation layout. Therefore, download it now.

Advertising Key Performance Indicators Ppt PowerPoint Presentation Complete Deck With Slides
Improve your presentation delivery using this Advertising Key Performance Indicators Ppt PowerPoint Presentation Complete Deck With Slides. Support your business vision and objectives using this well-structured PPT deck. This template offers a great starting point for delivering beautifully designed presentations on the topic of your choice. Comprising fourteen this professionally designed template is all you need to host discussion and meetings with collaborators. Each slide is self-explanatory and equipped with high-quality graphics that can be adjusted to your needs. Therefore, you will face no difficulty in portraying your desired content using this PPT slideshow. This PowerPoint slideshow contains every important element that you need for a great pitch. It is not only editable but also available for immediate download and utilization. The color, font size, background, shapes everything can be modified to create your unique presentation layout. Therefore, download it now.

Employee Key Performance Indicators Ppt PowerPoint Presentation Complete Deck With Slides
Boost your confidence and team morale with this well-structured Employee Key Performance Indicators Ppt PowerPoint Presentation Complete Deck With Slides This prefabricated set gives a voice to your presentation because of its well-researched content and graphics. Our experts have added all the components very carefully, thus helping you deliver great presentations with a single click. Not only that, it contains a set of eighteen slides that are designed using the right visuals, graphics, etc. Various topics can be discussed, and effective brainstorming sessions can be conducted using the wide variety of slides added in this complete deck. Apart from this, our PPT design contains clear instructions to help you restructure your presentations and create multiple variations. The color, format, design anything can be modified as deemed fit by the user. Not only this, it is available for immediate download. So, grab it now.

Boosting Yearly Business Revenue Go To Market Funnel With Key Performance Indicators Inspiration PDF
This slide shows framework on expansion of go to market strategy to increase customer conversion rate. It includes five stages like inquiry, marketing qualified lead, sales accepted , qualified lead and total closing. Coming up with a presentation necessitates that the majority of the effort goes into the content and the message you intend to convey. The visuals of a PowerPoint presentation can only be effective if it supplements and supports the story that is being told. Keeping this in mind our experts created Boosting Yearly Business Revenue Go To Market Funnel With Key Performance Indicators Inspiration PDF to reduce the time that goes into designing the presentation. This way, you can concentrate on the message while our designers take care of providing you with the right template for the situation.

Employee Production Scorecard With Product Revenue Balanced Scorecard For Manufacturing Workforce Demonstration PDF
Deliver and pitch your topic in the best possible manner with this Employee Production Scorecard With Product Revenue Balanced Scorecard For Manufacturing Workforce Demonstration PDF. Use them to share invaluable insights on Employee Production Scorecard, Product Revenue and impress your audience. This template can be altered and modified as per your expectations. So, grab it now.

New Commodity Market Viability Review Product Performance Dashboards Guidelines PDF
The following slide displays the dashboard which highlights the performance of the product, multiple metrics such as Revenues, New customer, gross profit, customer satisfaction and global sales breakdown Deliver and pitch your topic in the best possible manner with this New Commodity Market Viability Review Product Performance Dashboards Guidelines PDF Use them to share invaluable insights on Gross Profit, Customer Satisfaction, Product Category and impress your audience. This template can be altered and modified as per your expectations. So, grab it now.

Dashboard Showing Construction Project Metrics Sample PDF
This slide shows the dashboard which depicts the construction project management performance such as billing date, working profit, total cost, billed percentage, budget spent, completed projects and comparison of two companies about revenues earned from project. Showcasing this set of slides titled Dashboard Showing Construction Project Metrics Sample PDF. The topics addressed in these templates are Dashboard, Construction Project Metrics. All the content presented in this PPT design is completely editable. Download it and make adjustments in color, background, font etc. as per your unique business setting.

Project Metrics Dashboard Showing Dependencies Brochure PDF
This slide covers the project management dashboard which shows the risks, assumptions, issues, dependencies, repairs and maintenance with starting and resolution date, version, overall status that is recovering, name of the owner, etc. Showcasing this set of slides titled Project Metrics Dashboard Showing Dependencies Brochure PDF. The topics addressed in these templates are Project Metrics, Dashboard Showing Dependencies. All the content presented in this PPT design is completely editable. Download it and make adjustments in color, background, font etc. as per your unique business setting.

Project Metrics Dashboard With Priorities Formats PDF
This slide focuses on project management dashboard which covers the reporting date of project, different tasks such as setting kick-off meeting, final resource planning, staffing, testing, hardware configuration, etc. with pending items such as decisions, actions and requests. Showcasing this set of slides titled Project Metrics Dashboard With Priorities Formats PDF. The topics addressed in these templates are Budget, Project Metrics Dashboard. All the content presented in this PPT design is completely editable. Download it and make adjustments in color, background, font etc. as per your unique business setting.

KPI Dashboard To Monitor E Commerce Revenue Analysis Performance Mockup PDF
This slide shows the key performance indicators dashboard which can be used to analyze current financial position of e-commerce business. It includes metrics such as revenue, expenses, profit, cash in hand, etc. Showcasing this set of slides titled KPI Dashboard To Monitor E Commerce Revenue Analysis Performance Mockup PDF. The topics addressed in these templates are Accounts Receivable, Accounts Payable, Revenue, Expenses. All the content presented in this PPT design is completely editable. Download it and make adjustments in color, background, font etc. as per your unique business setting.

Dashboard Depicting Customer Accomplishment Metrics Slides PDF
This slide covers the dashboard that depicts customer success metrics which includes total number of customers, net promoter score, support tickets, opportunities, contacts which are active and inactive, customer journey such as onboarding, growth, value achieved, renewal, etc. Showcasing this set of slides titled dashboard depicting customer accomplishment metrics slides pdf. The topics addressed in these templates are customers, unhealthy, support tickets. All the content presented in this PPT design is completely editable. Download it and make adjustments in color, background, font etc. as per your unique business setting.
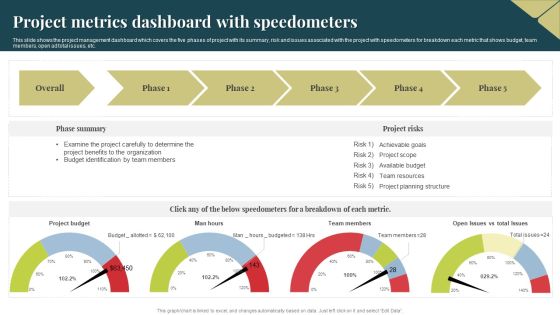
Project Metrics Dashboard With Speedometers Themes PDF
This slide shows the project management dashboard which covers the five phases of project with its summary, risk and issues associated with the project with speedometers for breakdown each metric that shows budget, team members, open ad total issues, etc. Showcasing this set of slides titled Project Metrics Dashboard With Speedometers Themes PDF. The topics addressed in these templates are Budget, Project Benefits, Organization. All the content presented in this PPT design is completely editable. Download it and make adjustments in color, background, font etc. as per your unique business setting.
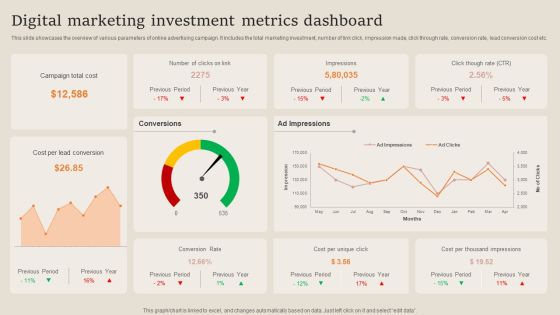
Digital Marketing Investment Metrics Dashboard Professional PDF
This slide showcases the overview of various parameters of online advertising campaign. It includes the total marketing investment, number of link click, impression made, click through rate, conversion rate, lead conversion cost etc. Showcasing this set of slides titled Digital Marketing Investment Metrics Dashboard Professional PDF. The topics addressed in these templates are Campaign Total Cost, Cost Per Lead Conversion, Investment Metrics Dashboard. All the content presented in this PPT design is completely editable. Download it and make adjustments in color, background, font etc. as per your unique business setting.

Dashboard Depicting Construction Project Metrics Inspiration PDF
This slide states the construction project management dashboard which includes estimated costs and duration, site inspections, status of regional projects, name of customers from different countries, etc. Pitch your topic with ease and precision using this Dashboard Depicting Construction Project Metrics Inspiration PDF. This layout presents information on Estimated Cost, Estimated Duration, Projects. It is also available for immediate download and adjustment. So, changes can be made in the color, design, graphics or any other component to create a unique layout.
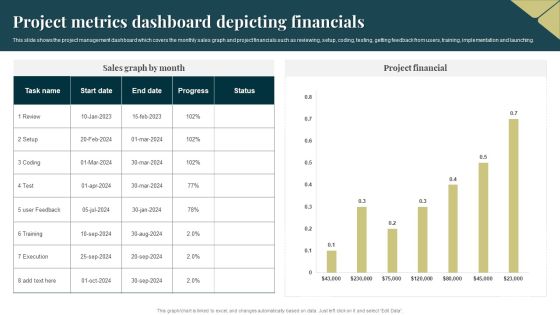
Project Metrics Dashboard Depicting Financials Pictures PDF
This slide shows the project management dashboard which covers the monthly sales graph and project financials such as reviewing, setup, coding, testing, getting feedback from users, training, implementation and launching. Pitch your topic with ease and precision using this Project Metrics Dashboard Depicting Financials Pictures PDF. This layout presents information on Execution, Project Financial. It is also available for immediate download and adjustment. So, changes can be made in the color, design, graphics or any other component to create a unique layout.

Project Metrics Dashboard With Commitments Mockup PDF
This slide focuses on the project management dashboard which includes the actual income, status, duration progress, project health with work schedule and budget, expenses, commitments, current status such as order, revised, billed, etc. Showcasing this set of slides titled Project Metrics Dashboard With Commitments Mockup PDF. The topics addressed in these templates are Expenses, Budget, Average. All the content presented in this PPT design is completely editable. Download it and make adjustments in color, background, font etc. as per your unique business setting.
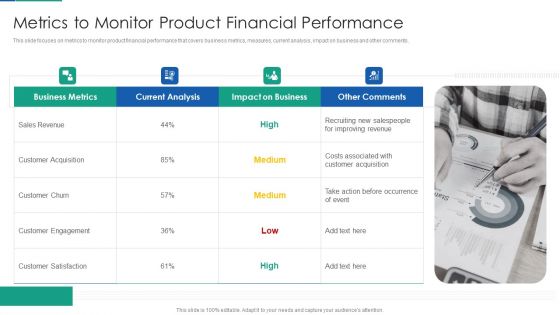
Agile Product Life Process Management Metrics To Monitor Product Financial Performance Ideas PDF
This slide focuses on metrics to monitor product financial performance that covers business metrics, measures, current analysis, impact on business and other comments. Presenting agile product life process management metrics to monitor product financial performance ideas pdf to provide visual cues and insights. Share and navigate important information on four stages that need your due attention. This template can be used to pitch topics like metrics to monitor product financial performance . In addtion, this PPT design contains high resolution images, graphics, etc, that are easily editable and available for immediate download.
Measurement Gauge Vector Icon Ppt PowerPoint Presentation File Infographics PDF
Presenting this set of slides with name measurement gauge vector icon ppt powerpoint presentation file infographics pdf. This is a three stage process. The stages in this process are measurement gauge vector icon. This is a completely editable PowerPoint presentation and is available for immediate download. Download now and impress your audience.

Investment Performance Measurement Dashboard Ppt Sample
This is an investment performance measurement dashboard ppt sample. This is a three stage process. The stages in this process are infrastructure, property, credit opportunities.

Kpi Metric Dashboard Diagram Ppt Example
This is a kpi metric dashboard diagram ppt example. This is a seven stage process. The stages in this process are avg cost hour, safety inspection score, on time shipment, ndt acceptance rate, ncr customer accept, annual pipeline value, indirect man hours.

Measurement Metrics And Rules For BCWP Project Management Introduction PDF
Showcasing this set of slides titled Measurement Metrics And Rules For BCWP Project Management Introduction PDF The topics addressed in these templates are Measurement Metrics, Breakdown Structure, Schedule Tasks All the content presented in this PPT design is completely editable. Download it and make adjustments in color, background, font etc. as per your unique business setting.
Icon Showcasing Metric To Measure Workforce Diversity Elements PDF
Persuade your audience using this Icon Showcasing Metric To Measure Workforce Diversity Elements PDF. This PPT design covers three stages, thus making it a great tool to use. It also caters to a variety of topics including Showcasing Metric, Measure Workforce, Diversity. Download this PPT design now to present a convincing pitch that not only emphasizes the topic but also showcases your presentation skills.

KPI Dashboard To Track Automation Performance In Employee Onboarding Introduction PDF
The following slide outlines performance key performance indicator KPI which can be used to evaluate business process automation performance in employee onboarding. The metrics highlighted in the slide are onboarding completion status, hires per office, etc. Deliver an awe inspiring pitch with this creative KPI Dashboard To Track Automation Performance In Employee Onboarding Introduction PDF bundle. Topics like Onboarding Completion Status, Onboardings In Progress, Employee Onboarding can be discussed with this completely editable template. It is available for immediate download depending on the needs and requirements of the user.

KPI Dashboard To Track Automation Performance In Employee Onboarding Achieving Operational Efficiency Download PDF
The following slide outlines performance key performance indicator KPI which can be used to evaluate business process automation performance in employee onboarding. The metrics highlighted in the slide are onboarding completion status, hires per office, etc.Deliver an awe inspiring pitch with this creative KPI Dashboard To Track Automation Performance In Employee Onboarding Achieving Operational Efficiency Download PDF bundle. Topics like Onboarding Completion, Onboarding, Onboarding Completion can be discussed with this completely editable template. It is available for immediate download depending on the needs and requirements of the user.

B2B Marketing Performance Metrics To Measure Effectiveness Themes PDF
This slide represents B2B marketing performance metrics to measure effectiveness, illustrating requirement-centric, branding-centric, revenue-centric, objectives, and performance metrics.Showcasing this set of slides titled B2B Marketing Performance Metrics To Measure Effectiveness Themes PDF The topics addressed in these templates are Revenue Centric, Branding Centric, Requirement Centric All the content presented in this PPT design is completely editable. Download it and make adjustments in color, background, font etc. as per your unique business setting.

Metrics To Measure Content Marketing Effectiveness Guidelines PDF
This slide represents metrics to measure content marketing effectiveness, illustrating metrics such as blog traffic, email subscription, conversion rate, social media, and SEO performance.Showcasing this set of slides titled Metrics To Measure Content Marketing Effectiveness Guidelines PDF The topics addressed in these templates are Conversion Rate, Email Subscription, Social Media All the content presented in this PPT design is completely editable. Download it and make adjustments in color, background, font etc. as per your unique business setting.
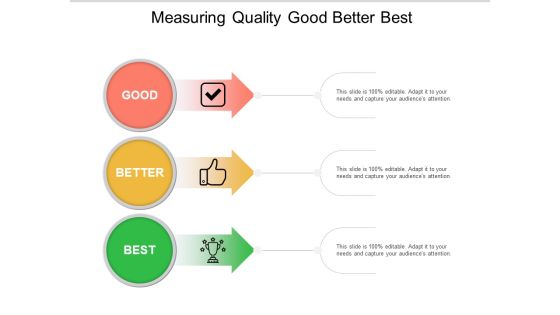
Measuring Quality Good Better Best Ppt Powerpoint Presentation Inspiration Mockup
This is a measuring quality good better best ppt powerpoint presentation inspiration mockup. This is a three stage process. The stages in this process are good better best, good great superb, good great excellent.

Brand Equity Tactics Measurement Metrics With Monetary Value Graphics PDF
This slide contains measuring metrics of brand equity. The purpose of such metrics is to measure brand equity from both quantitative and qualitative aspects. The basis of measuring the brand equity are monetary value, perceived value, brand awareness and loyalty value. Presenting Brand Equity Tactics Measurement Metrics With Monetary Value Graphics PDF to dispense important information. This template comprises three stages. It also presents valuable insights into the topics including Monetary Value, Perceived Value, Brand Awareness Loyalty Value. This is a completely customizable PowerPoint theme that can be put to use immediately. So, download it and address the topic impactfully.
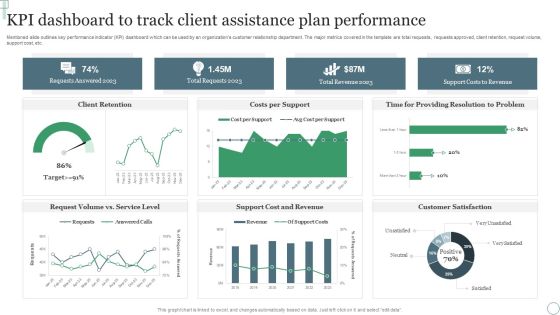
KPI Dashboard To Track Client Assistance Plan Performance Ppt Professional Outfit PDF
Mentioned slide outlines key performance indicator KPI dashboard which can be used by an organizations customer relationship department. The major metrics covered in the template are total requests, requests approved, client retention, request volume, support cost, etc. Pitch your topic with ease and precision using this KPI Dashboard To Track Client Assistance Plan Performance Ppt Professional Outfit PDF. This layout presents information on Requests Answered 2023, Total Requests 2023, Total Revenue 2023. It is also available for immediate download and adjustment. So, changes can be made in the color, design, graphics or any other component to create a unique layout.

Dashboard Showing Project Portfolio Metrics Microsoft PDF
This slide shows the dashboard that depicts the project portfolio management which covers the quarterly project delivery roadmap and health card with project funding, resource allocation, portfolio risks such as open change requests, open risks and issues, etc. Pitch your topic with ease and precision using this Dashboard Showing Project Portfolio Metrics Microsoft PDF. This layout presents information on Resource Allocation, Portfolio Risks, Project Funding. It is also available for immediate download and adjustment. So, changes can be made in the color, design, graphics or any other component to create a unique layout.

Erp Project Metrics Plan Dashboard Slides PDF
This slide focuses on project management dashboard for enterprise resource planning which covers the total hours spent that includes project preparation, business blueprint, project realization, final preparation, go live and support with gantt chart showing detailed tasks. Pitch your topic with ease and precision using this Erp Project Metrics Plan Dashboard Slides PDF. This layout presents information on Business Blueprint, Project Preparation, Project Realization. It is also available for immediate download and adjustment. So, changes can be made in the color, design, graphics or any other component to create a unique layout.
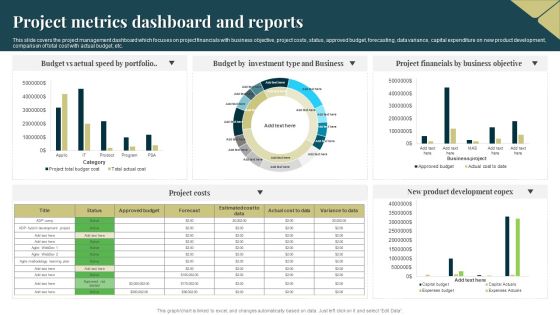
Project Metrics Dashboard And Reports Portrait PDF
This slide covers the project management dashboard which focuses on project financials with business objective, project costs, status, approved budget, forecasting, data variance, capital expenditure on new product development, comparison of total cost with actual budget, etc. Showcasing this set of slides titled Project Metrics Dashboard And Reports Portrait PDF. The topics addressed in these templates are Budget, Portfolio, Investment. All the content presented in this PPT design is completely editable. Download it and make adjustments in color, background, font etc. as per your unique business setting.
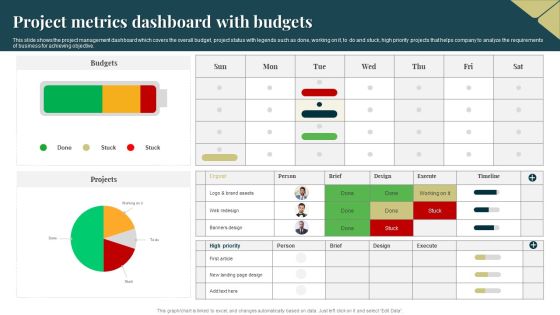
Project Metrics Dashboard With Budgets Topics PDF
This slide shows the project management dashboard which covers the overall budget, project status with legends such as done, working on it, to do and stuck, high priority projects that helps company to analyze the requirements of business for achieving objective. Pitch your topic with ease and precision using this Project Metrics Dashboard With Budgets Topics PDF. This layout presents information on Budgets, Projects, Banners Design. It is also available for immediate download and adjustment. So, changes can be made in the color, design, graphics or any other component to create a unique layout.
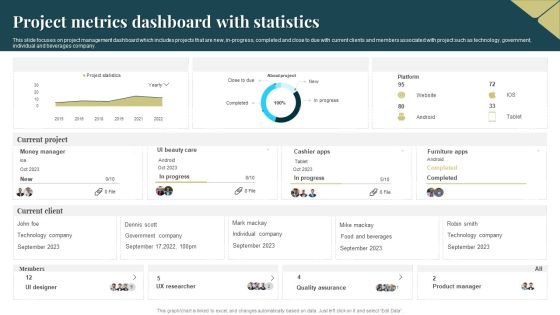
Project Metrics Dashboard With Statistics Slides PDF
This slide focuses on project management dashboard which includes projects that are new, in progress, completed and close to due with current clients and members associated with project such as technology, government, individual and beverages company. Showcasing this set of slides titled Project Metrics Dashboard With Statistics Slides PDF. The topics addressed in these templates are Quality Assurance, Product Manager, Technology. All the content presented in this PPT design is completely editable. Download it and make adjustments in color, background, font etc. as per your unique business setting.
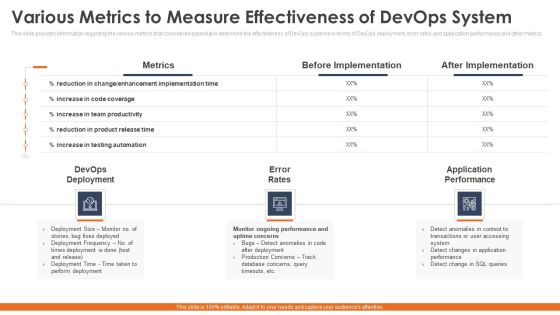
Various Metrics To Measure Effectiveness Of Devops System Slides PDF
This slide provides information regarding the various metrics that considered essential in determine the effectiveness of DevOps systems in terms of DevOps deployment, error rates and application performance and other metrics. Presenting various metrics to measure effectiveness of devops system slides pdf to provide visual cues and insights. Share and navigate important information on three stages that need your due attention. This template can be used to pitch topics like various metrics to measure effectiveness of devops system. In addtion, this PPT design contains high resolution images, graphics, etc, that are easily editable and available for immediate download.

Business Achievements Example Ppt Presentation
This is a business achievements example ppt presentation. This is a three stage process. The stages in this process are partners in 25 countries, 200 stores, product ready.

Measuring Employee Engagement Metrics Ppt PowerPoint Presentation Model Portfolio Cpb
Presenting this set of slides with name measuring employee engagement metrics. This is an editable Powerpoint four stages graphic that deals with topics like measuring employee engagement metrics to help convey your message better graphically. This product is a premium product available for immediate download and is 100 percent editable in Powerpoint. Download this now and use it in your presentations to impress your audience.

Metrics Measure Business Effectiveness Ppt PowerPoint Presentation Graphics
Presenting this set of slides with name metrics measure business effectiveness ppt powerpoint presentation graphics. This is an editable Powerpoint five stages graphic that deals with topics like metrics measure business effectiveness to help convey your message better graphically. This product is a premium product available for immediate download and is 100 percent editable in Powerpoint. Download this now and use it in your presentations to impress your audience.

Metrics Measure Compliance Effectiveness Ppt PowerPoint Presentation Background Cpb
Presenting this set of slides with name metrics measure compliance effectiveness ppt powerpoint presentation background cpb. This is an editable Powerpoint eight stages graphic that deals with topics like metrics measure compliance effectiveness to help convey your message better graphically. This product is a premium product available for immediate download and is 100 percent editable in Powerpoint. Download this now and use it in your presentations to impress your audience.
Measuring Website Metrics Ppt PowerPoint Presentation Outline Background Cpb
Presenting this set of slides with name measuring website metrics ppt powerpoint presentation outline backgroun. This is an editable Powerpoint four stages graphic that deals with topics like measuring website metrics to help convey your message better graphically. This product is a premium product available for immediate download and is 100 percent editable in Powerpoint. Download this now and use it in your presentations to impress your audience.

Analytical Incrementalism Business Performance Measurement Metrics Sales Infographics PDF
The purpose of this slide is to provide a glimpse about the business marketing performance measurement metrics after logical incrementalism approach. Deliver an awe-inspiring pitch with this creative analytical incrementalism business performance measurement metrics sales infographics pdf bundle. Topics like gross profit margin, revenue, quick ratio can be discussed with this completely editable template. It is available for immediate download depending on the needs and requirements of the user.

Analytical Incrementalism Business Performance Measurement Metrics Download PDF
The purpose of this slide is to provide a glimpse about the business marketing performance measurement metrics after logical incrementalism approach. Deliver an awe-inspiring pitch with this creative analytical incrementalism business performance measurement metrics download pdf bundle. Topics like sales revenue, new customer, sales growth, sales region performance, profit can be discussed with this completely editable template. It is available for immediate download depending on the needs and requirements of the user.

Metrics To Measure Recruitment Process By HR Department Graphics PDF
This slide shows the metrics to measure recruitment process by human resource department which covers total applications, shortlisted candidates, time to recruit, cost to hire, etc.Deliver an awe inspiring pitch with this creative Metrics To Measure Recruitment Process By HR Department Graphics PDF bundle. Topics like Applications Received, Applicant Information, Rejected Candidates can be discussed with this completely editable template. It is available for immediate download depending on the needs and requirements of the user.

Metrics To Measure Recruitment Process By HR Department Guidelines PDF
This slide shows the metrics to measure recruitment process by human resource department which covers total applications, shortlisted candidates, time to recruit, cost to hire, etc.Deliver and pitch your topic in the best possible manner with this Metrics To Measure Recruitment Process By HR Department Guidelines PDF. Use them to share invaluable insights on Applications Received, Positions Department, Applications Received and impress your audience. This template can be altered and modified as per your expectations. So, grab it now.
Performance Measurement Business Metrices Pyramid Icon Infographics PDF
Persuade your audience using this Performance Measurement Business Metrices Pyramid Icon Infographics PDF. This PPT design covers three stages, thus making it a great tool to use. It also caters to a variety of topics including Performance Measurement, Business Metrices, Pyramid Icon . Download this PPT design now to present a convincing pitch that not only emphasizes the topic but also showcases your presentation skills.

Various Metrics To Measure Effectiveness Of Devops System Rules PDF
This slide provides information regarding the various metrics that considered essential in determine the effectiveness of DevOps systems in terms of DevOps deployment, error rates and application performance and other metrics. Deliver an awe inspiring pitch with this creative various metrics to measure effectiveness of devops system rules pdf bundle. Topics like devops, deployment, performance can be discussed with this completely editable template. It is available for immediate download depending on the needs and requirements of the user.

Setting Up Metrics For Measuring Critical Applicating Performance Clipart PDF
Deliver and pitch your topic in the best possible manner with this setting up metrics for measuring critical applicating performance clipart pdf. Use them to share invaluable insights on service and support, performance, evaluation scoring metrics and impress your audience. This template can be altered and modified as per your expectations. So, grab it now.

Client Acquisition Cost Measurement Dashboard Infographics PDF
This slide shows a Client Acquisition Cost CAC Measurement Dashboard with details such as total customers, employee satisfaction rate, number of trials, monthly active users, NPS net promoter score etc. Deliver an awe inspiring pitch with this creative client acquisition cost measurement dashboard infographics pdf bundle. Topics like funnel conversion rate, opportunity, key takeaways can be discussed with this completely editable template. It is available for immediate download depending on the needs and requirements of the user.

B2B Prospects Performance Measurement Dashboard Ideas PDF
This slide provides information regarding B2B performance tracking dashboard to measure leads, MQL, SQL, customers, revenue goals, total media spend. Deliver an awe inspiring pitch with this creative b2b prospects performance measurement dashboard ideas pdf bundle. Topics like ineffective in managing requirements, essential points are catered, understanding of company can be discussed with this completely editable template. It is available for immediate download depending on the needs and requirements of the user.

B2B Prospects Performance Measurement Dashboard Guidelines PDF
This slide provides information regarding B2B performance tracking dashboard to measure leads, MQL, SQL, customers, revenue goals, total media spend. Deliver an awe inspiring pitch with this creative B2B Prospects Performance Measurement Dashboard Guidelines PDF bundle. Topics like Customers, Leads, Revenue Goal can be discussed with this completely editable template. It is available for immediate download depending on the needs and requirements of the user.

Data Quality Scorecard Metrics Ppt PowerPoint Presentation Gallery Rules Cpb Pdf
Presenting this set of slides with name data quality scorecard metrics ppt powerpoint presentation gallery rules cpb pdf. This is an editable Powerpoint four stages graphic that deals with topics like data quality scorecard metrics to help convey your message better graphically. This product is a premium product available for immediate download and is 100 percent editable in Powerpoint. Download this now and use it in your presentations to impress your audience.

Client Complaints Resolving Procedures Dashboard Download PDF
This slide showcases customer complaint handling process key performance indicator dashboard. It also includes key metrics such as traffic analysis , closed tickets , tickets statistics , etc. Showcasing this set of slides titled Client Complaints Resolving Procedures Dashboard Download PDF The topics addressed in these templates are Customer Traffic, Average Tickets Reply Time, Resolving Procedures Dashboard. All the content presented in this PPT design is completely editable. Download it and make adjustments in color, background, font etc. as per your unique business setting.

Service Level Agreement With Measurement And Performance Metric Themes PDF
Pitch your topic with ease and precision using this service level agreement with measurement and performance metric themes pdf. This layout presents information on service, measurement, target. It is also available for immediate download and adjustment. So, changes can be made in the color, design, graphics or any other component to create a unique layout.

Metrics To Measure Online Interaction Strategy Effectiveness Professional PDF
Showcasing this set of slides titled Metrics To Measure Online Interaction Strategy Effectiveness Professional PDF. The topics addressed in these templates are Measure Online, Interaction Strategy, Effectiveness . All the content presented in this PPT design is completely editable. Download it and make adjustments in color, background, font etc. as per your unique business setting.
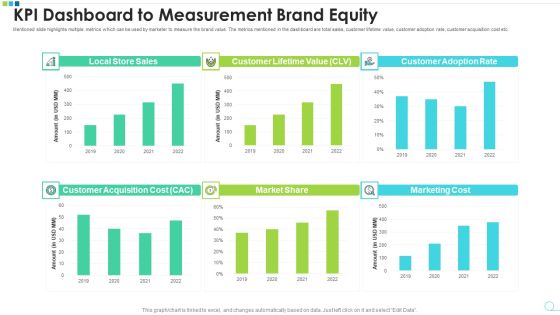
KPI Dashboard To Measurement Brand Equity Microsoft PDF
Mentioned slide highlights multiple metrics which can be used by marketer to measure the brand value. The metrics mentioned in the dashboard are total sales, customer lifetime value, customer adoption rate, customer acquisition cost etc. Pitch your topic with ease and precision using this kpi dashboard to measurement brand equity microsoft pdf. This layout presents information on kpi dashboard to measurement brand equity. It is also available for immediate download and adjustment. So, changes can be made in the color, design, graphics or any other component to create a unique layout.
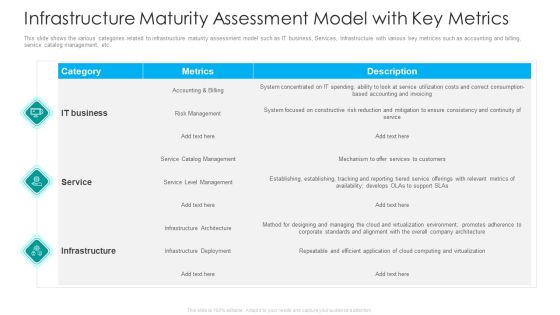
IT Facilities Maturity Framework For Strong Business Financial Position Infrastructure Maturity Assessment Model With Key Metrics Download PDF
This slide shows the various categories related to infrastructure maturity assessment model such as IT business, Services, Infrastructure with various key metrices such as accounting and billing, service catalog management, etc. Deliver an awe inspiring pitch with this creative it facilities maturity framework for strong business financial position infrastructure maturity assessment model with key metrics download pdf bundle. Topics like it business, service, infrastructure, risk management, deployment can be discussed with this completely editable template. It is available for immediate download depending on the needs and requirements of the user.
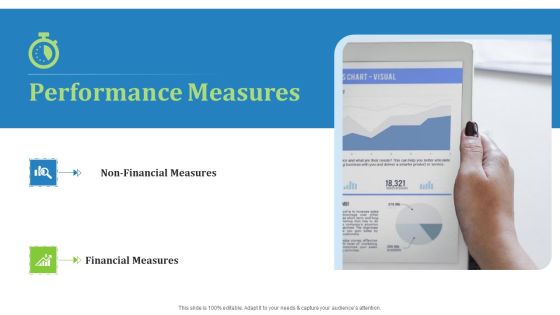
Supply Chain Management Operational Metrics Performance Measures Designs PDF
This is a supply chain management operational metrics performance measures designs pdf. template with various stages. Focus and dispense information on two stages using this creative set, that comes with editable features. It contains large content boxes to add your information on topics like NON financial measures, financial measures. You can also showcase facts, figures, and other relevant content using this PPT layout. Grab it now.

Email Newsletter Dashboard Showing Campaign Performance Ppt PowerPoint Presentation File Infographic Template PDF
The following slide showcases a key performance indicator KPI dashboard through which managers can measure the impact of email marketing strategy on business performance. The metrics covered in the slide are total conversions, new subscribers, etc. Coming up with a presentation necessitates that the majority of the effort goes into the content and the message you intend to convey. The visuals of a PowerPoint presentation can only be effective if it supplements and supports the story that is being told. Keeping this in mind our experts created Email Newsletter Dashboard Showing Campaign Performance Ppt PowerPoint Presentation File Infographic Template PDF to reduce the time that goes into designing the presentation. This way, you can concentrate on the message while our designers take care of providing you with the right template for the situation.

Enhancing Digital Visibility Using SEO Content Strategy KPI Dashboard To Evaluate Content Performance Diagrams PDF
This slide shows key performance indicators dashboard which can be used by content marketing managers to measure content performance. It includes metrics such as page views, social shares, content first touch, pipeline generated, etc. This modern and well arranged Enhancing Digital Visibility Using SEO Content Strategy KPI Dashboard To Evaluate Content Performance Diagrams PDF provides lots of creative possibilities. It is very simple to customize and edit with the Powerpoint Software. Just drag and drop your pictures into the shapes. All facets of this template can be edited with Powerpoint no extra software is necessary. Add your own material, put your images in the places assigned for them, adjust the colors, and then you can show your slides to the world, with an animated slide included.

Client Acquisition Cost Measurement Metrices Ppt Pictures Slide PDF
This slide shows graphical representation of Client acquisition cots metrics such as sales expenses, new customers acquired and CAC on quarterly basis. Deliver and pitch your topic in the best possible manner with this client acquisition cost measurement metrices ppt pictures slide pdf. Use them to share invaluable insights on sales expenses, new customer acquired, client acquisition cost and impress your audience. This template can be altered and modified as per your expectations. So, grab it now.

Weekly Sales Performance Metrics To Help Measure Success Ideas PDF
The following slide exhibits sales metrics to help measure success and translate data into action. It presents information related to deals won, activities completed, etc. Persuade your audience using this Weekly Sales Performance Metrics To Help Measure Success Ideas PDF. This PPT design covers four stages, thus making it a great tool to use. It also caters to a variety of topics including Completed Activities, Per User, New Deals Added, Deals Won, Deals Lost. Download this PPT design now to present a convincing pitch that not only emphasizes the topic but also showcases your presentation skills.

Various Metrics To Measure Effectiveness Of Devops System Portrait PDF
This slide provides information regarding the various metrics that considered essential in determine the effectiveness of DevOps systems in terms of DevOps deployment, error rates and application performance and other metrics. Presenting various metrics to measure effectiveness of devops system portrait pdf to provide visual cues and insights. Share and navigate important information on three stages that need your due attention. This template can be used to pitch topics like devops deployment, application performance, detect anomalies. In addtion, this PPT design contains high resolution images, graphics, etc, that are easily editable and available for immediate download.

Various Metrics To Measure Effectiveness Of Devops System Template PDF
This slide provides information regarding the various metrics that considered essential in determine the effectiveness of DevOps systems in terms of DevOps deployment, error rates and application performance and other metrics. Presenting various metrics to measure effectiveness of devops system template pdf to provide visual cues and insights. Share and navigate important information on three stages that need your due attention. This template can be used to pitch topics like devops deployment , application performance, detect anomalies. In addtion, this PPT design contains high resolution images, graphics, etc, that are easily editable and available for immediate download.
Progressive Business Performance Measurement Metrics Gross Ppt Styles Icon PDF
Presenting this set of slides with name progressive business performance measurement metrics gross ppt styles icon pdf. The topics discussed in these slides are gross profit margin, quick ratio, revenue vs expenses, current accounts payable vs receivable. This is a completely editable PowerPoint presentation and is available for immediate download. Download now and impress your audience.

Progressive Business Performance Measurement Metrics Sales Ppt Pictures Guidelines PDF
Presenting this set of slides with name progressive business performance measurement metrics sales ppt pictures guidelines pdf. The topics discussed in these slides are sales, growth, targeted, revenue, performance. This is a completely editable PowerPoint presentation and is available for immediate download. Download now and impress your audience.

Customer Funnel Metrics To Measure Purchasing Insights Summary PDF
Presenting customer funnel metrics to measure purchasing insights summary pdf to provide visual cues and insights. Share and navigate important information on five stages that need your due attention. This template can be used to pitch topics like acquisition, activation, retention, referral, revenue. In addtion, this PPT design contains high resolution images, graphics, etc, that are easily editable and available for immediate download.

Website Matrices And Measurement Dashboard Powerpoint Slides
This is a website matrices and measurement dashboard powerpoint slides. This is a four stage process. The stages in this process are feedback, compliment, wish, bug, website content, website design, others, traffic sources, search engines, refitting sites, direct, website content, website design, traffic from social networks, usa, germany, uk, canada, france, facebook, twitter, linkedin.
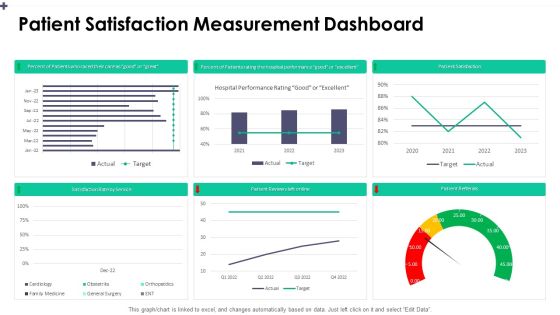
Patient Satisfaction Measurement Dashboard Slide2 Guidelines PDF
Deliver an awe inspiring pitch with this creative patient satisfaction measurement dashboard slide2 guidelines pdf bundle. Topics like percent of patients, percent of patients rating, patient reviews left online can be discussed with this completely editable template. It is available for immediate download depending on the needs and requirements of the user.

Patient Satisfaction Measurement Dashboard Graphics PDF
Deliver and pitch your topic in the best possible manner with this patient satisfaction measurement dashboard graphics pdf. Use them to share invaluable insights on patient satisfaction, lab test turnaround, average waiting times and impress your audience. This template can be altered and modified as per your expectations. So, grab it now.

Enhancing Client Engagement Measuring Customer Service Communication Metrics Graphics PDF
This slide focuses on customer service communication metrics such as first response time, average resolution time, customer service satisfaction, effort score, net promoter score, etc. Whether you have daily or monthly meetings, a brilliant presentation is necessary. Enhancing Client Engagement Measuring Customer Service Communication Metrics Graphics PDF can be your best option for delivering a presentation. Represent everything in detail using Enhancing Client Engagement Measuring Customer Service Communication Metrics Graphics PDF and make yourself stand out in meetings. The template is versatile and follows a structure that will cater to your requirements. All the templates prepared by Slidegeeks are easy to download and edit. Our research experts have taken care of the corporate themes as well. So, give it a try and see the results.

Dashboard To Measure Performance Of Social Media Retail Business Growth Marketing Techniques Ideas PDF
This following slide displays the key metrics that can help an organization to measure effectiveness of social media strategies. These can be leads generated, leads by region, web traffic targets etc If you are looking for a format to display your unique thoughts, then the professionally designed Dashboard To Measure Performance Of Social Media Retail Business Growth Marketing Techniques Ideas PDF is the one for you. You can use it as a Google Slides template or a PowerPoint template. Incorporate impressive visuals, symbols, images, and other charts. Modify or reorganize the text boxes as you desire. Experiment with shade schemes and font pairings. Alter, share or cooperate with other people on your work. Download Dashboard To Measure Performance Of Social Media Retail Business Growth Marketing Techniques Ideas PDF and find out how to give a successful presentation. Present a perfect display to your team and make your presentation unforgettable.

Dashboards To Measure Performance Of Mobile Retail Business Growth Marketing Techniques Professional PDF
This following slide displays the key metrics that can help an organization to measure effectiveness of mobile marketing strategies. These can be top performing campaigns, devises used for transactions etc. Crafting an eye catching presentation has never been more straightforward. Let your presentation shine with this tasteful yet straightforward Dashboards To Measure Performance Of Mobile Retail Business Growth Marketing Techniques Professional PDF template. It offers a minimalistic and classy look that is great for making a statement. The colors have been employed intelligently to add a bit of playfulness while still remaining professional. Construct the ideal Dashboards To Measure Performance Of Mobile Retail Business Growth Marketing Techniques Professional PDF that effortlessly grabs the attention of your audience. Begin now and be certain to wow your customers.

Cloud Performance Tracking Dashboard Professional PDF
This slide covers the Key performance indicators for tracking performance of the cloud such as violations break down, sources, rules and severity. Deliver an awe inspiring pitch with this creative Cloud Performance Tracking Dashboard Professional PDF bundle. Topics like Cloud Performance, Tracking Dashboard can be discussed with this completely editable template. It is available for immediate download depending on the needs and requirements of the user.

Success Metrics For Data Analytics Speculation Business Analysis Modification Toolkit Icons PDF
This slide shows the key success factors for evaluating the success of data analytics program. The foremost key metrics includes discovery, insights, outcomes and actions.Presenting Success Metrics For Data Analytics Speculation Business Analysis Modification Toolkit Icons PDF to provide visual cues and insights. Share and navigate important information on four stages that need your due attention. This template can be used to pitch topics like Observations Information, Generate Insights, Keys Success. In addtion, this PPT design contains high resolution images, graphics, etc, that are easily editable and available for immediate download.
Performance Analysis Of New Product Development Product Performance Dashboards Icons PDF
The following slide displays the dashboard which highlights the performance of the product, multiple metrics such as Revenues, New customer, gross profit, customer satisfaction and global sales breakdown. Deliver and pitch your topic in the best possible manner with this performance analysis of new product development product performance dashboards icons pdf. Use them to share invaluable insights on revenue, sales comparison, customer satisfaction, gross profit, new customers, sale by product category and impress your audience. This template can be altered and modified as per your expectations. So, grab it now.
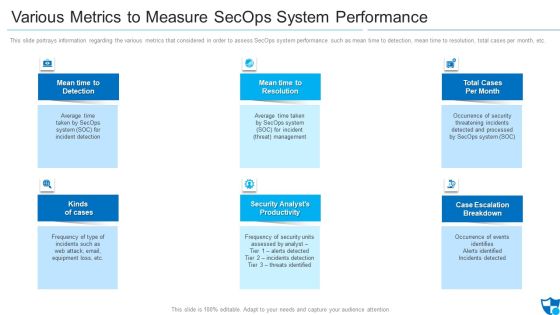
Various Metrics To Measure Secops System Performance Brochure PDF
This slide portrays information regarding the various metrics that considered in order to assess SecOps system performance such as mean time to detection, mean time to resolution, total cases per month, etc. This is a various metrics to measure secops system performance brochure pdf template with various stages. Focus and dispense information on six stages using this creative set, that comes with editable features. It contains large content boxes to add your information on topics like mean time to detection, mean time to resolution, total cases per month . You can also showcase facts, figures, and other relevant content using this PPT layout. Grab it now.

Business Metrics To Measure Client Service Team Performance Guidelines PDF
This slide shows essential metrics to be considered by support team of organization to attract and retain customers. It includes customer satisfaction score, average resolution and reply time. Presenting Business Metrics To Measure Client Service Team Performance Guidelines PDF to dispense important information. This template comprises three stages. It also presents valuable insights into the topics including Average Reply Time, Average Resolution Time, Customer Satisfaction Score. This is a completely customizable PowerPoint theme that can be put to use immediately. So, download it and address the topic impactfully.

Metrics For Measuring And Assessing Communication Tactics Sample PDF
This slide represents evaluation of communication approaches which industries utilize to expand and grow their business. Measurement strategies included in this slide are reach, engagement and outcomes. Persuade your audience using this Metrics For Measuring And Assessing Communication Tactics Sample PDF. This PPT design covers three stages, thus making it a great tool to use. It also caters to a variety of topics including Reach, Engagement, Outcomes . Download this PPT design now to present a convincing pitch that not only emphasizes the topic but also showcases your presentation skills

Measuring Influencer Marketing ROI Metric Brand Engagement Total Themes PDF
Analyze which posts drew the best engagement likes and comments. The feedback by customers help you gauge customers reactions to your products. Deliver an awe-inspiring pitch with this creative measuring influencer marketing roi metric brand engagement total themes pdf bundle. Topics like engagement over time, total engagement, engagement by content type can be discussed with this completely editable template. It is available for immediate download depending on the needs and requirements of the user.

Supply Chain Management Operational Metrics Financial Measures Ppt Backgrounds PDF
This is a supply chain management operational metrics financial measures ppt backgrounds pdf. template with various stages. Focus and dispense information on seven stages using this creative set, that comes with editable features. It contains large content boxes to add your information on topics like inventory holding cost, cost of goods return to supplier, inventory holding cost. You can also showcase facts, figures, and other relevant content using this PPT layout. Grab it now.

Supply Chain Management Operational Metrics Non Financial Measures Structure PDF
Presenting supply chain management operational metrics non financial measures structure pdf. to provide visual cues and insights. Share and navigate important information on five stages that need your due attention. This template can be used to pitch topics like backorder level, order to delivery lead time, supply chain lead time. In addtion, this PPT design contains high resolution images, graphics, etc, that are easily editable and available for immediate download.
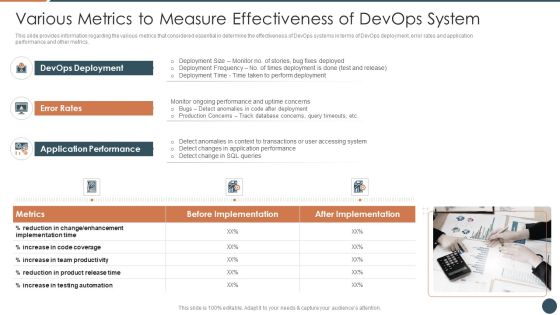
Various Metrics To Measure Effectiveness Of Devops System Introduction PDF
This is a various metrics to measure effectiveness of devops system introduction pdf template with various stages. Focus and dispense information on three stages using this creative set, that comes with editable features. It contains large content boxes to add your information on topics like devops deployment, application performance, error rates . You can also showcase facts, figures, and other relevant content using this PPT layout. Grab it now.

Scorecard Measure Digital Shift Progress Column Chart Ppt Pictures Slide Portrait PDF
Presenting this set of slides with name scorecard measure digital shift progress column chart ppt pictures slide portrait pdf. The topics discussed in these slides are product 1, product 2. This is a completely editable PowerPoint presentation and is available for immediate download. Download now and impress your audience.

Scorecard Measure Digital Shift Progress Stacked Bar Ppt Gallery Show PDF
Presenting this set of slides with name scorecard measure digital shift progress stacked bar ppt gallery show pdf. The topics discussed in these slides are product 1, product 2. This is a completely editable PowerPoint presentation and is available for immediate download. Download now and impress your audience.

Calculate Facebook Key Performance Indicator Ppt PowerPoint Presentation Complete Deck With Slides
This complete deck acts as a great communication tool. It helps you in conveying your business message with personalized sets of graphics, icons etc. Comprising a set of eleven slides, this complete deck can help you persuade your audience. It also induces strategic thinking as it has been thoroughly researched and put together by our experts. Not only is it easily downloadable but also editable. The color, graphics, theme any component can be altered to fit your individual needs. So grab it now.

Advance IT Service Delivery Methods To Drive Key Performance Indicators Related Business Results Complete Deck
This complete deck acts as a great communication tool. It helps you in conveying your business message with personalized sets of graphics, icons etc. Comprising a set of fifty six slides, this complete deck can help you persuade your audience. It also induces strategic thinking as it has been thoroughly researched and put together by our experts. Not only is it easily downloadable but also editable. The color, graphics, theme any component can be altered to fit your individual needs. So grab it now.

Business Intelligence Performance Dashboard Ppt Powerpoint Slides
This is a business intelligence performance dashboard ppt powerpoint slides. This is a six stage process. The stages in this process are total revenue, detailed profit of top product line, part capacity allocation, market share, customer satisfaction, quality notification.
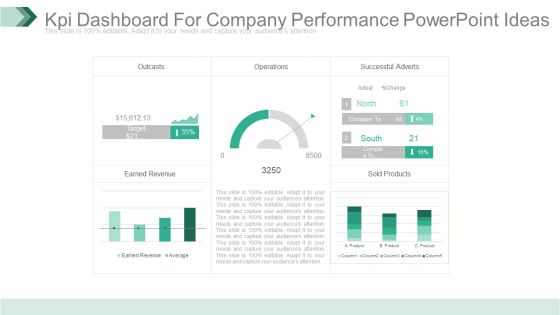
Kpi Dashboard For Company Performance Powerpoint Ideas
This is a kpi dashboard for company performance powerpoint ideas. This is a five stage process. The stages in this process are outcasts, operations, successful adverts, earned revenue, sold products.
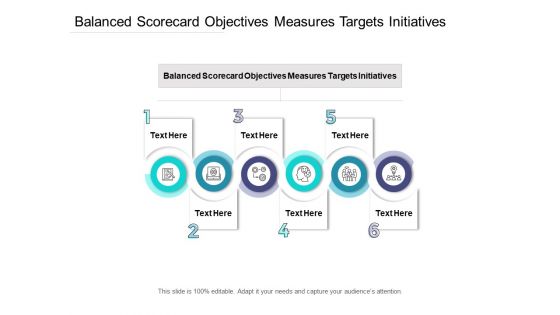
Balanced Scorecard Objectives Measures Targets Initiatives Ppt PowerPoint Presentation Ideas Guide Cpb Pdf
Presenting this set of slides with name balanced scorecard objectives measures targets initiatives ppt powerpoint presentation ideas guide cpb pdf. This is an editable Powerpoint six stages graphic that deals with topics like balanced scorecard objectives measures targets initiatives to help convey your message better graphically. This product is a premium product available for immediate download and is 100 percent editable in Powerpoint. Download this now and use it in your presentations to impress your audience.

KPI Dashboard To Measure Performance Of Saas Company Introduction PDF
This slide provides an overview of the SaaS metrics dashboard. The company can track the overall progress of their business model by tracking metrics such as quality leads, ARPA, signups past 4 weeks, net MRR churn rate, new business MRR, etc. Pitch your topic with ease and precision using this KPI Dashboard To Measure Performance Of Saas Company Introduction PDF. This layout presents information on Industry, Position, Customers, Quality Leads. It is also available for immediate download and adjustment. So, changes can be made in the color, design, graphics or any other component to create a unique layout.

Metric Dashboard To Track Product Success Product Development And Management Plan Portrait PDF
This slide represents product development timeline. It covers gathering resources, strategy development, performance validation, prototyping etc.If you are looking for a format to display your unique thoughts, then the professionally designed Metric Dashboard To Track Product Success Product Development And Management Plan Portrait PDF is the one for you. You can use it as a Google Slides template or a PowerPoint template. Incorporate impressive visuals, symbols, images, and other charts. Modify or reorganize the text boxes as you desire. Experiment with shade schemes and font pairings. Alter, share or cooperate with other people on your work. Download Metric Dashboard To Track Product Success Product Development And Management Plan Portrait PDF and find out how to give a successful presentation. Present a perfect display to your team and make your presentation unforgettable.

Tactical Communication Plan Measuring Customer Service Communication Metrics Professional PDF
This slide focuses on customer service communication metrics such as first response time, average resolution time, customer service satisfaction, effort score, net promoter score, etc. Retrieve professionally designed Tactical Communication Plan Measuring Customer Service Communication Metrics Professional PDF to effectively convey your message and captivate your listeners. Save time by selecting pre-made slideshows that are appropriate for various topics, from business to educational purposes. These themes come in many different styles, from creative to corporate, and all of them are easily adjustable and can be edited quickly. Access them as PowerPoint templates or as Google Slides themes. You do not have to go on a hunt for the perfect presentation because Slidegeeks got you covered from everywhere.

Dashboards To Measure Performance Of Google Retail Business Growth Marketing Techniques Background PDF
This following slide displays the key metrics that can help an organization to measure effectiveness of google shopping strategies. These can be keyword quality score, clicks and conversions etc. Are you in need of a template that can accommodate all of your creative concepts This one is crafted professionally and can be altered to fit any style. Use it with Google Slides or PowerPoint. Include striking photographs, symbols, depictions, and other visuals. Fill, move around, or remove text boxes as desired. Test out color palettes and font mixtures. Edit and save your work, or work with colleagues. Download Dashboards To Measure Performance Of Google Retail Business Growth Marketing Techniques Background PDF and observe how to make your presentation outstanding. Give an impeccable presentation to your group and make your presentation unforgettable.

Setting Up Metrics For Measuring Critical Applicating Performance Information PDF
This slide provides a matrix to compare the performance of individual applications that are running on new cloud environment. This matrix contains multiple parameters and score are mention against each parameter to evaluate overall performance.Deliver and pitch your topic in the best possible manner with this Setting Up Metrics For Measuring Critical Applicating Performance Information PDF. Use them to share invaluable insights on Service And Support, Performance, Score Legends and impress your audience. This template can be altered and modified as per your expectations. So, grab it now.
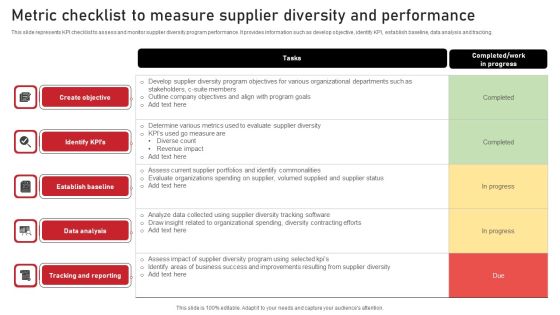
Metric Checklist To Measure Supplier Diversity And Performance Pictures PDF
This slide represents KPI checklist to assess and monitor supplier diversity program performance. It provides information such as develop objective, identify KPI, establish baseline, data analysis and tracking. Pitch your topic with ease and precision using this Metric Checklist To Measure Supplier Diversity And Performance Pictures PDF. This layout presents information on Create Objective, Establish Baseline, Data Analysis. It is also available for immediate download and adjustment. So, changes can be made in the color, design, graphics or any other component to create a unique layout.
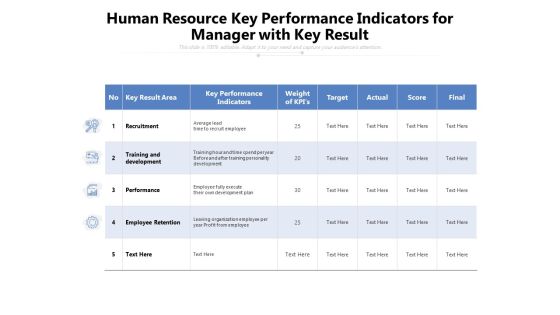
Human Resource Key Performance Indicators For Manager With Key Result Ppt PowerPoint Presentation File Graphics Tutorials PDF
Pitch your topic with ease and precision using this human resource key performance indicators for manager with key result ppt powerpoint presentation file graphics tutorials pdf. This layout presents information on training, development, performance. It is also available for immediate download and adjustment. So, changes can be made in the color, design, graphics or any other component to create a unique layout.

KPI Dashboard To Track Enterprise Information Protection Topics PDF
This slide shows key performance indicator dashboard which can be used by organizations to monitor business information protection. It includes metrics such as compliance, project protection, stimulating projects, etc. Showcasing this set of slides titled KPI Dashboard To Track Enterprise Information Protection Topics PDF. The topics addressed in these templates are Security Projects, Projects Sustainability, Services. All the content presented in this PPT design is completely editable. Download it and make adjustments in color, background, font etc. as per your unique business setting.

Product KPI Key Attributes Scorecard Based On Customer Feedback Report Ideas PDF
This slide covers scorecard for various product attributes based on customer surveys. It includes packaging, resource sustainability, product performance, design , quality, quantity, etc. Pitch your topic with ease and precision using this Product KPI Key Attributes Scorecard Based On Customer Feedback Report Ideas PDF. This layout presents information on Product Design, Product Performance, Resource Sustainability. It is also available for immediate download and adjustment. So, changes can be made in the color, design, graphics or any other component to create a unique layout.

Corporate Balanced Scorecard Powerpoint Templates
This is a corporate balanced scorecard powerpoint templates. This is a four stage process. The stages in this process are supply chain, corporate finance, production, corporate marketing.
Operations Management Business Units Example Powerpoint Slides
This is a operations management business units example powerpoint slides. This is a four stage process. The stages in this process are executive, management, operations, business units.
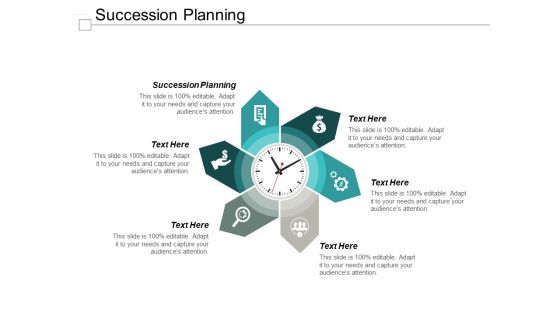
Succession Planning Ppt PowerPoint Presentation File Ideas
This is a succession planning ppt powerpoint presentation file ideas. This is a six stage process. The stages in this process are succession planning.

Business Intelligence Tool Ppt PowerPoint Presentation Outline Gridlines Cpb
This is a business intelligence tool ppt powerpoint presentation outline gridlines cpb. This is a eight stage process. The stages in this process are business intelligence tool.

Pyramid Showing Key Performance Indicators For IT Department Performance Evaluation Ppt PowerPoint Presentation Show Graphics Design PDF
Persuade your audience using this pyramid showing key performance indicators for it department performance evaluation ppt powerpoint presentation show graphics design pdf. This PPT design covers five stages, thus making it a great tool to use. It also caters to a variety of topics including it roi, team attrition rate, server downtime, number of new features developed, number of projects completed. Download this PPT design now to present a convincing pitch that not only emphasizes the topic but also showcases your presentation skills.

HR Scoreboard Manager Performance Inspiration PDF
The purpose of this slide is to showcase certain key performance indicators of human resource managers in order to measure their performance based on specific criteria. It includes key areas, metrics, targets, achieved, and performance rating. Showcasing this set of slides titled HR Scoreboard Manager Performance Inspiration PDF. The topics addressed in these templates are Target, Achieved, Performance Rating. All the content presented in this PPT design is completely editable. Download it and make adjustments in color, background, font etc. as per your unique business setting.

Employee Production Scorecard For Estimating Efficiency And Productivity Topics PDF
This is a Employee Production Scorecard For Estimating Efficiency And Productivity Topics PDF template with various stages. Focus and dispense information on three stages using this creative set, that comes with editable features. It contains large content boxes to add your information on topics like Location, Efficiency And Productivity, Employee Production Scorecard. You can also showcase facts, figures, and other relevant content using this PPT layout. Grab it now.

Risk Metrics Dashboard And Mitigation Expenditure Dashboard Ideas PDF
This slide illustrates facts and figures of expenditure incurred on different risks. It includes financial risk, operational risks and competition risks. Pitch your topic with ease and precision using this Risk Metrics Dashboard And Mitigation Expenditure Dashboard Ideas PDF. This layout presents information on Management, Expenditure, Risk. It is also available for immediate download and adjustment. So, changes can be made in the color, design, graphics or any other component to create a unique layout.
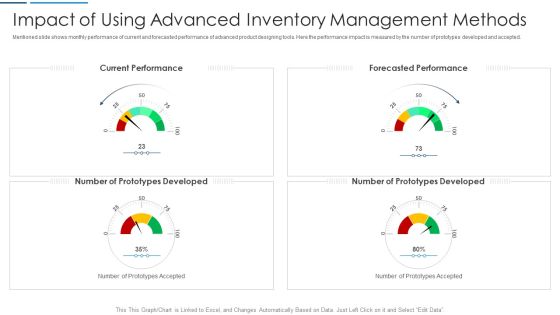
Information Technology Transformation Impact Of Using Advanced Inventory Management Methods Background PDF
Mentioned slide shows monthly performance of current and forecasted performance of advanced product designing tools. Here the performance impact is measured by the number of prototypes developed and accepted. Presenting information technology transformation impact of using advanced inventory management methods background pdf to provide visual cues and insights. Share and navigate important information on four stages that need your due attention. This template can be used to pitch topics like current performance, forecasted performance, developed. In addtion, this PPT design contains high resolution images, graphics, etc, that are easily editable and available for immediate download.

Information Technology Transformation Impact Of Using Advanced Manufacturing Machines Diagrams PDF
Mentioned slide shows daily performance of current and forecasted performance of advanced manufacturing machines. Here the performance impact is measured on average runtime of machine with product output and maintenance cost. This is a information technology transformation impact of using advanced manufacturing machines diagrams pdf template with various stages. Focus and dispense information on two stages using this creative set, that comes with editable features. It contains large content boxes to add your information on topics like forecasted performance, current performance, maintenance cost. You can also showcase facts, figures, and other relevant content using this PPT layout. Grab it now.

Staff Retention Plan Employee Retention Dashboard Ppt Portfolio Show PDF
The following slide displays the Human Resource Dashboard, as it highlights the key performance indicators for HR department, these metrics can be Employee count by department, employee details etc. Deliver an awe inspiring pitch with this creative staff retention plan employee retention dashboard ppt portfolio show pdf bundle. Topics like employee retention dashboard can be discussed with this completely editable template. It is available for immediate download depending on the needs and requirements of the user.

Measuring Our SEO Performance Ppt PowerPoint Presentation File Example PDF
The following slide provides various key performance indicators of the SEO strategy, these can be number of users, social networks and new vs returning If your project calls for a presentation, then Slidegeeks is your go to partner because we have professionally designed, easy to edit templates that are perfect for any presentation. After downloading, you can easily edit Measuring Our SEO Performance Ppt PowerPoint Presentation File Example PDF and make the changes accordingly. You can rearrange slides or fill them with different images. Check out all the handy templates

Dashboard To Measure Performance Of E Commerce Marketing Strategies Structure PDF
This following slide displays the key metrics that can help an organization to measure effectiveness of e-commerce strategies. These can be revenue generated using e-commerce platform, conversion rates etc.Create an editable Dashboard To Measure Performance Of E Commerce Marketing Strategies Structure PDF that communicates your idea and engages your audience. Whether you are presenting a business or an educational presentation, pre-designed presentation templates help save time. Dashboard To Measure Performance Of E Commerce Marketing Strategies Structure PDF is highly customizable and very easy to edit, covering many different styles from creative to business presentations. Slidegeeks has creative team members who have crafted amazing templates. So, go and get them without any delay.
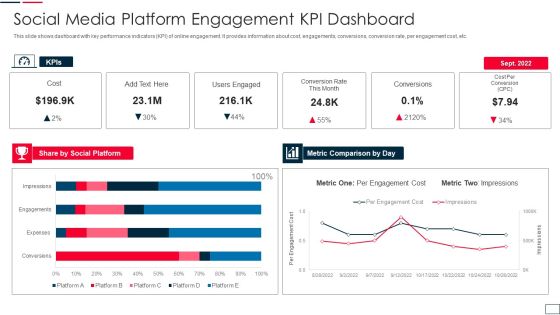
Social Media Platform Engagement Kpi Dashboard Elements PDF
This slide shows dashboard with key performance indicators KPI of online engagement. It provides information about cost, engagements, conversions, conversion rate, per engagement cost, etc. Showcasing this set of slides titled social media platform engagement kpi dashboard elements pdf. The topics addressed in these templates are social, metric, cost. All the content presented in this PPT design is completely editable. Download it and make adjustments in color, background, font etc. as per your unique business setting.

Business Intelligence And Big Success Metrics For Data Analytics Speculation Microsoft PDF
This slide shows the key success factors for evaluating the success of data analytics program. The foremost key metrics includes discovery, insights, outcomes and actions. This is a business intelligence and big success metrics for data analytics speculation microsoft pdf template with various stages. Focus and dispense information on four stages using this creative set, that comes with editable features. It contains large content boxes to add your information on topics like discovery, insights, actions, outcomes. You can also showcase facts, figures, and other relevant content using this PPT layout. Grab it now.

Digital Watch Graphics For Making Goals Measurable Ppt PowerPoint Presentation Gallery Rules PDF
Pitch your topic with ease and precision using this digital watch graphics for making goals measurable ppt powerpoint presentation gallery rules pdf. This layout presents information on digital watch graphics for making goals measurable. It is also available for immediate download and adjustment. So, changes can be made in the color, design, graphics or any other component to create a unique layout.
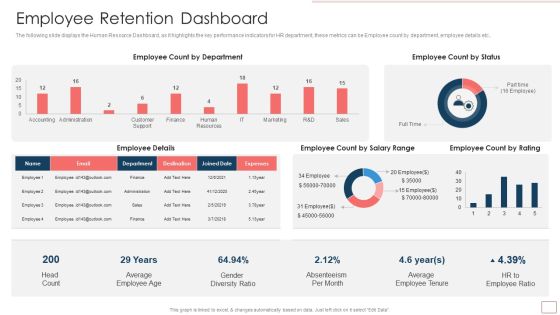
Strategic Human Resource Retention Management Employee Retention Dashboard Structure PDF
The following slide displays the Human Resource Dashboard, as it highlights the key performance indicators for HR department, these metrics can be Employee count by department, employee details etc.Deliver an awe inspiring pitch with this creative Strategic Human Resource Retention Management Employee Retention Dashboard Structure PDF bundle. Topics like Count By Department, Employee Count, Average Employee can be discussed with this completely editable template. It is available for immediate download depending on the needs and requirements of the user.
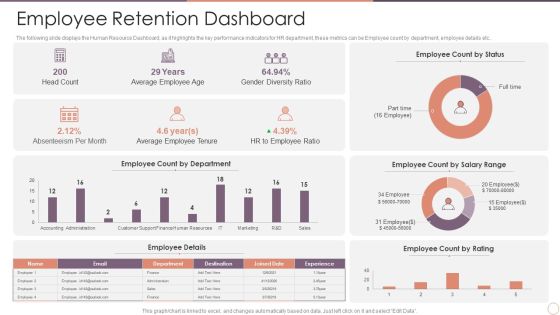
Managing Employee Turnover Employee Retention Dashboard Information PDF
The following slide displays the Human Resource Dashboard, as it highlights the key performance indicators for HR department, these metrics can be Employee count by department, employee details etc.Deliver and pitch your topic in the best possible manner with this Managing Employee Turnover Employee Retention Dashboard Information PDF. Use them to share invaluable insights on Employee Count, Gender Diversity, Average Employee and impress your audience. This template can be altered and modified as per your expectations. So, grab it now.

Customer Touch Point Values Powerpoint Slide Templates
This is a customer touch point values powerpoint slide templates. This is a one stage process. The stages in this process are digital touch point, website, portal, article, search, testimonial, price comparison, social media, online video, info social network, email, blog, performance dimension, web equity, pre purchase, post purchase, relationship building, trust, credibility, believability, influence, vitierc to buy, coupon, buy online, pre purchase research, compare brands, customer service, product support, learn more, customer relationship.
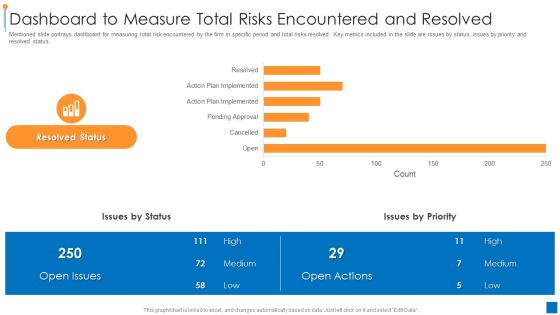
International Organization Standardization 270001 Dashboard To Measure Total Risks Encountered And Resolved Demonstration PDF
Mentioned slide portrays dashboard for measuring total risk encountered by the firm in specific period and total risks resolved. Key metrics included in the slide are issues by status, issues by priority and resolved status. Deliver and pitch your topic in the best possible manner with this international organization standardization 270001 dashboard to measure total risks encountered and resolved demonstration pdf. Use them to share invaluable insights on dashboard to measure total risks encountered and resolved and impress your audience. This template can be altered and modified as per your expectations. So, grab it now.

Corporate Resource Planning Dashboard To Measure Performance Of ERP Implementation Designs PDF
This slide describes the dashboard to measure the performance of ERP implementation, and it is coving details of production and revenues.Deliver and pitch your topic in the best possible manner with this Corporate Resource Planning Dashboard To Measure Performance Of ERP Implementation Designs PDF Use them to share invaluable insights on Dashboard To Measure, Performance Of ERP, Implementation and impress your audience. This template can be altered and modified as per your expectations. So, grab it now.

Automation Project Status Dashboard Of Consulting Firm Report Background PDF
This slide showcases project status dashboard that provides a concise visual of key indicators progress and allow to compare actual performance with pre-built objectives. Key metrics covered are cost performance, time v or s project phase, timeline v or s resource capacity. Showcasing this set of slides titled Automation Project Status Dashboard Of Consulting Firm Report Background PDF. The topics addressed in these templates are Project Phase, Planned Value, Cost Performance Index. All the content presented in this PPT design is completely editable. Download it and make adjustments in color, background, font etc. as per your unique business setting.

Product Development Status Icon With Bulb Ideas PDF
The following slide showcases dashboard that helps to track key performance indicators of product development. Key metrics covered overall progress, planning, design, development, testing, risks, summary, average handle time, overdue tasks, upcoming deadlines and projected launch date. Showcasing this set of slides titled Product Development Status Icon With Bulb Ideas PDF. The topics addressed in these templates are Design, Development, Planning. All the content presented in this PPT design is completely editable. Download it and make adjustments in color, background, font etc. as per your unique business setting.

Key Company Financials Business Intelligence Dashboard Graphics PDF
This slide showcases business intelligence dashboard to analyze key financial metrics for the organization. It includes information such as current working capital, vendor payment error rate, quick stats, budget variance, etc. Showcasing this set of slides titled Key Company Financials Business Intelligence Dashboard Graphics PDF. The topics addressed in these templates are Key Company Financials, Business Intelligence Dashboard. All the content presented in this PPT design is completely editable. Download it and make adjustments in color, background, font etc. as per your unique business setting.
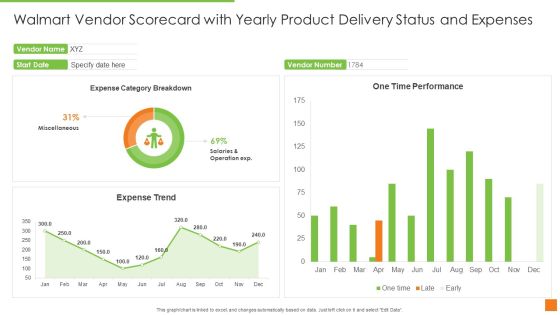
Walmart Vendor Scorecard With Yearly Product Delivery Status And Expenses Ppt Layouts Graphics PDF
Deliver an awe inspiring pitch with this creative walmart vendor scorecard with yearly product delivery status and expenses ppt layouts graphics pdf bundle. Topics like expense category breakdown, one time performance, expense trend can be discussed with this completely editable template. It is available for immediate download depending on the needs and requirements of the user.

Mini Charter For Data Analytics Project With Metrics Business Analysis Modification Toolkit Infographics PDF
This slide shows the formal document that describes the scope of business analytics project covering its goals, key metrics, resources, teams and milestones etc.Deliver and pitch your topic in the best possible manner with this Mini Charter For Data Analytics Project With Metrics Business Analysis Modification Toolkit Infographics PDF. Use them to share invaluable insights on Business Intelligence, Functional Requirement, Project Information and impress your audience. This template can be altered and modified as per your expectations. So, grab it now.

Business Intelligence And Mini Charter For Data Analytics Project With Metrics Professional PDF
This slide shows the formal document that describes the scope of business analytics project covering its goals, key metrics, resources, teams and milestones etc. Deliver an awe inspiring pitch with this creative business intelligence and mini charter for data analytics project with metrics professional pdf bundle. Topics like project overview, project team, project information, goal statement can be discussed with this completely editable template. It is available for immediate download depending on the needs and requirements of the user.

Cybersecurity Operations Cybersecops Metrics To Track Secops Impact On Business Icons PDF
This slide refers to the key metrics to track the impact of SecOps implementation on business. The purpose of this slide is to highlight the key metrics for SecOps tracking, including mean time to acknowledge, mean time to resolve, incidents remediated and escalations between each tier. Get a simple yet stunning designed Cybersecurity Operations Cybersecops Metrics To Track Secops Impact On Business Icons PDF. It is the best one to establish the tone in your meetings. It is an excellent way to make your presentations highly effective. So, download this PPT today from Slidegeeks and see the positive impacts. Our easy to edit Cybersecurity Operations Cybersecops Metrics To Track Secops Impact On Business Icons PDF can be your go to option for all upcoming conferences and meetings. So, what are you waiting for Grab this template today.
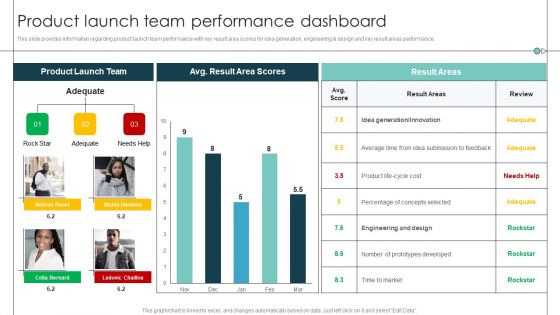
Product Launch Team Performance Dashboard Product Release Commencement Structure PDF
This slide provides information regarding product launch team performance with key result area scores for idea generation, engineering and design and key result areas performance. Deliver and pitch your topic in the best possible manner with this Product Launch Team Performance Dashboard Product Release Commencement Structure PDF. Use them to share invaluable insights on Average Time, Prototypes Developed, Percentage Concepts and impress your audience. This template can be altered and modified as per your expectations. So, grab it now.

Product Social Sustainability Scorecard With Product Packaging Recyclability Mockup PDF
Presenting product social sustainability scorecard with product packaging recyclability mockup pdf to provide visual cues and insights. Share and navigate important information on two stages that need your due attention. This template can be used to pitch topics like recyclable with dissolution, product packaging, non recyclable in the condition. In addtion, this PPT design contains high resolution images, graphics, etc, that are easily editable and available for immediate download.

Customer Support Team Dashboard For Measuring Differentiation Efforts Formats PDF
The following slide helps organization in understanding the effect of their differentiation strategy. It highlight essential metrics such as tickets raised by customer, support status and total unresolved tickets. Deliver an awe inspiring pitch with this creative Customer Support Team Dashboard For Measuring Differentiation Efforts Formats PDF bundle. Topics like Customer Support Team Dashboard, Measuring Differentiation Efforts can be discussed with this completely editable template. It is available for immediate download depending on the needs and requirements of the user.
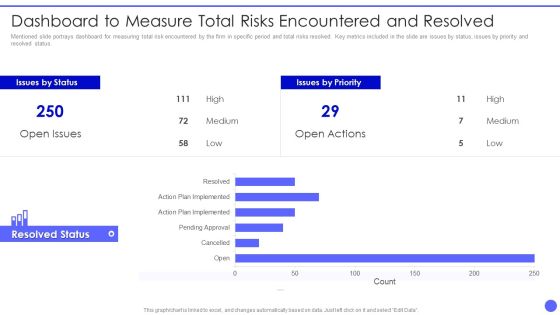
Info Safety And ISO 27001 Dashboard To Measure Total Risks Encountered Slides PDF
Mentioned slide portrays dashboard for measuring total risk encountered by the firm in specific period and total risks resolved. Key metrics included in the slide are issues by status, issues by priority and resolved status. Deliver an awe inspiring pitch with this creative Info Safety And ISO 27001 Dashboard To Measure Total Risks Encountered Slides PDF bundle. Topics like Issues by Status, Resolved Status, High, Medium, Low can be discussed with this completely editable template. It is available for immediate download depending on the needs and requirements of the user.

Ways To Accomplish ISO 27001 Accreditation Dashboard To Measure Total Risks Encountered Download PDF
Mentioned slide portrays dashboard for measuring total risk encountered by the firm in specific period and total risks resolved. Key metrics included in the slide are issues by status, issues by priority and resolved status. Deliver an awe inspiring pitch with this creative Ways To Accomplish ISO 27001 Accreditation Dashboard To Measure Total Risks Encountered Download PDF bundle. Topics like Pending Approval, Action Plan, Resolved Status can be discussed with this completely editable template. It is available for immediate download depending on the needs and requirements of the user.
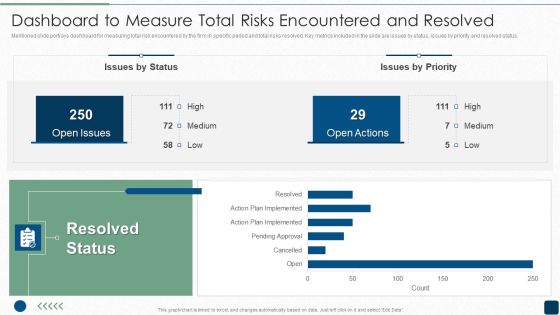
ISO 27001 Certification Procedure Dashboard To Measure Total Risks Encountered And Resolved Topics PDF
Mentioned slide portrays dashboard for measuring total risk encountered by the firm in specific period and total risks resolved. Key metrics included in the slide are issues by status, issues by priority and resolved status.Deliver and pitch your topic in the best possible manner with this ISO 27001 Certification Procedure Dashboard To Measure Total Risks Encountered And Resolved Topics PDF. Use them to share invaluable insights on Resolved Status, Open Issues, Open Actions and impress your audience. This template can be altered and modified as per your expectations. So, grab it now.

Metrics To Measure Business Performance Effective Rate Metrics By Customer And Offering Diagrams PDF
This slide covers effective rate metrics. It shows over year over comparison of effective rate per customer as well as effective rate per offering. Deliver and pitch your topic in the best possible manner with this Metrics To Measure Business Performance Effective Rate Metrics By Customer And Offering Diagrams PDF. Use them to share invaluable insights on Effective Rate, Per Customer, Per Offering and impress your audience. This template can be altered and modified as per your expectations. So, grab it now.

Dashboard Ppt PowerPoint Presentation Slides
This is a dashboard ppt powerpoint presentation slides. This is a three stage process. The stages in this process are dashboard, measure, marketing, strategy, business.

Dashboard Ppt PowerPoint Presentation Backgrounds
This is a dashboard ppt powerpoint presentation backgrounds. This is a two stage process. The stages in this process are dashboard, percentage, finance, measurement, business.

Dashboard Ppt PowerPoint Presentation Visuals
This is a dashboard ppt powerpoint presentation visuals. This is a four stage process. The stages in this process are dashboard, measure, management, business, marketing.

Dashboard Ppt PowerPoint Presentation Introduction
This is a dashboard ppt powerpoint presentation introduction. This is a four stage process. The stages in this process are dashboard, measure, strategy, business, success.

Dashboard Ppt PowerPoint Presentation Summary
This is a dashboard ppt powerpoint presentation summary. This is a three stage process. The stages in this process are business, management, marketing, dashboard, measure.

Dashboard Ppt PowerPoint Presentation Layout
This is a dashboard ppt powerpoint presentation layout. This is a one stage process. The stages in this process are dashboard, measurement, business, marketing.

Dashboard Ppt PowerPoint Presentation Rules
This is a dashboard ppt powerpoint presentation rules. This is a three stage process. The stages in this process are dashboard, measurement, percentage, analysis, business.

Dashboard Ppt PowerPoint Presentation Images
This is a dashboard ppt powerpoint presentation images. This is a one stage process. The stages in this process are dashboard, meter, speed, measure, business.

Three Dashboard For Financial Reporting Ppt Summary
This is a three dashboard for financial reporting ppt summary. This is a three stage process. The stages in this process are business, marketing, speed, dashboard, meter.

Dashboard Ppt PowerPoint Presentation Infographics Introduction
This is a dashboard ppt powerpoint presentation infographics introduction. This is a four stage process. The stages in this process are dashboard, meter, business, marketing, finance.

Dashboard Ppt PowerPoint Presentation Model Inspiration
This is a dashboard ppt powerpoint presentation model inspiration. This is a five stage process. The stages in this process are dashboard, business, marketing, strategy, meter.

Dashboard Ppt PowerPoint Presentation Styles Elements
This is a dashboard ppt powerpoint presentation styles elements. This is a three stage process. The stages in this process are percentage, finance, business, marketing, dashboard.

Dashboard Ppt PowerPoint Presentation Portfolio Demonstration
This is a dashboard ppt powerpoint presentation portfolio demonstration. This is a two stage process. The stages in this process are dashboard, finance, percentage, meter, speed.

Dashboard Ppt PowerPoint Presentation Portfolio Samples
This is a dashboard ppt powerpoint presentation portfolio samples. This is a two stage process. The stages in this process are dashboard, percentage, business, marketing, management.

Dashboard Ppt PowerPoint Presentation Outline Example File
This is a dashboard ppt powerpoint presentation outline example file. This is a one stage process. The stages in this process are high speed, dashboard, business, marketing.

Dashboard Ppt PowerPoint Presentation Ideas Elements
This is a dashboard ppt powerpoint presentation ideas elements. This is a two stage process. The stages in this process are dashboard, percentage, business, marketing, management.

Dashboard Ppt PowerPoint Presentation File Design Ideas
This is a dashboard ppt powerpoint presentation file design ideas. This is a three stage process. The stages in this process are dashboard, business, marketing, management.

Dashboard Ppt PowerPoint Presentation Infographics Tips
This is a dashboard ppt powerpoint presentation infographics tips. This is a three stage process. The stages in this process are low, medium, high, dashboard, business, percentage.

Dashboard Ppt PowerPoint Presentation Model Layout
This is a dashboard ppt powerpoint presentation model layout. This is a three stage process. The stages in this process are dashboard, meter, finance, speed, marketing.

Dashboard Ppt PowerPoint Presentation Show Deck
This is a dashboard ppt powerpoint presentation show deck. This is a three stage process. The stages in this process are low, medium, high, dashboard, business.

Dashboard Ppt PowerPoint Presentation Inspiration Slide Download
This is a dashboard ppt powerpoint presentation inspiration slide download. This is a three stage process. The stages in this process are dashboard, business, marketing, process, strategy.

Dashboard Ppt PowerPoint Presentation Show Designs
This is a dashboard ppt powerpoint presentation show designs. This is a three stage process. The stages in this process are business, marketing, strategy, dashboard, finance.

Dashboard Ppt PowerPoint Presentation File Deck
This is a dashboard ppt powerpoint presentation file deck. This is a three stage process. The stages in this process are dashboard, percentage, business, marketing, strategy.

Dashboard Ppt PowerPoint Presentation Layouts Files
This is a dashboard ppt powerpoint presentation layouts files. This is a three stage process. The stages in this process are low, medium, high, dashboard, business.

Dashboard Ppt PowerPoint Presentation Pictures Mockup
This is a dashboard ppt powerpoint presentation pictures mockup. This is a three stage process. The stages in this process are dashboard, business, marketing, strategy, low.

Dashboard Ppt PowerPoint Presentation Model Slide Download
This is a dashboard ppt powerpoint presentation model slide download. This is a one stage process. The stages in this process are finance, planning, meter, speed, dashboard.

Dashboard Ppt PowerPoint Presentation Gallery Ideas
This is a dashboard ppt powerpoint presentation gallery ideas. This is a two stage process. The stages in this process are business, marketing, dashboard, analysis, finance.
