Kpis

Ranking Scorecard Product Variant Ranking Scorecard Designs PDF
Deliver an awe inspiring pitch with this creative ranking scorecard product variant ranking scorecard designs pdf bundle. Topics like user interface, data protection, third party integrations can be discussed with this completely editable template. It is available for immediate download depending on the needs and requirements of the user.
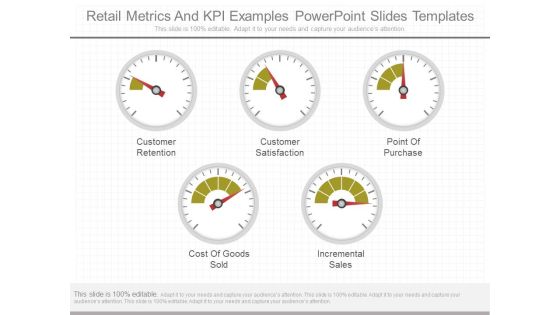
Retail Metrics And Kpi Examples Powerpoint Slides Templates
This is a retail metrics and kpi examples powerpoint slides templates. This is a five stage process. The stages in this process are customer retention, customer satisfaction, point of purchase, cost of goods sold, incremental sales.
KPI Metrics Vector Icon Ppt PowerPoint Presentation Layouts Slide
This is a kpi metrics vector icon ppt powerpoint presentation layouts slide. This is a three stage process. The stages in this process are kpi proposal, kpi plan, kpi scheme.
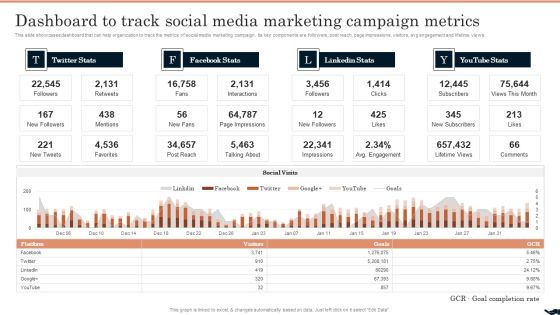
Generating Leads Through Dashboard To Track Social Media Marketing Campaign Metrics Pictures PDF
This slide showcases dashboard that can help organization to track the metrics of social media marketing campaign. Its key components are followers, post reach, page impressions, visitors, avg engagement and lifetime views. Present like a pro with Generating Leads Through Dashboard To Track Social Media Marketing Campaign Metrics Pictures PDF Create beautiful presentations together with your team, using our easy-to-use presentation slides. Share your ideas in real-time and make changes on the fly by downloading our templates. So whether youre in the office, on the go, or in a remote location, you can stay in sync with your team and present your ideas with confidence. With Slidegeeks presentation got a whole lot easier. Grab these presentations today.

Dashboard To Impact The Performance Powerpoint Slides
This PowerPoint template graphics of meter chart. Download this PPT chart for business performance analysis. This PowerPoint slide is of great help in the business sector to make realistic presentations and provides effective way of presenting your newer thoughts.

Offline Media Channel Analysis Performance Indicators For Effective Traditional Marketing Elements PDF
This slide showcases key metrics of traditional media for marketers. Major indicators covered are cost per lead, customer retention, marketing ROI. Sales revenue, customer lifetime value and website traffic. Want to ace your presentation in front of a live audience Our Offline Media Channel Analysis Performance Indicators For Effective Traditional Marketing Elements PDF can help you do that by engaging all the users towards you.. Slidegeeks experts have put their efforts and expertise into creating these impeccable powerpoint presentations so that you can communicate your ideas clearly. Moreover, all the templates are customizable, and easy-to-edit and downloadable. Use these for both personal and commercial use.

Fundraising Pitch Deck For Startup Company Key Metrics Highlighting Business Traction Template PDF
Following slide displays informational statistics of business traction covering details about users, jobs creation and monthly revenue generation. Deliver and pitch your topic in the best possible manner with this fundraising pitch deck for startup company key metrics highlighting business traction template pdf. Use them to share invaluable insights on key metrics highlighting business traction and impress your audience. This template can be altered and modified as per your expectations. So, grab it now.

Capital Fundraising And Financial Forecast Pitch Deck Key Metrics Highlighting Business Traction Pictures PDF
Following slide displays informational statistics of business traction covering details about users, jobs creation and monthly revenue generation. Deliver and pitch your topic in the best possible manner with this capital fundraising and financial forecast pitch deck key metrics highlighting business traction pictures pdf. Use them to share invaluable insights on key metrics highlighting business traction and impress your audience. This template can be altered and modified as per your expectations. So, grab it now.

Products Comparative Sales Employee Representative Performance Scorecard For Small Business Information PDF
Mentioned slide displays various product sales estimation scorecard which can be used by firms to determine best selling market product. It includes element such as products, estimated sales unit, actual units sold, deviation, estimates sales, actual sales and deviation. Showcasing this set of slides titled Products Comparative Sales Employee Representative Performance Scorecard For Small Business Information PDF. The topics addressed in these templates are Product, Estimated Sales Unit, Actual Units Sold, Variance, Sales In Estimated, Actual Sales. All the content presented in this PPT design is completely editable. Download it and make adjustments in color, background, font etc. as per your unique business setting.

Capital Markets Dashboard Ppt Powerpoint Slide Background
This is a capital markets dashboard ppt powerpoint slide background. This is a three stage process. The stages in this process are weekly sales, product inventory, key performance indicators.

Quality Control Plan Quality Assurance Vs Control With Key Metrics Slides PDF
This slide distinguished quality assurance and quality control based on focus, character, starting point, tools and measures. It also covers information about key metrics of both. If you are looking for a format to display your unique thoughts, then the professionally designed Quality Control Plan Quality Assurance Vs Control With Key Metrics Slides PDF is the one for you. You can use it as a Google Slides template or a PowerPoint template. Incorporate impressive visuals, symbols, images, and other charts. Modify or reorganize the text boxes as you desire. Experiment with shade schemes and font pairings. Alter, share or cooperate with other people on your work. Download Quality Control Plan Quality Assurance Vs Control With Key Metrics Slides PDF and find out how to give a successful presentation. Present a perfect display to your team and make your presentation unforgettable.

Dashboard Ppt PowerPoint Presentation Summary Format
This is a dashboard ppt powerpoint presentation summary format. This is a one stage process. The stages in this process are speed, meter, dashboard, measure, planning.

Dashboard Ppt PowerPoint Presentation Layouts Guide
This is a dashboard ppt powerpoint presentation layouts guide. This is a four stage process. The stages in this process are low, medium, high, dashboard, measurement.

Dashboard Ppt PowerPoint Presentation Ideas Gridlines
This is a dashboard ppt powerpoint presentation ideas gridlines. This is a three stage process. The stages in this process are low, medium, high, dashboard, measurement.

Dashboard Ppt PowerPoint Presentation Pictures Icon
This is a dashboard ppt powerpoint presentation pictures icon. This is a six stage process. The stages in this process are dashboard, meter, measure, speed, marketing.

Dashboard Ppt PowerPoint Presentation Infographics Elements
This is a dashboard ppt powerpoint presentation infographics elements. This is a three stage process. The stages in this process are high, low, medium, dashboard measurement.

Dashboard Ppt PowerPoint Presentation Inspiration Design Templates
This is a dashboard ppt powerpoint presentation inspiration design templates. This is a three stage process. The stages in this process are low, medium, high, dashboard, measurement.

Dashboard Ppt PowerPoint Presentation Design Templates
This is a dashboard ppt powerpoint presentation design templates. This is a three stage process. The stages in this process are low, medium, high, dashboard measurement.

Dashboard Ppt PowerPoint Presentation Layouts Format
This is a dashboard ppt powerpoint presentation layouts format. This is a three stage process. The stages in this process are low, medium, high, dashboard, measurement.

Dashboard Ppt PowerPoint Presentation Outline Images
This is a dashboard ppt powerpoint presentation outline images. This is a two stage process. The stages in this process are low, medium, high, dashboard, measurement.

Dashboard Ppt PowerPoint Presentation Summary Deck
This is a dashboard ppt powerpoint presentation summary deck. This is a three stage process. The stages in this process are low, medium, high, dashboard, measurement.

Dashboard Ppt PowerPoint Presentation Icon Infographic Template
This is a dashboard ppt powerpoint presentation icon infographic template. This is a two stage process. The stages in this process are low, medium, high, dashboard, measurement.

Dashboard Ppt PowerPoint Presentation Visual Aids Infographics
This is a dashboard ppt powerpoint presentation visual aids infographics. This is a three stage process. The stages in this process are low, medium, high, dashboard, measurement.

Dashboard Ppt PowerPoint Presentation Show Outfit
This is a dashboard ppt powerpoint presentation show outfit. This is a three stage process. The stages in this process are low, medium, high, dashboard, measurement.

Dashboard Ppt PowerPoint Presentation Model Slide
This is a dashboard ppt powerpoint presentation model slide. This is a three stage process. The stages in this process are low, medium, high, dashboard, measurement.

Dashboard Ppt PowerPoint Presentation Visual Aids Ideas
This is a dashboard ppt powerpoint presentation visual aids ideas. This is a two stage process. The stages in this process are low, medium, high, dashboard, measurement.

Dashboard Ppt PowerPoint Presentation Summary Inspiration
This is a dashboard ppt powerpoint presentation summary inspiration. This is a one stage process. The stages in this process are low, medium, high, dashboard, measurement.

Dashboard Ppt PowerPoint Presentation Inspiration Sample
This is a dashboard ppt powerpoint presentation inspiration sample. This is a three stage process. The stages in this process are low, medium, high, dashboard, measurement.

Dashboard Ppt PowerPoint Presentation Gallery Design Templates
This is a dashboard ppt powerpoint presentation gallery design templates. This is a one stage process. The stages in this process are low, medium, high, dashboard, measurement.

Dashboard Ppt PowerPoint Presentation File Guidelines
This is a dashboard ppt powerpoint presentation file guidelines. This is a three stage process. The stages in this process are minimum, medium, maximum, dashboard, measurement.

Dashboard Ppt PowerPoint Presentation Inspiration Professional
This is a dashboard ppt powerpoint presentation inspiration professional. This is a two stage process. The stages in this process are low, medium, high, dashboard, measurement.

Dashboard Ppt PowerPoint Presentation Pictures Designs
This is a dashboard ppt powerpoint presentation pictures designs. This is a three stage process. The stages in this process are dashboard, marketing, measurement, analysis, strategy.

Dashboard Ppt PowerPoint Presentation Infographics Design Ideas
This is a dashboard ppt powerpoint presentation infographics design ideas. This is a two stage process. The stages in this process are low, medium, high, dashboard, measurement.

Dashboard Ppt PowerPoint Presentation Infographic Template Portfolio
This is a dashboard ppt powerpoint presentation infographic template portfolio. This is a one stage process. The stages in this process are dashboard, measurement, analysis, business, marketing.

Dashboard Ppt PowerPoint Presentation Infographic Template Slides
This is a dashboard ppt powerpoint presentation infographic template slides. This is a three stage process. The stages in this process are low, medium, high, dashboard, measurement.

Dashboard Ppt PowerPoint Presentation Summary Outline
This is a dashboard ppt powerpoint presentation summary outline. This is a three stage process. The stages in this process are low, medium, high, dashboard, measurement.

Dashboard Ppt PowerPoint Presentation Diagram Lists
This is a dashboard ppt powerpoint presentation diagram lists. This is a two stage process. The stages in this process are low, medium, high, dashboard, measurement.

Dashboard Ppt PowerPoint Presentation Model Guidelines
This is a dashboard ppt powerpoint presentation model guidelines. This is a three stage process. The stages in this process are low, medium, high, dashboard, measurement.

Dashboard Ppt PowerPoint Presentation Portfolio Clipart Images
This is a dashboard ppt powerpoint presentation portfolio clipart images. This is a two stage process. The stages in this process are dashboard, marketing, measure, strategy, business.

Dashboard Ppt PowerPoint Presentation Model Tips
This is a dashboard ppt powerpoint presentation model tips. This is a one stage process. The stages in this process are dashboard, measure, marketing, strategy, analysis.

Dashboard Ppt PowerPoint Presentation Portfolio Slides
This is a dashboard ppt powerpoint presentation portfolio slides. This is a two stage process. The stages in this process are high, low, business, measurement, dashboard.

Dashboard Ppt PowerPoint Presentation Model Examples
This is a dashboard ppt powerpoint presentation model examples. This is a three stage process. The stages in this process are low, medium, high, dashboard, measurement.

Dashboard Ppt PowerPoint Presentation Gallery Background Designs
This is a dashboard ppt powerpoint presentation gallery background designs. This is a three stage process. The stages in this process are low, medium, high, dashboard, measurement.

Dashboard Ppt PowerPoint Presentation Model Layout Ideas
This is a dashboard ppt powerpoint presentation model layout ideas. This is a two stage process. The stages in this process are low, medium, high, dashboard, measurement.

Dashboard Ppt PowerPoint Presentation Pictures Show
This is a dashboard ppt powerpoint presentation pictures show. This is a three stage process. The stages in this process are high speed on, dashboard, measurement.

Dashboard Ppt PowerPoint Presentation Show Smartart
This is a dashboard ppt powerpoint presentation show smartart. This is a three stage process. The stages in this process are low, high, dashboard, measuring, finance.

Project Dashboard Ppt PowerPoint Presentation Portfolio Tips
This is a project dashboard ppt powerpoint presentation portfolio tips. This is a five stage process. The stages in this process are project dashboard, measurement, marketing, strategy, business.

Dashboard Ppt PowerPoint Presentation Portfolio Layout
This is a dashboard ppt powerpoint presentation portfolio layout. This is a two stage process. The stages in this process are low, medium, high, dashboard, measurement.

Dashboard Ppt PowerPoint Presentation Slides Visual Aids
This is a dashboard ppt powerpoint presentation slides visual aids. This is a two stage process. The stages in this process are low, medium, high, dashboard, measurement.

Dashboard Ppt PowerPoint Presentation Layouts Master Slide
This is a dashboard ppt powerpoint presentation layouts master slide. This is a three stage process. The stages in this process are low, medium, high, dashboard, measurement.

Dashboard Ppt PowerPoint Presentation Gallery Designs Download
This is a dashboard ppt powerpoint presentation gallery designs download. This is a three stage process. The stages in this process are low, medium, high, dashboard, measurement.

Dashboard Ppt PowerPoint Presentation Infographics Layouts
This is a dashboard ppt powerpoint presentation infographics layouts. This is a three stage process. The stages in this process are low, medium, high, dashboard, measurement.
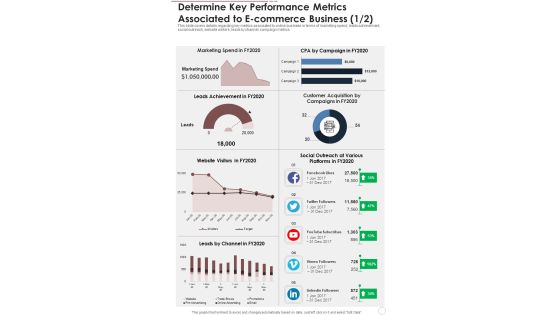
Determine Key Performance Metrics Associated To E Commerce Business One Pager Documents
Presenting you a fantastic Determine Key Performance Metrics Associated To E Commerce Business One Pager Documents. This piece is crafted on hours of research and professional design efforts to ensure you have the best resource. It is completely editable and its design allow you to rehash its elements to suit your needs. Get this Determine Key Performance Metrics Associated To E Commerce Business One Pager Documents A4 One-pager now.
Key Performance Indicators To Track Sales Performance Ppt PowerPoint Presentation Icon Diagrams PDF
Showcasing this set of slides titled key performance indicators to track sales performance ppt powerpoint presentation icon diagrams pdf. The topics addressed in these templates are key performance indicators to track sales performance. All the content presented in this PPT design is completely editable. Download it and make adjustments in color, background, font etc. as per your unique business setting.

Calculate Facebook Key Performance Indicator And Track Your Performance Information PDF
Showcasing this set of slides titled calculate facebook key performance indicator and track your performance information pdf. The topics addressed in these templates are calculate facebook key performance indicator and track your performance. All the content presented in this PPT design is completely editable. Download it and make adjustments in color, background, font etc. as per your unique business setting.
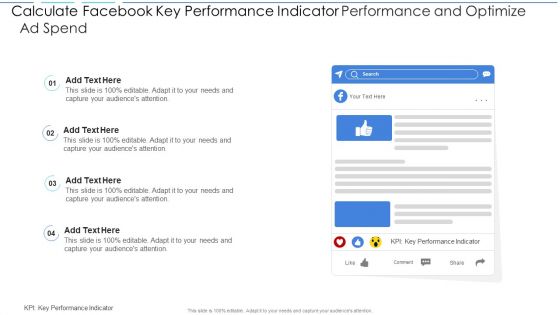
Calculate Facebook Key Performance Indicator Performance And Optimize Ad Spend Brochure PDF
Showcasing this set of slides titled calculate facebook key performance indicator performance and optimize ad spend brochure pdf. The topics addressed in these templates are calculate facebook key performance indicator performance and optimize ad spend. All the content presented in this PPT design is completely editable. Download it and make adjustments in color, background, font etc. as per your unique business setting.
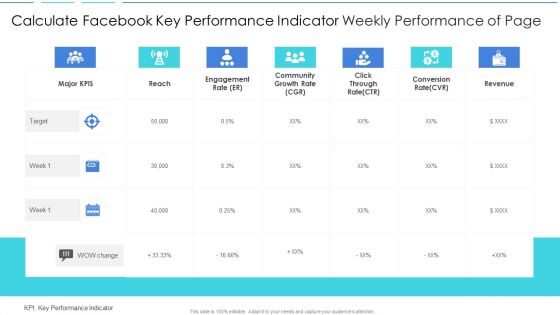
Calculate Facebook Key Performance Indicator Weekly Performance Of Page Elements PDF
Pitch your topic with ease and precision using this calculate facebook key performance indicator weekly performance of page elements pdf. This layout presents information on calculate facebook key performance indicator weekly performance of page. It is also available for immediate download and adjustment. So, changes can be made in the color, design, graphics or any other component to create a unique layout.
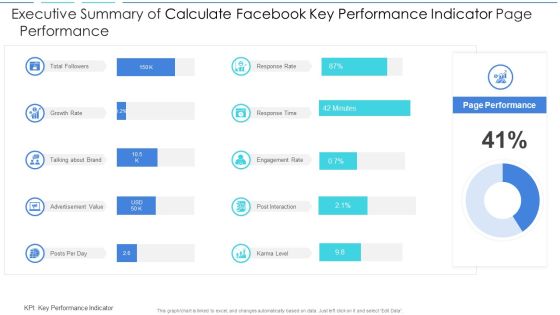
Executive Summary Of Calculate Facebook Key Performance Indicator Page Performance Download PDF
Showcasing this set of slides titled executive summary of calculate facebook key performance indicator page performance download pdf. The topics addressed in these templates are executive summary of calculate facebook key performance indicator page performance. All the content presented in this PPT design is completely editable. Download it and make adjustments in color, background, font etc. as per your unique business setting.
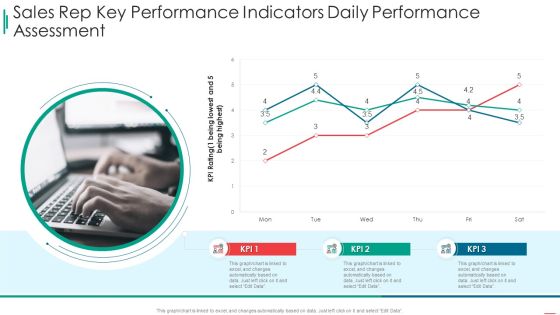
Sales Rep Scorecard Sales Rep Key Performance Indicators Daily Performance Assessment Sample PDF
Deliver and pitch your topic in the best possible manner with this sales rep scorecard sales rep key performance indicators daily performance assessment sample pdf. Use them to share invaluable insights on sales rep key performance indicators daily performance assessment and impress your audience. This template can be altered and modified as per your expectations. So, grab it now.

Boosting Yearly Business Revenue Quarterly Sales Goals With Key Metrics Demonstration PDF
This slide can be used by sales managers to represents sales goals per quarter using various metrics. It includes metrics such as sales growth, customer acquisition cost, sales cycle length, customer churn rate, average revenue per unit, etc. Do you have an important presentation coming up Are you looking for something that will make your presentation stand out from the rest Look no further than Boosting Yearly Business Revenue Quarterly Sales Goals With Key Metrics Demonstration PDF. With our professional designs, you can trust that your presentation will pop and make delivering it a smooth process. And with Slidegeeks, you can trust that your presentation will be unique and memorable. So why wait Grab Boosting Yearly Business Revenue Quarterly Sales Goals With Key Metrics Demonstration PDF today and make your presentation stand out from the rest.
 Home
Home