Kpis
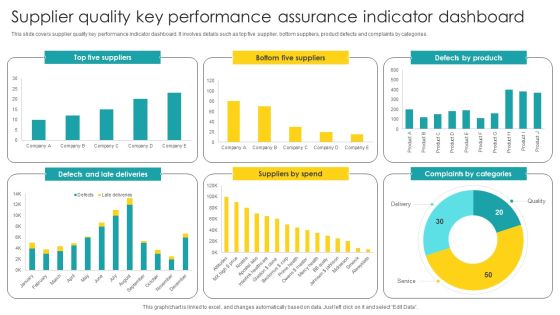
Supplier Quality Key Performance Assurance Indicator Dashboard Diagrams PDF
Showcasing this set of slides titled Supplier Quality Key Performance Assurance Indicator Dashboard Diagrams PDF. The topics addressed in these templates are Supplier Quality, Key Performance, Assurance Indicator. All the content presented in this PPT design is completely editable. Download it and make adjustments in color, background, font etc. as per your unique business setting.

Quality Key Performance Assurance Indicator Dashboard For Procurement Elements PDF
Pitch your topic with ease and precision using this Quality Key Performance Assurance Indicator Dashboard For Procurement Elements PDF. This layout presents information on Indicator Dashboard, Procurement. It is also available for immediate download and adjustment. So, changes can be made in the color, design, graphics or any other component to create a unique layout.

Key Performance Indicators Related To Upsell Structure PDF
Deliver an awe inspiring pitch with this creative key performance indicators related to upsell structure pdf bundle. Topics like product manufactured, target can be discussed with this completely editable template. It is available for immediate download depending on the needs and requirements of the user.

Sales Operating Cycle Key Performance Indicators Professional PDF
Presenting Sales Operating Cycle Key Performance Indicators Professional PDF to dispense important information. This template comprises three stages. It also presents valuable insights into the topics including Sales Comparison, Lead Conversation, Quality Product. This is a completely customizable PowerPoint theme that can be put to use immediately. So, download it and address the topic impactfully.

Dashboards Showing Consultancy Company Performance With Key Metrics Ppt Ideas Smartart PDF
This slide shows the dashboard related to consultancy company performance which includes budget preparation, sales and goals. Company profits and goals etc. Deliver an awe-inspiring pitch with this creative dashboards showing consultancy company performance with key metrics ppt ideas smartart pdf bundle. Topics like budget, products, customers can be discussed with this completely editable template. It is available for immediate download depending on the needs and requirements of the user.

KPI Metrics Dashboard Highlighting Employee Retention Rate Structure PDF
The purpose of this slide is to exhibit a key performance indicator KPI dashboard through which managers can analyze the monthly employee retention rate. The metrics covered in the slide are active employees, new candidates hired, internal, exit, employee turnover rate, etc. Do you have to make sure that everyone on your team knows about any specific topic I yes, then you should give KPI Metrics Dashboard Highlighting Employee Retention Rate Structure PDF a try. Our experts have put a lot of knowledge and effort into creating this impeccable KPI Metrics Dashboard Highlighting Employee Retention Rate Structure PDF. You can use this template for your upcoming presentations, as the slides are perfect to represent even the tiniest detail. You can download these templates from the Slidegeeks website and these are easy to edit. So grab these today.
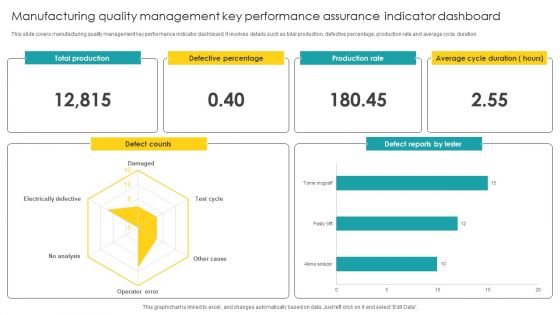
Manufacturing Quality Management Key Performance Assurance Indicator Dashboard Microsoft PDF
Pitch your topic with ease and precision using this Manufacturing Quality Management Key Performance Assurance Indicator Dashboard Microsoft PDF. This layout presents information on Quality Management, Key Performance Assurance. It is also available for immediate download and adjustment. So, changes can be made in the color, design, graphics or any other component to create a unique layout.

Yearly Sales Assessment With Key Performance Indicator Matrix Introduction PDF
This slide covers quarterly product units sold through out a financial year in an organization with growth in revenue, profit and number of customer from previous years sales. It includes product sold and growth rate. Presenting Yearly Sales Assessment With Key Performance Indicator Matrix Introduction PDF to dispense important information. This template comprises four stages. It also presents valuable insights into the topics including Sold Growth Rate, Customers, Growth In Profit. This is a completely customizable PowerPoint theme that can be put to use immediately. So, download it and address the topic impactfully.

Kpi Metrics Dashboard Post Resolving Workplace Conflict Microsoft PDF
The purpose of this slide is to outline key performance indicator KPI dashboard showcasing the results post resolving organizational conflicts. The metrics covered in this slide are conflicts by departments, conflicts logged by gender etc. Do you know about Slidesgeeks Kpi Metrics Dashboard Post Resolving Workplace Conflict Microsoft PDF These are perfect for delivering any kind od presentation. Using it, create PowerPoint presentations that communicate your ideas and engage audiences. Save time and effort by using our pre designed presentation templates that are perfect for a wide range of topic. Our vast selection of designs covers a range of styles, from creative to business, and are all highly customizable and easy to edit. Download as a PowerPoint template or use them as Google Slides themes.

KPI Metrics Dashboard Highlighting Organization Revenue Profitability And Liquidity Formats PDF
The following slide outlines key performance indicator KPI dashboard showcasing various financial metrics of the organization. The key metrics are gross revenue, product revenue, service revenue, gross profit, net profit etc. From laying roadmaps to briefing everything in detail, our templates are perfect for you. You can set the stage with your presentation slides. All you have to do is download these easy to edit and customizable templates. KPI Metrics Dashboard Highlighting Organization Revenue Profitability And Liquidity Formats PDF will help you deliver an outstanding performance that everyone would remember and praise you for. Do download this presentation today.

Business Intelligence Dashboard Ppt Examples Slides
This is a business intelligence dashboard ppt examples slides. This is a four stage process. The stages in this process are metrics, scorecard, key performance indicator, numbers.

Key Evaluation Metrics Ppt PowerPoint Presentation Files
This is a key evaluation metrics ppt powerpoint presentation files. This is a five stage process. The stages in this process are icons, business, management, success, percentage.

Key Evaluation Metrics Ppt PowerPoint Presentation Model
This is a key evaluation metrics ppt powerpoint presentation model. This is a five stage process. The stages in this process are business, marketing, strategy, success, process.

Key Performance Management Metrics Powerpoint Slide Background
This is a key performance management metrics powerpoint slide background. This is a five stage process. The stages in this process are business, marketing, finance, icons, strategy.
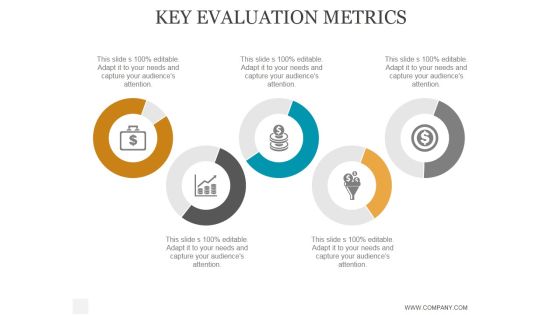
Key Evaluation Metrics Ppt PowerPoint Presentation Portfolio
This is a key evaluation metrics ppt powerpoint presentation portfolio. This is a five stage process. The stages in this process are business, strategy, marketing, analysis, success, icons.

Key Metrics Ppt PowerPoint Presentation Introduction
This is a key metrics ppt powerpoint presentation introduction. This is a five stage process. The stages in this process are icons, marketing, business, strategy.

Key Evaluation Metrics Ppt PowerPoint Presentation Gallery
This is a key evaluation metrics ppt powerpoint presentation gallery. This is a five stage process. The stages in this process are business, icons, marketing, strategy, success.

Key Evaluation Metrics Ppt PowerPoint Presentation Deck
This is a key evaluation metrics ppt powerpoint presentation deck. This is a five stage process. The stages in this process are business, strategy, marketing, analysis, finance, compare.

Key Metrics Ppt PowerPoint Presentation Rules
This is a key metrics ppt powerpoint presentation rules. This is a four stage process. The stages in this process are business, strategy, marketing, success, analysis, finance.
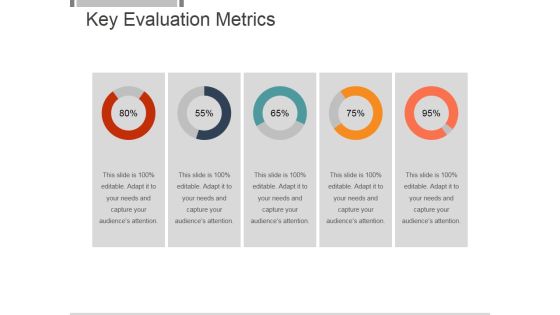
Key Evaluation Metrics Ppt PowerPoint Presentation Visuals
This is a key evaluation metrics ppt powerpoint presentation visuals. This is a five stage process. The stages in this process are layered, business, strategy, management, marketing.
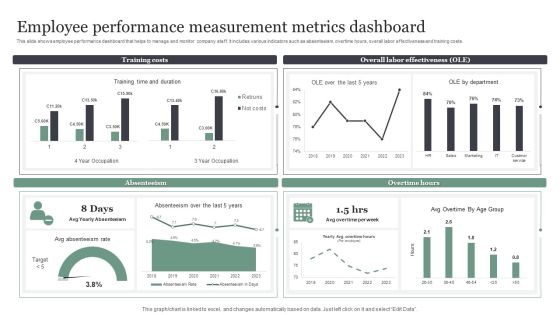
Employee Performance Measurement Metrics Dashboard Brochure PDF
This slide shows employee performance dashboard that helps to manage and monitor company staff. It includes various indicators such as absenteeism, overtime hours, overall labor effectiveness and training costs. Showcasing this set of slides titled Employee Performance Measurement Metrics Dashboard Brochure PDF. The topics addressed in these templates are Training Costs, Overall Labor Effectiveness. All the content presented in this PPT design is completely editable. Download it and make adjustments in color, background, font etc. as per your unique business setting.

Metrics To Measure Success Of Conversational Marketing Elements PDF
Purpose of the following slide is to display key metrics that can help organization in measuring the success of conversational marketing. These metrics can be segregated into 4 major categories such as artificial intelligence, chat, revenue growth and marketing metrics. Presenting Metrics To Measure Success Of Conversational Marketing Elements PDF to provide visual cues and insights. Share and navigate important information on four stages that need your due attention. This template can be used to pitch topics like Artificial Intelligence Metrics, Chat Metrics, Revenue Growth Metrics. In addtion, this PPT design contains high resolution images, graphics, etc, that are easily editable and available for immediate download.
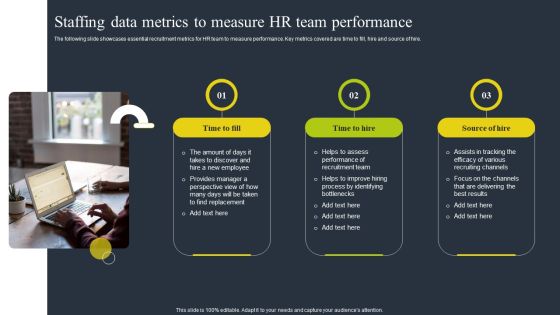
Staffing Data Metrics To Measure HR Team Performance Graphics PDF
The following slide showcases essential recruitment metrics for HR team to measure performance. Key metrics covered are time to fill, hire and source of hire. Presenting Staffing Data Metrics To Measure HR Team Performance Graphics PDF to dispense important information. This template comprises three stages. It also presents valuable insights into the topics including Employee, Recruitment Team, Recruiting Channels. This is a completely customizable PowerPoint theme that can be put to use immediately. So, download it and address the topic impactfully.

KPI Metrics Dashboard To Monitor Mobile Performing Mobile SEO Audit To Analyze Web Traffic Graphics PDF
The purpose of this slide is to outline key performance indicator KPI dashboard which will assist the marketer to analyze mobile search engine optimization SEO performance. The key metrics mentioned in the slide are total sessions, search engine rankings etc.Find highly impressive KPI Metrics Dashboard To Monitor Mobile Performing Mobile SEO Audit To Analyze Web Traffic Graphics PDF on Slidegeeks to deliver a meaningful presentation. You can save an ample amount of time using these presentation templates. No need to worry to prepare everything from scratch because Slidegeeks experts have already done a huge research and work for you. You need to download KPI Metrics Dashboard To Monitor Mobile Performing Mobile SEO Audit To Analyze Web Traffic Graphics PDF for your upcoming presentation. All the presentation templates are 100 precent editable and you can change the color and personalize the content accordingly. Download now.

Product Management Techniques Metric Dashboard To Measure Product Performance Microsoft PDF
This slide represents KPI dashboard for measuring product performance. It covers total activities, new customers, events, net promoter score etc. Deliver and pitch your topic in the best possible manner with this Product Management Techniques Metric Dashboard To Measure Product Performance Microsoft PDF. Use them to share invaluable insights on Activities, New Customers, Net Promoter Score and impress your audience. This template can be altered and modified as per your expectations. So, grab it now.

Website Medical Checkup Key Metrics Themes PDF
The following slide showcases key metrics for checking website health score to boost performance. It includes key metrics like functionality, security, design, structure, content and engagement. Pitch your topic with ease and precision using this Website Medical Checkup Key Metrics Themes PDF. This layout presents information on Evaluate Performance, Environment, Metrics. It is also available for immediate download and adjustment. So, changes can be made in the color, design, graphics or any other component to create a unique layout.
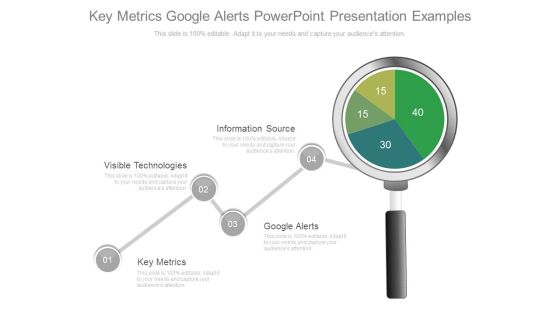
Key Metrics Google Alerts Powerpoint Presentation Examples
This is a key metrics google alerts powerpoint presentation examples. This is a four stage process. The stages in this process are key metrics, visible technologies, google alerts, information source.
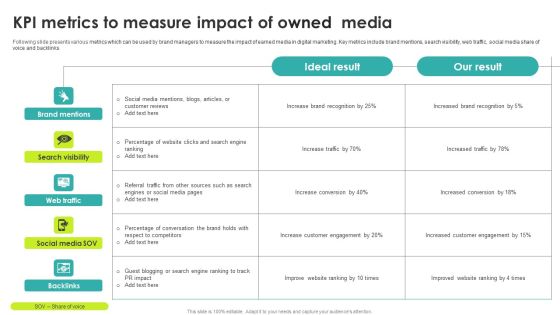
Kpi Metrics To Measure Impact Of Owned Media Brochure PDF
Following slide presents various metrics which can be used by brand managers to measure the impact of earned media in digital marketing. Key metrics include brand mentions, search visibility, web traffic, social media share of voice and backlinks Showcasing this set of slides titled Kpi Metrics To Measure Impact Of Owned Media Brochure PDF. The topics addressed in these templates are Web Traffic, Search Visibility, Ideal Result. All the content presented in this PPT design is completely editable. Download it and make adjustments in color, background, font etc. as per your unique business setting.
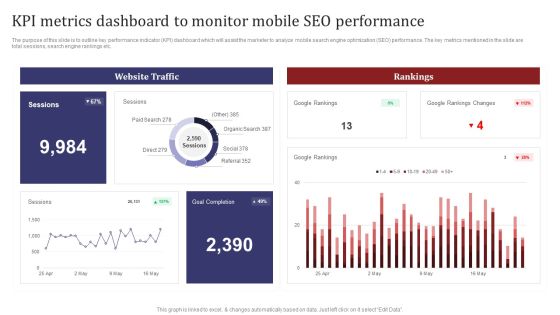
Mobile Search Engine Optimization Plan KPI Metrics Dashboard To Monitor Mobile SEO Performance Inspiration PDF
The purpose of this slide is to outline key performance indicator KPI dashboard which will assist the marketer to analyze mobile search engine optimization SEO performance. The key metrics mentioned in the slide are total sessions, search engine rankings etc. This Mobile Search Engine Optimization Plan KPI Metrics Dashboard To Monitor Mobile SEO Performance Inspiration PDF from Slidegeeks makes it easy to present information on your topic with precision. It provides customization options, so you can make changes to the colors, design, graphics, or any other component to create a unique layout. It is also available for immediate download, so you can begin using it right away. Slidegeeks has done good research to ensure that you have everything you need to make your presentation stand out. Make a name out there for a brilliant performance.

Utilizing SEO To Boost Customer KPI Metrics Dashboard To Monitor Mobile Seo Performance Download PDF
The purpose of this slide is to outline key performance indicator KPI dashboard which will assist the marketer to analyze mobile search engine optimization SEO performance. The key metrics mentioned in the slide are total sessions, search engine rankings etc. Coming up with a presentation necessitates that the majority of the effort goes into the content and the message you intend to convey. The visuals of a PowerPoint presentation can only be effective if it supplements and supports the story that is being told. Keeping this in mind our experts created Utilizing SEO To Boost Customer KPI Metrics Dashboard To Monitor Mobile Seo Performance Download PDF to reduce the time that goes into designing the presentation. This way, you can concentrate on the message while our designers take care of providing you with the right template for the situation.
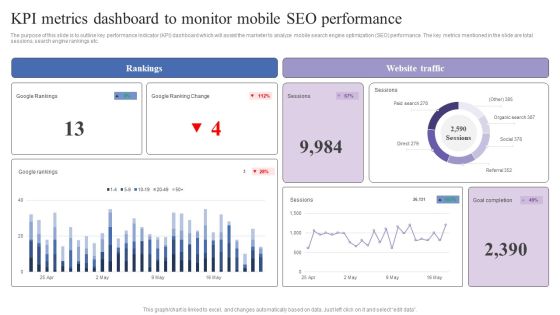
KPI Metrics Dashboard To Monitor Mobile Seo Performance Mobile Search Engine Optimization Guide Professional PDF
The purpose of this slide is to outline key performance indicator KPI dashboard which will assist the marketer to analyze mobile search engine optimization SEO performance. The key metrics mentioned in the slide are total sessions, search engine rankings etc. Slidegeeks has constructed KPI Metrics Dashboard To Monitor Mobile Seo Performance Mobile Search Engine Optimization Guide Professional PDF after conducting extensive research and examination. These presentation templates are constantly being generated and modified based on user preferences and critiques from editors. Here, you will find the most attractive templates for a range of purposes while taking into account ratings and remarks from users regarding the content. This is an excellent jumping-off point to explore our content and will give new users an insight into our top-notch PowerPoint Templates.
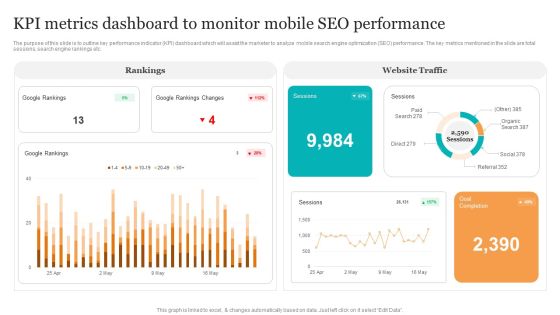
KPI Metrics Dashboard To Monitor Mobile Seo Performance Search Engine Optimization Services To Minimize Graphics PDF
The purpose of this slide is to outline key performance indicator KPI dashboard which will assist the marketer to analyze mobile search engine optimization SEO performance. The key metrics mentioned in the slide are total sessions, search engine rankings etc. Present like a pro with KPI Metrics Dashboard To Monitor Mobile Seo Performance Search Engine Optimization Services To Minimize Graphics PDF Create beautiful presentations together with your team, using our easy-to-use presentation slides. Share your ideas in real-time and make changes on the fly by downloading our templates. So whether you are in the office, on the go, or in a remote location, you can stay in sync with your team and present your ideas with confidence. With Slidegeeks presentation got a whole lot easier. Grab these presentations today.
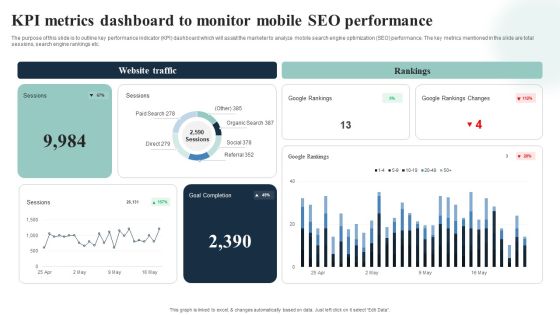
Introduction To Mobile SEM KPI Metrics Dashboard To Monitor Mobile SEO Performance Diagrams PDF
The purpose of this slide is to outline key performance indicator KPI dashboard which will assist the marketer to analyze mobile search engine optimization SEO performance. The key metrics mentioned in the slide are total sessions, search engine rankings etc. Take your projects to the next level with our ultimate collection of Introduction To Mobile SEM KPI Metrics Dashboard To Monitor Mobile SEO Performance Diagrams PDF. Slidegeeks has designed a range of layouts that are perfect for representing task or activity duration, keeping track of all your deadlines at a glance. Tailor these designs to your exact needs and give them a truly corporate look with your own brand colors they will make your projects stand out from the rest.

Strategies For Effective Product Metric Dashboard To Measure Product Performance Download PDF
This slide represents KPI dashboard for measuring product performance. It covers total activities, new customers, events, net promoter score etc. Welcome to our selection of the Strategies For Effective Product Metric Dashboard To Measure Product Performance Download PDF. These are designed to help you showcase your creativity and bring your sphere to life. Planning and Innovation are essential for any business that is just starting out. This collection contains the designs that you need for your everyday presentations. All of our PowerPoints are 100 percent editable, so you can customize them to suit your needs. This multi-purpose template can be used in various situations. Grab these presentation templates today.

Metrics To Measure Amazon Marketing Techniques Effectiveness Formats PDF
The mentioned slide showcases various key metrics to measure the performance of the current digital marketing strategy. The metrics include conversion rate, customer retention rate, churn rate, etc. Persuade your audience using this Metrics To Measure Amazon Marketing Techniques Effectiveness Formats PDF. This PPT design covers three stages, thus making it a great tool to use. It also caters to a variety of topics including Effectiveness, Marketing, Measure. Download this PPT design now to present a convincing pitch that not only emphasizes the topic but also showcases your presentation skills.

Metric Dashboard To Measure Product Performance Product Development And Management Plan Demonstration PDF
This slide represents dashboard for tracking product success. It covers new customer, total sessions, purchase, total inquires, total crashes etc.If your project calls for a presentation, then Slidegeeks is your go to partner because we have professionally designed, easy to edit templates that are perfect for any presentation. After downloading, you can easily edit Metric Dashboard To Measure Product Performance Product Development And Management Plan Demonstration PDF and make the changes accordingly. You can rearrange slides or fill them with different images. Check out all the handy templates.

Five Metrics To Measure Marketing Campaign Results Graphics PDF
The purpose of this slide is to showcase various metrics which will assist marketer to measure and evaluate the marketing campaign results. The key metrics could be Cost per lead customer lifetime value conversion rate website traffic and average session duration.Presenting Five Metrics To Measure Marketing Campaign Results Graphics PDF to dispense important information. This template comprises Five stages. It also presents valuable insights into the topics including Customer Lifetime Value, Cost Per Lead, Conversion Rate. This is a completely customizable PowerPoint theme that can be put to use immediately. So, download it and address the topic impactfully.

Key Evaluation Metrics Ppt PowerPoint Presentation Influencers
This is a key evaluation metrics ppt powerpoint presentation influencers. This is a five stage process. The stages in this process are icons, percentage, marketing, management.
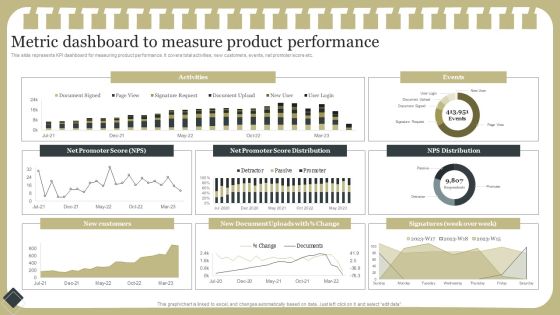
Effective Product Development Strategy Metric Dashboard To Measure Product Performance Information PDF
This slide represents KPI dashboard for measuring product performance. It covers total activities, new customers, events, net promoter score etc.Coming up with a presentation necessitates that the majority of the effort goes into the content and the message you intend to convey. The visuals of a PowerPoint presentation can only be effective if it supplements and supports the story that is being told. Keeping this in mind our experts created Effective Product Development Strategy Metric Dashboard To Measure Product Performance Information PDF to reduce the time that goes into designing the presentation. This way, you can concentrate on the message while our designers take care of providing you with the right template for the situation.
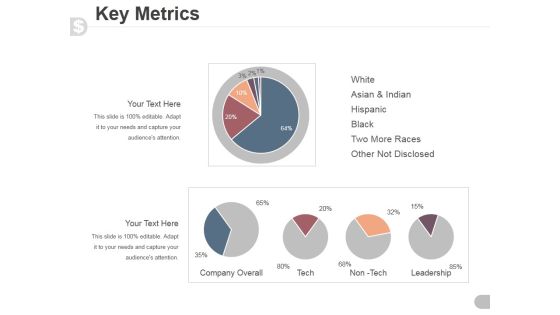
Key Metrics Ppt PowerPoint Presentation Visual Aids
This is a key metrics ppt powerpoint presentation visual aids. This is a five stage process. The stages in this process are white, asian and indian, hispanic, black, two more races, other not disclosed.

Customer Communication Service Plan Progress Measurement Metrics Diagrams PDF
The following slide highlights the customer contact strategy progress measurement metrics illustrating key headings which includes metrics, description, benchmark and value. In metrics it depicts customer retention, customer visit, order per customer, sales amount, cross sales, referrals, referrals response rate and customer lifetime value Persuade your audience using this one. This PPT design covers one stages, thus making it a great tool to use. It also caters to a variety of topics including Customer Retention, Customer Visit, Order Per Customer. Download this PPT design now to present a convincing pitch that not only emphasizes the topic but also showcases your presentation skills.
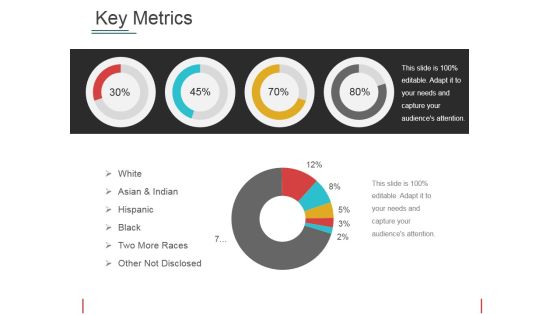
Key Metrics Ppt PowerPoint Presentation Model Professional
This is a key metrics ppt powerpoint presentation model professional. This is a four stage process. The stages in this process are white, asian and indian, hispanic, black, two more races, other not disclosed.

Key Metrics Ppt PowerPoint Presentation Layouts Good
This is a key metrics ppt powerpoint presentation layouts good. This is a five stage process. The stages in this process are new customers per month, customer satisfaction, customer retention rate, lead conversion rate, on time delivery.
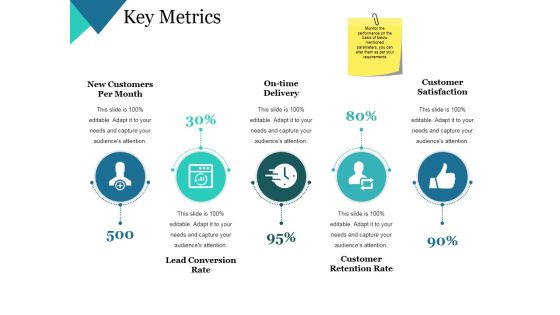
Key Metrics Ppt PowerPoint Presentation Themes
This is a key metrics ppt powerpoint presentation themes. This is a five stage process. The stages in this process are new customers per month, on time delivery, customer satisfaction, customer retention rate, lead conversion rate.
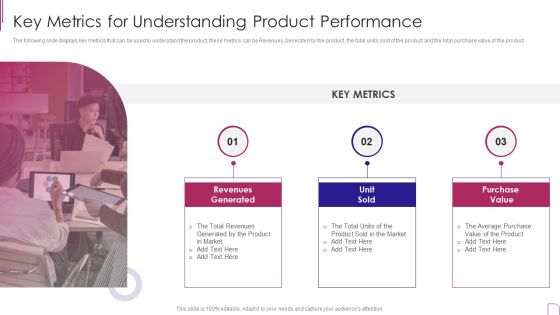
Yearly Product Performance Assessment Repor Key Metrics For Understanding Product Formats PDF
The following slide displays key metrics that can be used to understand the product, these metrics can be Revenues Generated by the product, the total units sold of the product and the total purchase value of the product.Presenting Yearly Product Performance Assessment Repor Key Metrics For Understanding Product Formats PDF to provide visual cues and insights. Share and navigate important information on three stages that need your due attention. This template can be used to pitch topics like Revenues Generated, Purchase Value, Generated Product In addtion, this PPT design contains high resolution images, graphics, etc, that are easily editable and available for immediate download.
Metrics For Measuring Strategic Customer Service Performance Analysis Icons PDF
This slide illustrate various type of customer service key performance indictors that is used to monitor business activities. It includes metrices such as average resolution time, customer service abandonment rate, customer retention rate, net promoter score and first contact resolution rate. Presenting Metrics For Measuring Strategic Customer Service Performance Analysis Icons PDF to dispense important information. This template comprises five stages. It also presents valuable insights into the topics including Average Resolution Time, Customer Retention Rate, Customer Service Abandonment Rate. This is a completely customizable PowerPoint theme that can be put to use immediately. So, download it and address the topic impactfully.
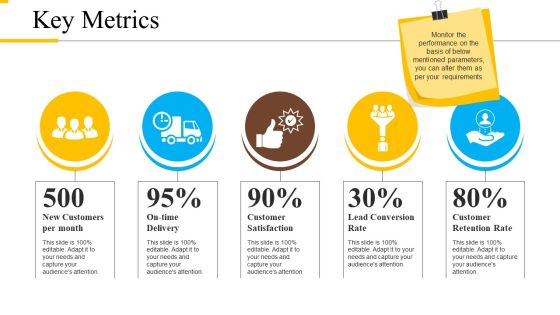
Key Metrics Ppt PowerPoint Presentation Professional Slideshow
This is a key metrics ppt powerpoint presentation professional slideshow. This is a five stage process. The stages in this process are new customers per month, on time delivery, customer satisfaction, lead conversion rate, customer retention rate.
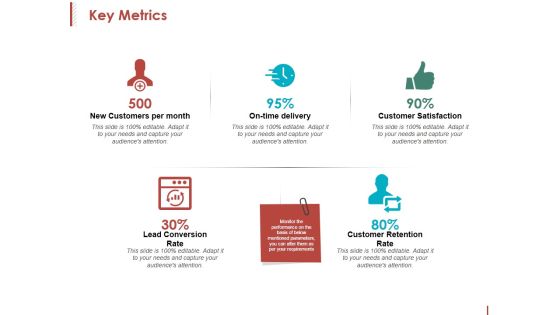
Key Metrics Ppt PowerPoint Presentation Inspiration Format
This is a key metrics ppt powerpoint presentation inspiration format. This is a five stage process. The stages in this process are new customers per month, on time delivery, customer satisfaction, customer retention rate.

Tools For Customer Service Metrics Measurement And Tracking Download PDF
This slide showcases tools that can help to measure and track the customer service metrics. Its key components are tools, features, free trial, paid version and user reviews. Persuade your audience using this Tools For Customer Service Metrics Measurement And Tracking Download PDF. This PPT design covers four stages, thus making it a great tool to use. It also caters to a variety of topics including Data Visualization, Custom Reports, Goal Tracking. Download this PPT design now to present a convincing pitch that not only emphasizes the topic but also showcases your presentation skills.

Corporate Risk Metrics Dashboard And Control Dashboard With Expenditure Inspiration PDF
This slide illustrates corporate risk key performance indicators. It includes graphs of inherent risks, overdue risks, risk control data. Showcasing this set of slides titled Corporate Risk Metrics Dashboard And Control Dashboard With Expenditure Inspiration PDF. The topics addressed in these templates are Expenditure, Risk Management, Organization Risk. All the content presented in this PPT design is completely editable. Download it and make adjustments in color, background, font etc. as per your unique business setting.

PIM Software Deployment To Enhance Conversion Rates Enterprise Product Page Information Key Metrics Dashboard Mockup PDF
This slide represents key metrics dashboard showing information related to enterprise products. It includes details related to report breakdown, product grade distribution etc. This PIM Software Deployment To Enhance Conversion Rates Enterprise Product Page Information Key Metrics Dashboard Mockup PDF from Slidegeeks makes it easy to present information on your topic with precision. It provides customization options, so you can make changes to the colors, design, graphics, or any other component to create a unique layout. It is also available for immediate download, so you can begin using it right away. Slidegeeks has done good research to ensure that you have everything you need to make your presentation stand out. Make a name out there for a brilliant performance.
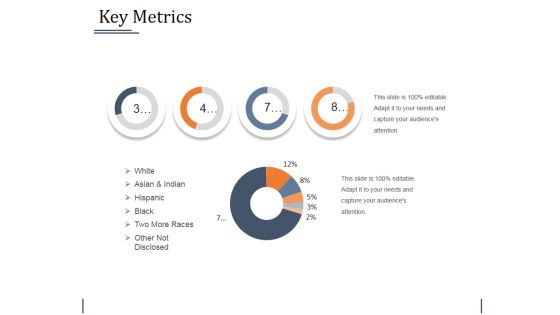
Key Metrics Ppt PowerPoint Presentation Outline Templates
This is a key metrics ppt powerpoint presentation outline templates. This is a four stage process. The stages in this process are white, asian and indian, hispanic, black, two more races, other not disclosed.
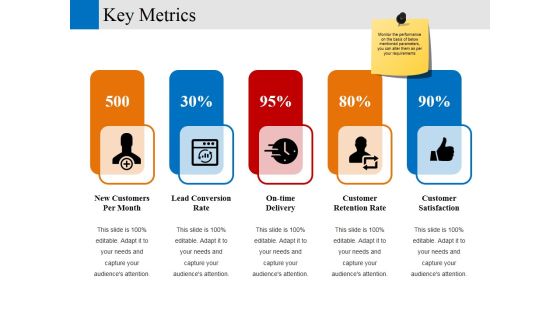
Key Metrics Ppt PowerPoint Presentation Layouts Ideas
This is a key metrics ppt powerpoint presentation layouts ideas. This is a five stage process. The stages in this process are new customers per month, lead conversion rate, on time delivery, customer retention rate, customer satisfaction.
Metrics To Measure Results Of Performance Marketing Campaign Sample PDF
This slide showcases metrics that can help organization to track the effectiveness of performance advertisement campaign. Its key components are cost per click, cost per sales, cost per impression and cost per lead. Want to ace your presentation in front of a live audience Our Metrics To Measure Results Of Performance Marketing Campaign Sample PDF can help you do that by engaging all the users towards you. Slidegeeks experts have put their efforts and expertise into creating these impeccable powerpoint presentations so that you can communicate your ideas clearly. Moreover, all the templates are customizable, and easy-to-edit and downloadable. Use these for both personal and commercial use.

Dashboard Measure Ppt PowerPoint Presentation Ideas Samples
This is a dashboard measure ppt powerpoint presentation ideas samples. This is a three stage process. The stages in this process are dashboard, business, marketing, management, strategy.

Key Performance Indicators Cycle Ppt Slide
This is a key performance indicators cycle ppt slide. This is a five stage process. The stages in this process are key performance indicators, kpi.
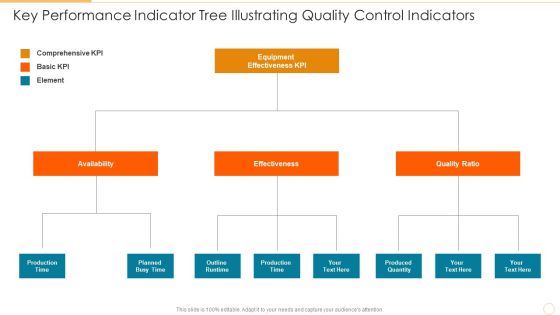
Key Performance Indicator Tree Illustrating Quality Control Indicators Information PDF
Presenting key performance indicator tree illustrating quality control indicators information pdf to dispense important information. This template comprises three stages. It also presents valuable insights into the topics including availability, effectiveness, quality ratio. This is a completely customizable PowerPoint theme that can be put to use immediately. So, download it and address the topic impactfully.
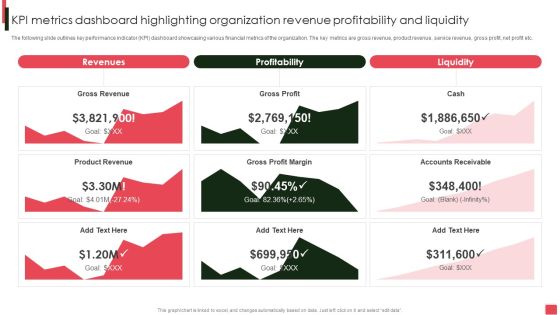
Overview Of Organizational Kpi Metrics Dashboard Highlighting Organization Revenue Brochure PDF
The following slide outlines key performance indicator KPI dashboard showcasing various financial metrics of the organization. The key metrics are gross revenue, product revenue, service revenue, gross profit, net profit etc. If your project calls for a presentation, then Slidegeeks is your go-to partner because we have professionally designed, easy-to-edit templates that are perfect for any presentation. After downloading, you can easily edit Overview Of Organizational Kpi Metrics Dashboard Highlighting Organization Revenue Brochure PDF and make the changes accordingly. You can rearrange slides or fill them with different images. Check out all the handy templates.

Brand And Performance Marketing Services And Metrics Themes PDF
The slide showcases services offered by brand and performance marketing, which helps differentiate between them. There are a few services that are offered by both. The most common elements are the services that are provided by these marketing types, as well as key performance indicators. Presenting Brand And Performance Marketing Services And Metrics Themes PDF to dispense important information. This template comprises three stages. It also presents valuable insights into the topics including Services Provided, Services Provided, Services Provided Performance Marketing. This is a completely customizable PowerPoint theme that can be put to use immediately. So, download it and address the topic impactfully.

Estimating Business Overall Kpi Metrics Dashboard Highlighting Organization Revenue Clipart PDF
The following slide outlines key performance indicator KPI dashboard showcasing various financial metrics of the organization. The key metrics are gross revenue, product revenue, service revenue, gross profit, net profit etc. Formulating a presentation can take up a lot of effort and time, so the content and message should always be the primary focus. The visuals of the PowerPoint can enhance the presenters message, so our Estimating Business Overall Kpi Metrics Dashboard Highlighting Organization Revenue Clipart PDF was created to help save time. Instead of worrying about the design, the presenter can concentrate on the message while our designers work on creating the ideal templates for whatever situation is needed. Slidegeeks has experts for everything from amazing designs to valuable content, we have put everything into Estimating Business Overall Kpi Metrics Dashboard Highlighting Organization Revenue Clipart PDF.
 Home
Home