Kpis
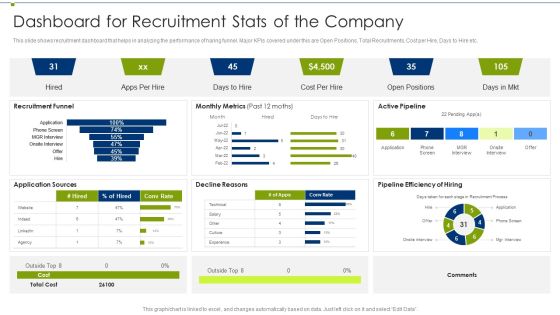
Recruitment Training Program For Workforce Dashboard For Recruitment Stats Of The Company Slides PDF
This slide shows recruitment dashboard that helps in analyzing the performance of haring funnel. Major KPIs covered under this are Open Positions, Total Recruitments, Cost per Hire, Days to Hire etc.Deliver and pitch your topic in the best possible manner with this Recruitment Training Program For Workforce Dashboard For Recruitment Stats Of The Company Slides PDF Use them to share invaluable insights on Recruitment Funnel, Decline Reasons, Pipeline Efficiency Of Hiring and impress your audience. This template can be altered and modified as per your expectations. So, grab it now.
Why Is Agile Cost Effective IT Agile Dashboard For Tracking Sprint Progress Designs PDF
Mentioned slide displays agile dashboard that can be used by organization to track sprint progress. KPIs covered here are overall sprint progress, statistics by priority and statistics by status. Deliver an awe inspiring pitch with this creative Why Is Agile Cost Effective IT Agile Dashboard For Tracking Sprint Progress Designs PDF bundle. Topics like Assignee, Statistics By Priority, Progress, Contract Review can be discussed with this completely editable template. It is available for immediate download depending on the needs and requirements of the user.

Cios Value Optimization Determine IT Department Cost Management Dashboard Microsoft PDF
This slide provides information regarding IT department cost management dashboard including KPIs such as return on investment of IT department, spend vs. budget, IT cost breakdown and IT costs vs. revenues. Deliver and pitch your topic in the best possible manner with this Cios Value Optimization Determine IT Department Cost Management Dashboard Microsoft PDF. Use them to share invaluable insights on IT Costs, Return Investment, IT Department and impress your audience. This template can be altered and modified as per your expectations. So, grab it now.

Automating Supply Chain Dashboard For Tracking Impact Of Procurement Process Automation Themes PDF
This slide covers the dashboard for analysing procurement performance after automation. It include KPIs such as on-time delivery, percentage of returns, compliance index percentage, procurement ROI, cost-saving, budget spent on training, etc. Deliver an awe inspiring pitch with this creative Automating Supply Chain Dashboard For Tracking Impact Of Procurement Process Automation Themes PDF bundle. Topics like Procurement ROI, Cost Saving, Perform Procurement can be discussed with this completely editable template. It is available for immediate download depending on the needs and requirements of the user.

Automating Supply Chain Dashboard For Tracking Impact Of Supply Chain Automation Pictures PDF
This slide covers the dashboard for back-end tracking of overall impact automation. It include KPIs such as retailer capacity, warehouse capacity, truck efficiency, time to reach warehouse, sustainability, etc. Deliver and pitch your topic in the best possible manner with this Automating Supply Chain Dashboard For Tracking Impact Of Supply Chain Automation Pictures PDF. Use them to share invaluable insights on Supply Chain Manager, Warehouse Manager, Truck Driver and impress your audience. This template can be altered and modified as per your expectations. So, grab it now.

Automating Supply Chain Dashboard For Tracking Impact Of Transport Automation Themes PDF
This slide covers the dashboard for tracking vehicle efficiency after transport automation. It include KPIs such as truck turnaround time, average revenue per hour, truckload capacity, transit time, on-time pickup, and average revenue per mile. Deliver an awe inspiring pitch with this creative Automating Supply Chain Dashboard For Tracking Impact Of Transport Automation Themes PDF bundle. Topics like Average Revenue, Per Mile, Truck Turnaround can be discussed with this completely editable template. It is available for immediate download depending on the needs and requirements of the user.

Automating Supply Chain Dashboard For Tracking Impact Of Warehouse House Automation Graphics PDF
This slide covers the dashboard with after automation warehouse overview. It include KPIs such as autonomous robots status, robotic arms status, battery level, performance, time to return, etc. Deliver and pitch your topic in the best possible manner with this Automating Supply Chain Dashboard For Tracking Impact Of Warehouse House Automation Graphics PDF. Use them to share invaluable insights on Autonomous Robot, Robotic Arms, Systems Engineer and impress your audience. This template can be altered and modified as per your expectations. So, grab it now.

Cios Methodologies To Improve IT Spending Determine It Department Cost Management Dashboard Diagrams PDF
This slide provides information regarding IT department cost management dashboard including KPIs such as return on investment of IT department, spend vs. budget, IT cost breakdown and IT costs vs. revenues. Deliver and pitch your topic in the best possible manner with this Cios Methodologies To Improve IT Spending Determine It Department Cost Management Dashboard Diagrams PDF Use them to share invaluable insights on Extent Organizational, Reprioritization Cancellation, Investment Required and impress your audience. This template can be altered and modified as per your expectations. So, grab it now.

IT Threats Response Playbook Real Time Incident Management Dashboard Formats PDF
Following slide illustrate KPI dashboard that can be used by organizations to track real time incident data. Kpis covered are number of tickets, average resolution time per customer, incidents registered per month. Presenting IT Threats Response Playbook Real Time Incident Management Dashboard Formats PDF to provide visual cues and insights. Share and navigate important information on four stages that need your due attention. This template can be used to pitch topics like Resolved Tickets, Average Resolution, Incidents Registered. In addtion, this PPT design contains high resolution images, graphics, etc, that are easily editable and available for immediate download.
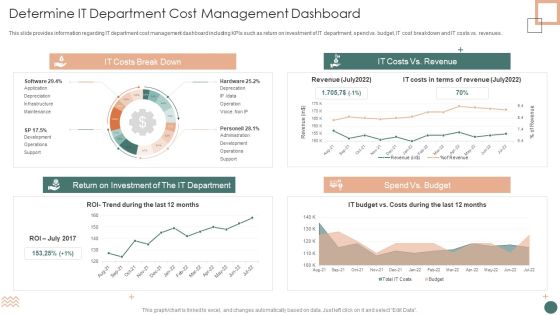
Improved Digital Expenditure Determine IT Department Cost Management Dashboard Introduction PDF
This slide provides information regarding IT department cost management dashboard including KPIs such as return on investment of IT department, spend vs. budget, IT cost breakdown and IT costs vs. revenues. Deliver and pitch your topic in the best possible manner with this Improved Digital Expenditure Determine IT Department Cost Management Dashboard Introduction PDF. Use them to share invaluable insights on Return Investment, Depreciation, Costs Break and impress your audience. This template can be altered and modified as per your expectations. So, grab it now.

CIO For IT Cost Optimization Techniques Determine IT Department Cost Management Dashboard Introduction PDF
This slide provides information regarding IT department cost management dashboard including KPIs such as return on investment of IT department, spend vs. budget, IT cost breakdown and IT costs vs. revenues. Deliver and pitch your topic in the best possible manner with this CIO For IT Cost Optimization Techniques Determine IT Department Cost Management Dashboard Introduction PDF. Use them to share invaluable insights on Costs, Budget, Revenue and impress your audience. This template can be altered and modified as per your expectations. So, grab it now.
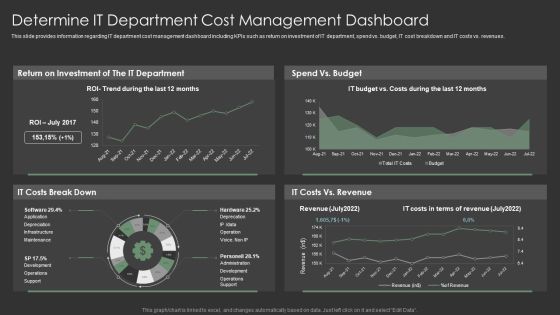
IT Spend Management Priorities By Cios Determine IT Department Cost Management Dashboard Pictures PDF
This slide provides information regarding IT department cost management dashboard including KPIs such as return on investment of IT department, spend vs. budget, IT cost breakdown and IT costs vs. revenues. Deliver and pitch your topic in the best possible manner with this IT Spend Management Priorities By Cios Determine IT Department Cost Management Dashboard Pictures PDF. Use them to share invaluable insights on Revenue, Costs, Budget and impress your audience. This template can be altered and modified as per your expectations. So, grab it now.

ISO 27001 Organizational Qualifying Procedure Dashboard For Information Security Risk Management Background PDF
This slide displays dashboard for information security risk management. It includes KPIs such as risk analysis progress, persent risk, response progress for risks and number of risks encountered.Deliver and pitch your topic in the best possible manner with this ISO 27001 Organizational Qualifying Procedure Dashboard For Information Security Risk Management Background PDF. Use them to share invaluable insights on Analysis Progress, Response Progress, Plan Breakdown and impress your audience. This template can be altered and modified as per your expectations. So, grab it now.

Performance Tracking Dashboard For E Marketplace Platform Ppt Summary Gridlines PDF
This slide displays dashboard to track average sales of E-marketplace for organization to formulate appropriate strategies. It includes KPIs such as health, orders, dispatch status, overdue, etc. Showcasing this set of slides titled Performance Tracking Dashboard For E Marketplace Platform Ppt Summary Gridlines PDF. The topics addressed in these templates are Total Scale, Dispatch Status, Account, Health, Orders. All the content presented in this PPT design is completely editable. Download it and make adjustments in color, background, font etc. as per your unique business setting.

Consumer Acquisition And Retention Dashboard With Loyal Consumer Rate And CLV Brochure PDF
This slide contains the complete dashboard of customer retention and acquisition matrix details. It includes current and previous months comparison of various types of KPIs used for strong customer base like customer churn, revenue churn, net retention and MRR growth. Showcasing this set of slides titled Consumer Acquisition And Retention Dashboard With Loyal Consumer Rate And CLV Brochure PDF. The topics addressed in these templates are Consumer Churn, Revenue Churn, Premium Users. All the content presented in this PPT design is completely editable. Download it and make adjustments in color, background, font etc. as per your unique business setting.

Virtual Assets Investment Guide Dashboard To Effectively Track Bitcoin Performance Rules PDF
The following dashboard highlights key parameters that can be used by the organization to track the performance of their Bitcoin investment, it enlists major KPIs such as price of Bitcoin, transaction chart and its historical performance. Deliver an awe inspiring pitch with this creative Virtual Assets Investment Guide Dashboard To Effectively Track Bitcoin Performance Rules PDF bundle. Topics like Bitcoin Chart, Transaction Chart, Prediction Meter can be discussed with this completely editable template. It is available for immediate download depending on the needs and requirements of the user.
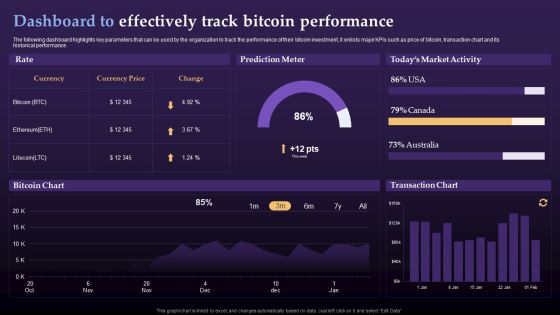
Virtual Currency Investment Guide For Companies Dashboard To Effectively Track Bitcoin Diagrams PDF
The following dashboard highlights key parameters that can be used by the organization to track the performance of their bitcoin investment, it enlists major KPIs such as price of bitcoin, transaction chart and its historical performance. Deliver an awe inspiring pitch with this creative Virtual Currency Investment Guide For Companies Dashboard To Effectively Track Bitcoin Diagrams PDF bundle. Topics like Prediction Meter, Todays Market Activity, Transaction Chart can be discussed with this completely editable template. It is available for immediate download depending on the needs and requirements of the user.
Warehouse Automation Deployment Dashboard For Tracking Impact Of Warehouse House Infographics PDF
This slide covers the dashboard with after automation warehouse overview. It include KPIs such as autonomous robots status, robotic arms status, battery level, performance, time to return, etc. Deliver and pitch your topic in the best possible manner with this Warehouse Automation Deployment Dashboard For Tracking Impact Of Warehouse House Infographics PDF. Use them to share invaluable insights on Autonomous Robot, Systems Engineer, Warehouse Manager and impress your audience. This template can be altered and modified as per your expectations. So, grab it now.

Method To Introduce New Product Offerings In The Industry Product Portfolio Monitoring Dashboard Template PDF
Mentioned slide shows a dashboard that can be used by a product manager to monitor different product portfolios developed and offered by the organization. KPIs included are portfolio budget, issues across portfolios and portfolio risks by impact. Deliver and pitch your topic in the best possible manner with this Method To Introduce New Product Offerings In The Industry Product Portfolio Monitoring Dashboard Template PDF. Use them to share invaluable insights on Portfolio Risks, Portfolio Budget and impress your audience. This template can be altered and modified as per your expectations. So, grab it now.

KPI Dashboard Of Technical Customer Support Service Ppt Layouts Professional PDF
This slide covers KPI dashboard of technical customer support service. It involves KPIs such as overdue tickets, problem types, tickets by customer types and detail about technical support engineers. Showcasing this set of slides titled KPI Dashboard Of Technical Customer Support Service Ppt Layouts Professional PDF. The topics addressed in these templates are Overdue Tickets, Problems Types, Technical Support Engineers. All the content presented in this PPT design is completely editable. Download it and make adjustments in color, background, font etc. as per your unique business setting.

Dashboard To Track Project Essential Activities Efficient Project Administration By Leaders Microsoft PDF
This slide provides information about dashboard to track project essential activities by tracking project KPIs in terms of schedule, budget, resources, risk issues, quality, etc.Boost your pitch with our creative Dashboard To Track Project Essential Activities Efficient Project Administration By Leaders Microsoft PDF. Deliver an awe-inspiring pitch that will mesmerize everyone. Using these presentation templates you will surely catch everyones attention. You can browse the ppts collection on our website. We have researchers who are experts at creating the right content for the templates. So you do not have to invest time in any additional work. Just grab the template now and use them.
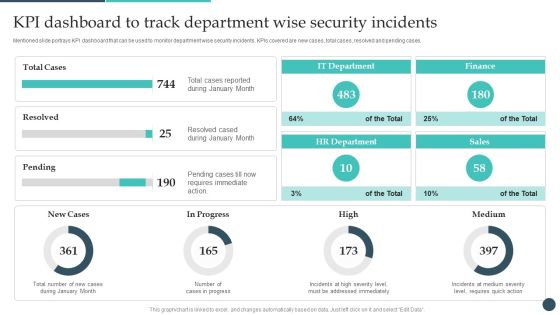
Safety Breach Response Playbook KPI Dashboard To Track Department Wise Rules PDF
Mentioned slide portrays KPI dashboard that can be used to monitor department wise security incidents. KPIs covered are new cases, total cases, resolved and pending cases. Present like a pro with Safety Breach Response Playbook KPI Dashboard To Track Department Wise Rules PDF Create beautiful presentations together with your team, using our easy-to-use presentation slides. Share your ideas in real-time and make changes on the fly by downloading our templates. So whether youre in the office, on the go, or in a remote location, you can stay in sync with your team and present your ideas with confidence. With Slidegeeks presentation got a whole lot easier. Grab these presentations today.

Dashboard To Track Project Essential Activities Project Administration Plan Playbook Elements PDF
This slide provides information about dashboard to track project essential activities by tracking project KPIs in terms of schedule, budget, resources, risk issues, quality, etc. Present like a pro with Dashboard To Track Project Essential Activities Project Administration Plan Playbook Elements PDF Create beautiful presentations together with your team, using our easy-to-use presentation slides. Share your ideas in real-time and make changes on the fly by downloading our templates. So whether you are in the office, on the go, or in a remote location, you can stay in sync with your team and present your ideas with confidence. With Slidegeeks presentation got a whole lot easier. Grab these presentations today.

Financial Kpi Dashboard To Evaluate Fundraising Impact Developing Fundraising Techniques Diagrams PDF
This slide showcases dashboard that can help organization to evaluate key changes in financial KPIs post fundraising. Its key components are net profit margin, revenue, gross profit margin, debt to equity and return on equity. From laying roadmaps to briefing everything in detail, our templates are perfect for you. You can set the stage with your presentation slides. All you have to do is download these easy-to-edit and customizable templates. Financial Kpi Dashboard To Evaluate Fundraising Impact Developing Fundraising Techniques Diagrams PDF will help you deliver an outstanding performance that everyone would remember and praise you for. Do download this presentation today.
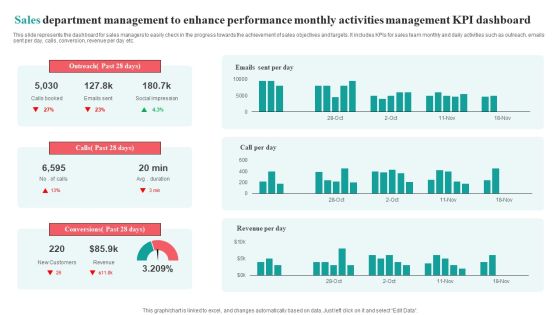
Sales Department Management To Enhance Performance Monthly Activities Management KPI Dashboard Brochure PDF
This slide represents the dashboard for sales managers to easily check in the progress towards the achievement of sales objectives and targets. It includes KPIs for sales team monthly and daily activities such as outreach, emails sent per day, calls, conversion, revenue per day etc.Pitch your topic with ease and precision using this Sales Department Management To Enhance Performance Monthly Activities Management KPI Dashboard Brochure PDF. This layout presents information on Social Impression, Conversions Past, Outreach Past. It is also available for immediate download and adjustment. So, changes can be made in the color, design, graphics or any other component to create a unique layout.

Cash Management Dashboard With Sales Outstanding And Liquidity Ratio Analysis Information PDF
This showcases dashboard that can help organization in cash management and track KPIs to evaluate the financial performance of company. It key components are liquidity ratios, cash balance. days sales outstanding, days inventory outstanding and days payable outstanding. Pitch your topic with ease and precision using this Cash Management Dashboard With Sales Outstanding And Liquidity Ratio Analysis Information PDF. This layout presents information on Cash Conversion, Working Capital, Cash Balance. It is also available for immediate download and adjustment. So, changes can be made in the color, design, graphics or any other component to create a unique layout.

Data Theft And Breach Threats Monitoring Dashboard Ppt Outline Designs PDF
This slide covers dashboard to monitor top data breaches and loss of confidential data in organization. It includes KPIs such percentage of data risks detected, number of data risks, data risk analysis, response progress for data risks, data risk ratings. Showcasing this set of slides titled Data Theft And Breach Threats Monitoring Dashboard Ppt Outline Designs PDF. The topics addressed in these templates are Number Risk Threshold, Data Analysts Progress, Action Plan Breakdown. All the content presented in this PPT design is completely editable. Download it and make adjustments in color, background, font etc. as per your unique business setting.

Optimizing Marketing Analytics To Enhance Organizational Growth Social Media Analytics KPI Dashboard Graphics PDF
This slide covers a dashboard for tracking social media KPIs such as face engagements, total likes, followers, audience growth, YouTube subscribers, views, Instagram reach and , likes, LinkedIn impressions, etc. From laying roadmaps to briefing everything in detail, our templates are perfect for you. You can set the stage with your presentation slides. All you have to do is download these easy to edit and customizable templates. Optimizing Marketing Analytics To Enhance Organizational Growth Social Media Analytics KPI Dashboard Graphics PDF will help you deliver an outstanding performance that everyone would remember and praise you for. Do download this presentation today.
Streamlining Operations With Supply Chain Automation Dashboard For Tracking Impact Of Supply Chain Automation Slides PDF
This slide covers the dashboard for back end tracking of overall impact automation. It include KPIs such as retailer capacity, warehouse capacity, truck efficiency, time to reach warehouse, sustainability, etc. There are so many reasons you need a Streamlining Operations With Supply Chain Automation Dashboard For Tracking Impact Of Supply Chain Automation Slides PDF. The first reason is you can not spend time making everything from scratch, Thus, Slidegeeks has made presentation templates for you too. You can easily download these templates from our website easily.
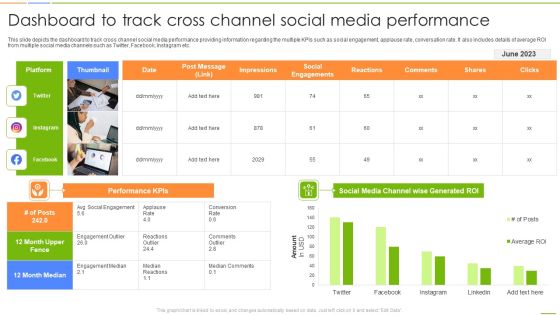
Social Media Channels Auditing Dashboard To Track Cross Channel Social Media Performance Formats PDF
This slide depicts the dashboard to track cross channel social media performance providing information regarding the multiple KPIs such as social engagement, applause rate, conversation rate. It also includes details of average ROI from multiple social media channels such as Twitter, Facebook, Instagram etc. From laying roadmaps to briefing everything in detail, our templates are perfect for you. You can set the stage with your presentation slides. All you have to do is download these easy-to-edit and customizable templates. Social Media Channels Auditing Dashboard To Track Cross Channel Social Media Performance Formats PDF will help you deliver an outstanding performance that everyone would remember and praise you for. Do download this presentation today.

Dashboard To Analyze Performance Of Google Adwords Strategic Campaign Inspiration PDF
This slide displays dashboard for real time tracking and monitoring of marketing KPIs to review campaign performance. It includes elements such as spend, conversions, clicks, impressions, CTR, etc. Pitch your topic with ease and precision using this Dashboard To Analyze Performance Of Google Adwords Strategic Campaign Inspiration PDF. This layout presents information on Spend, Conversions, Cost Benefit Analysis . It is also available for immediate download and adjustment. So, changes can be made in the color, design, graphics or any other component to create a unique layout.

Dashboard To Compare Google Adwords Strategic Campaign With Facebook Microsoft PDF
This slide showcases KPI dashboard to compare performance of google adwords campaign to identify the most efficient one. It includes KPIs such as cost, conversions, channel performance overview, clicks, impressions, etc. Showcasing this set of slides titled Dashboard To Compare Google Adwords Strategic Campaign With Facebook Microsoft PDF. The topics addressed in these templates are Cost, Conversions, Revenue. All the content presented in this PPT design is completely editable. Download it and make adjustments in color, background, font etc. as per your unique business setting.

Dashboard For Strategic Evaluation Of Key Business Financials Ppt Gallery Aids PDF
This slide displays dashboard to review business performance and formulate appropriate improvement strategies. It further includes kpis such as revenue comparison, top selling categories, sales by month, customer satisfaction, etc. Showcasing this set of slides titled Dashboard For Strategic Evaluation Of Key Business Financials Ppt Gallery Aids PDF. The topics addressed in these templates are Revenue Comparison, Top Selling Categories, New Customer. All the content presented in this PPT design is completely editable. Download it and make adjustments in color, background, font etc. as per your unique business setting.

Dashboard For Strategic Organization Evaluation Of Employee Performance Ppt Icon Mockup PDF
This slide displays dashboard to strategically review and analyze employee performance in the organization to determine overall efficiency of business operations. It includes KPIs such as absenteeism, overtime hours, training costs and overall labor efficiency. Pitch your topic with ease and precision using this Dashboard For Strategic Organization Evaluation Of Employee Performance Ppt Icon Mockup PDF. This layout presents information on Training Costs, Overall Labor Effectiveness, Absenteeism, Overtime Hours. It is also available for immediate download and adjustment. So, changes can be made in the color, design, graphics or any other component to create a unique layout.

KPI Dashboard Of Managing Innovative Business Project Ppt Pictures Show PDF
This slide shows the KPI dashboard of innovation project management. It covers the following KPIs such as innovation success rate, value in project, total revenue, active projects, etc. Pitch your topic with ease and precision using this KPI Dashboard Of Managing Innovative Business Project Ppt Pictures Show PDF. This layout presents information on Innovation Success Rate, Total Active Projects, Amount Mission. It is also available for immediate download and adjustment. So, changes can be made in the color, design, graphics or any other component to create a unique layout.
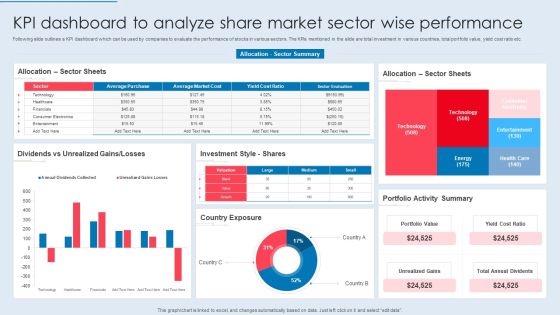
KPI Dashboard To Analyze Share Market Sector Wise Performance Summary PDF
Following slide outlines a KPI dashboard which can be used by companies to evaluate the performance of stocks in various sectors. The KPIs mentioned in the slide are total investment in various countries, total portfolio value, yield cost ratio etc. Pitch your topic with ease and precision using this KPI Dashboard To Analyze Share Market Sector Wise Performance Summary PDF. This layout presents information on Sector Sheets, Dividends Vs Unrealized, Investment Style. It is also available for immediate download and adjustment. So, changes can be made in the color, design, graphics or any other component to create a unique layout.

IT Security Risk Management Dashboard With Risk Rating And Breakdown Pictures PDF
This slide displays dashboard for real- time tracking and management of cybersecurity risk to help company formulate appropriate mitigation strategies. It includes kpis such as response plan progress, heat map, action plan, top 5 vulnerabilities, etc. Pitch your topic with ease and precision using this IT Security Risk Management Dashboard With Risk Rating And Breakdown Pictures PDF. This layout presents information on Risk Rating Breakdown, Action Plan Breakdown, Risk Probability Score, Risk Analysis Progress. It is also available for immediate download and adjustment. So, changes can be made in the color, design, graphics or any other component to create a unique layout.

Marketers Guide To Data Analysis Optimization Social Media Analytics KPI Dashboard Clipart PDF
This slide covers a dashboard for tracking social media KPIs such as face engagements, total likes, followers, audience growth, YouTube subscribers, views, Instagram reach and , likes, LinkedIn impressions, etc. Find a pre designed and impeccable Marketers Guide To Data Analysis Optimization Social Media Analytics KPI Dashboard Clipart PDF. The templates can ace your presentation without additional effort. You can download these easy to edit presentation templates to make your presentation stand out from others. So, what are you waiting for Download the template from Slidegeeks today and give a unique touch to your presentation.

Company Payout Dashboard For Internet Plan Overview Ppt Layouts Templates PDF
The slide covers the dashboard to track payments for the internet plan. Various KPIs included are invoice details, payment history, recent customers, invoice stats, recent invoices, etc. Showcasing this set of slides titled Company Payout Dashboard For Internet Plan Overview Ppt Layouts Templates PDF. The topics addressed in these templates are Payment Information, Invoice Details, Internet Plan, Next Payment. All the content presented in this PPT design is completely editable. Download it and make adjustments in color, background, font etc. as per your unique business setting.

ICT Service Management Dashboard To Track Customer Support Team Performance Summary PDF
This slide represents ICT Information and Communication Technology service management dashboard. It includes KPIs such as support requests, tickets raised etc. Want to ace your presentation in front of a live audience Our ICT Service Management Dashboard To Track Customer Support Team Performance Summary PDF can help you do that by engaging all the users towards you. Slidegeeks experts have put their efforts and expertise into creating these impeccable powerpoint presentations so that you can communicate your ideas clearly. Moreover, all the templates are customizable, and easy to edit and downloadable. Use these for both personal and commercial use.

Construction Industry KPI Dashboard After Successful Implementation Of Marketing Strategy Sample PDF
This template shows after marketing strategy has been successfully implemented, the construction industry KPI dashboard. The purpose of this slide is to evaluate the construction project. The KPIs such as project in progress, costing of projects, tenure of particular projects , etc. Showcasing this set of slides titled Construction Industry KPI Dashboard After Successful Implementation Of Marketing Strategy Sample PDF. The topics addressed in these templates are Projetcs, Progress Tracking, Costing. All the content presented in this PPT design is completely editable. Download it and make adjustments in color, background, font etc. as per your unique business setting.
Planning Transnational Technique To Improve International Scope Dashboard Tracking Post Expansion Revenue Structure PDF
This slide covers the dashboard for analyzing fast food business sales by location. It includes KPIs such as the companys revenue by location, by type, top 5 expenses by account, top 5 expenses by department, cost of revenue year to date, etc. If your project calls for a presentation, then Slidegeeks is your go to partner because we have professionally designed, easy to edit templates that are perfect for any presentation. After downloading, you can easily edit Planning Transnational Technique To Improve International Scope Dashboard Tracking Post Expansion Revenue Structure PDF and make the changes accordingly. You can rearrange slides or fill them with different images. Check out all the handy templates

Strategic Marketing For Hair And Beauty Salon To Increase Dashboard Monitoring Sales Slides PDF
This slide presents a dashboard tracking revenue and sales by products and services. It includes KPIs such as revenue by service and products, units sold, monthly revenue. Make sure to capture your audiences attention in your business displays with our gratis customizable Strategic Marketing For Hair And Beauty Salon To Increase Dashboard Monitoring Sales Slides PDF. These are great for business strategies, office conferences, capital raising or task suggestions. If you desire to acquire more customers for your tech business and ensure they stay satisfied, create your own sales presentation with these plain slides.

Sales Lead Qualification Procedure And Parameter Analyzing And Understanding Sample PDF
Purpose of the following slide is to show the key performance indicators of the current sales process, the provided displays KPIs such as customer acquired, CAC, volume per customer etc.Deliver and pitch your topic in the best possible manner with this Sales Lead Qualification Procedure And Parameter Analyzing And Understanding Sample PDF Use them to share invaluable insights on Performance By Region, Value Of Customer, Profit Generated and impress your audience. This template can be altered and modified as per your expectations. So, grab it now.
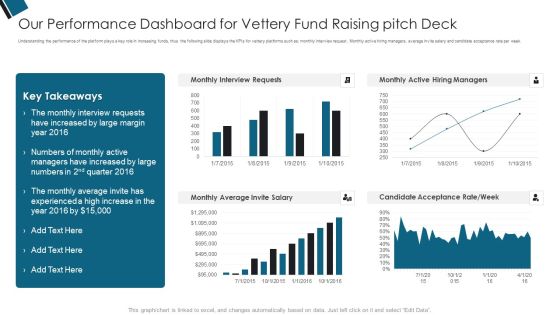
Our Performance Dashboard For Vettery Fund Raising Pitch Deck Ppt PowerPoint Presentation Professional Background PDF
Understanding the performance of the platform plays a key role in increasing funds, thus the following slide displays the KPIs for vettery platforms such as monthly interview request , Monthly active hiring managers, average invite salary and candidate acceptance rate per week. Deliver an awe inspiring pitch with this creative Our Performance Dashboard For Vettery Fund Raising Pitch Deck Ppt PowerPoint Presentation Professional Background PDF bundle. Topics like Monthly Interview, Managers Increased, Experienced A High can be discussed with this completely editable template. It is available for immediate download depending on the needs and requirements of the user.

KPI Dashboard Of Workforce Performance In Organization Ppt Gallery Portfolio PDF
This slide shows the performance of employees in an organization. It includes KPIs such as headcount, average employee age, gender diversity ratio, absenteeism, etc. Showcasing this set of slides titled KPI Dashboard Of Workforce Performance In Organization Ppt Gallery Portfolio PDF. The topics addressed in these templates are Employee Count Status, Employee Count Department, Average Employee Age. All the content presented in this PPT design is completely editable. Download it and make adjustments in color, background, font etc. as per your unique business setting.
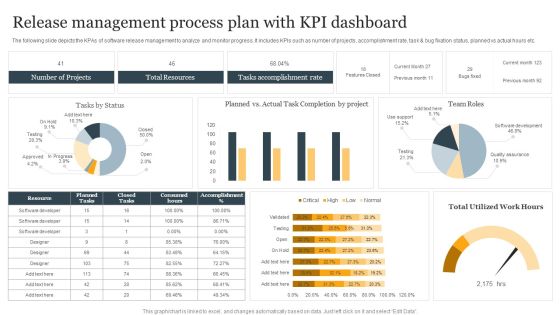
Release Management Process Plan With KPI Dashboard Ppt Infographic Template Structure PDF
The following slide depicts the KPAs of software release management to analyze and monitor progress. It includes KPIs such as number of projects, accomplishment rate, task and bug fixation status, planned vs actual hours etc. Showcasing this set of slides titled Release Management Process Plan With KPI Dashboard Ppt Infographic Template Structure PDF. The topics addressed in these templates are Number Of Projects, Total Resources, Tasks Accomplishment Rate. All the content presented in this PPT design is completely editable. Download it and make adjustments in color, background, font etc. as per your unique business setting.
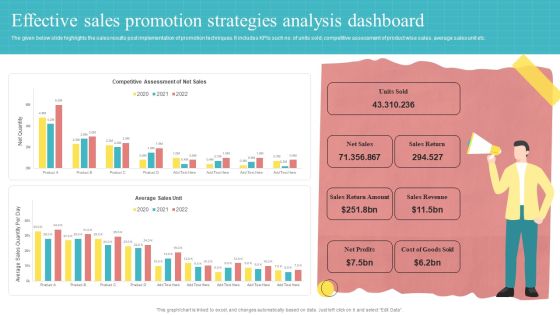
Effective Sales Promotion Strategies Analysis Dashboard Ppt PowerPoint Presentation Slides Background Designs PDF
The given below slide highlights the sales results post implementation of promotion techniques. It includes KPIs such no. of units sold, competitive assessment of product wise sales, average sales unit etc.Showcasing this set of slides titled Effective Sales Promotion Strategies Analysis Dashboard Ppt PowerPoint Presentation Slides Background Designs PDF. The topics addressed in these templates are Return Amount, Sales Return, Sales Revenue. All the content presented in this PPT design is completely editable. Download it and make adjustments in color, background, font etc. as per your unique business setting.

Strategic Market Summary Assessment Dashboard To Build Entry Planning Ppt Layouts Background Image PDF
The following slide highlights the KPIs of existing market to analyze and form entry plan for new market segment. It includes KPAs such as overview, competition, market share and size etc. Persuade your audience using this Strategic Market Summary Assessment Dashboard To Build Entry Planning Ppt Layouts Background Image PDF. This PPT design covers one stages, thus making it a great tool to use. It also caters to a variety of topics including Market Overview, Website Traffic, Projected Budget. Download this PPT design now to present a convincing pitch that not only emphasizes the topic but also showcases your presentation skills.

Adjusting Financial Strategies And Planning KPI Dashboard To Analyze Financial Improvements Inspiration PDF
This slide showcases the KPIs that would help our business organization to evaluate improvements with the new financial strategy implementation. It includes total income, total expenses, accounts receivable, etc. The best PPT templates are a great way to save time, energy, and resources. Slidegeeks have 100 percent editable powerpoint slides making them incredibly versatile. With these quality presentation templates, you can create a captivating and memorable presentation by combining visually appealing slides and effectively communicating your message. Download Adjusting Financial Strategies And Planning KPI Dashboard To Analyze Financial Improvements Inspiration PDF from Slidegeeks and deliver a wonderful presentation.
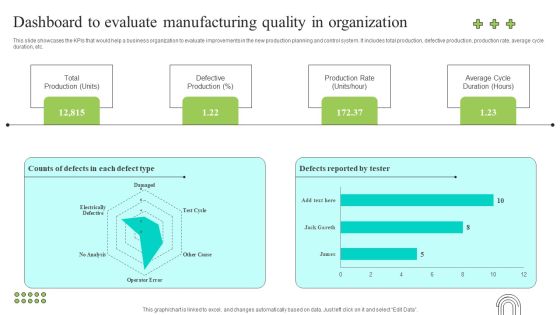
Effective Production Planning And Monitoring Techniques Dashboard To Evaluate Manufacturing Quality Brochure PDF
This slide showcases the KPIs that would help a business organization to evaluate improvements in the new production planning and control system. It includes total production, defective production, production rate, average cycle duration, etc. Make sure to capture your audiences attention in your business displays with our gratis customizable Effective Production Planning And Monitoring Techniques Dashboard To Evaluate Manufacturing Quality Brochure PDF. These are great for business strategies, office conferences, capital raising or task suggestions. If you desire to acquire more customers for your tech business and ensure they stay satisfied, create your own sales presentation with these plain slides.

RPA In Telecommunications To Improve Customer Experience Guidelines PDF
Following slide provides insights into implementation of RPA in telecommunication industry contact centres for building customer base. It includes key components such as criteria, goals, KPIs Key Performance Indicators, strategies, and outcomes. Pitch your topic with ease and precision using this RPA In Telecommunications To Improve Customer Experience Guidelines PDF. This layout presents information on Intelligent Voice Bots, Deploy Chatbots, Implement Intelligent Routing. It is also available for immediate download and adjustment. So, changes can be made in the color, design, graphics or any other component to create a unique layout.
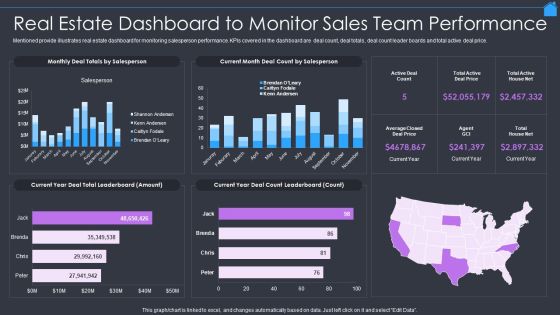
Marketing Strategy To Enhance Real Estate Sales Real Estate Dashboard To Monitor Sales Team Performance Infographics PDF
Mentioned provide illustrates real estate dashboard for monitoring salesperson performance. KPIs covered in the dashboard are deal count, deal totals, deal count leader boards and total active deal price. Deliver an awe inspiring pitch with this creative Marketing Strategy To Enhance Real Estate Sales Real Estate Dashboard To Monitor Sales Team Performance Infographics PDF bundle. Topics like Real Estate Dashboard, Monitor Sales Team Performance can be discussed with this completely editable template. It is available for immediate download depending on the needs and requirements of the user.
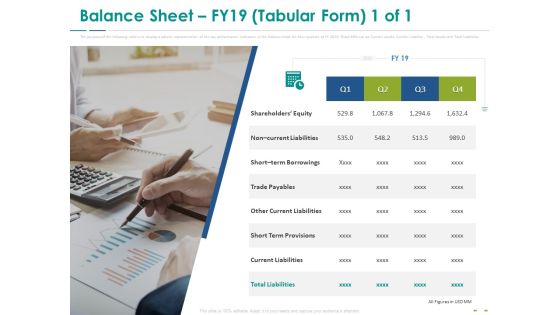
Stock Market Research Report Balance Sheet FY19 Tabular Form Equity Information PDF
The purpose of the following slide is to display the key performance indicators of the balance sheet for four quarters of FY 2019. These KPIs can be Current assets, Current Liability , Total Assets and Total Liabilities. Presenting stock market research report balance sheet fy19 tabular form equity information pdf to provide visual cues and insights. Share and navigate important information on one stages that need your due attention. This template can be used to pitch topics like non current liabilities, short term borrowings, trade payables, other current liabilities, short term provisions. In addition, this PPT design contains high-resolution images, graphics, etc, that are easily editable and available for immediate download.

Procedure Advancements Banking Department Financial Forecast After Process Improvement Template PDF
The slide provides the financial forecast of the company after the process improvement. Major KPIs key performance indicators covered in the slide are total revenue, interest income, number of customers, customer churn rate, online banking users, customer satisfaction rate etc. Deliver and pitch your topic in the best possible manner with this procedure advancements banking department financial forecast after process improvement template pdf. Use them to share invaluable insights on total revenue, interest income, customer satisfaction rate, customer churn rate, online banking users and impress your audience. This template can be altered and modified as per your expectations. So, grab it now.

Cost Estimate For Execution Of The Strategies Portrait PDF
The slide shows the key Performance Indicator KPI s which will help the company to track the success rate of implemented strategies. Major KPIs include Number of construction projects, Number of construction defect, Total project cost, customer satisfaction level etc.Deliver and pitch your topic in the best possible manner with this cost estimate for execution of the strategies portrait pdf. Use them to share invaluable insights on quality assurance strategy, evaluations of the site strategy, establish quality and impress your audience. This template can be altered and modified as per your expectations. So, grab it now.
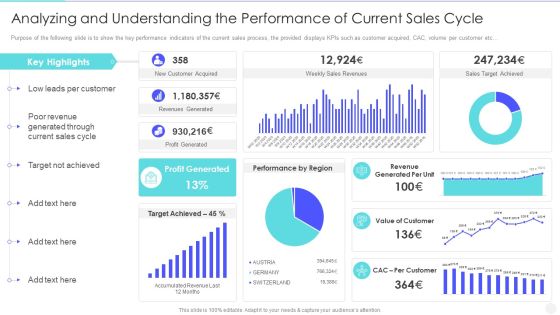
Increase Returns By Examining And Executing New Sales Qualification Procedure Analyzing And Understanding Clipart PDF
Purpose of the following slide is to show the key performance indicators of the current sales process, the provided displays KPIs such as customer acquired, CAC, volume per customer etc. Deliver an awe inspiring pitch with this creative increase returns by examining and executing new sales qualification procedure analyzing and understanding clipart pdf bundle. Topics like sales, target, revenue, profit generated, value can be discussed with this completely editable template. It is available for immediate download depending on the needs and requirements of the user.

Comparison Between Agile And Scrum IT Scrum Vs Kanban Comparison Between Agile Approaches Slides PDF
Mentioned slide shows a comparison between agile approaches namely scrum and Kanban based on parameters namely meetings, work-in-progress, KPIs and roles. This is a comparison between agile and scrum it scrum vs kanban comparison between agile approaches slides pdf template with various stages. Focus and dispense information on two stages using this creative set, that comes with editable features. It contains large content boxes to add your information on topics like scrum, kanban, meetings work progress, key performance indicators, roles. You can also showcase facts, figures, and other relevant content using this PPT layout. Grab it now.

Debt Retrieval Techniques Understanding Our Cash Flow Statements Kpi Fy 21 22 Ppt Inspiration Deck PDF
Purpose of the following slide is to show the major key performing indicators of the organization , these KPIs can be the operation activities, cash flow from financing activities, investing activities and the net decrease in cash flow Deliver an awe inspiring pitch with this creative debt retrieval techniques understanding our cash flow statements kpi fy 21 22 ppt inspiration deck pdf bundle. Topics like operations, investing activities, net decease in cash, financial activities can be discussed with this completely editable template. It is available for immediate download depending on the needs and requirements of the user.
Multistep Process To Create KPI Framework Ppt PowerPoint Presentation Icon Styles PDF
This slide illustrates process to create key performance indicator framework which includes steps such as awareness, engagement, conversion and loyalty. It also includes the different types of kpis for each stage. Persuade your audience using this multistep process to create kpi framework ppt powerpoint presentation icon styles pdf This PPT design covers four stages, thus making it a great tool to use. It also caters to a variety of topics including awareness, conversion, engagement Download this PPT design now to present a convincing pitch that not only emphasizes the topic but also showcases your presentation skills.

 Home
Home