Kpi

Comprehensive Guide To Build Marketing Success Metrics To Measure Influencer Marketing Sample PDF
The following slide showcases different key performance indicators KPIs through which digital marketers can evaluate influencer marketing campaign performance. The key performance indicators outlined in slide are audience reach, impressions, followers growth, click-through rate CTR, revenue, and conversion rate. This modern and well-arranged Comprehensive Guide To Build Marketing Success Metrics To Measure Influencer Marketing Sample PDF provides lots of creative possibilities. It is very simple to customize and edit with the Powerpoint Software. Just drag and drop your pictures into the shapes. All facets of this template can be edited with Powerpoint, no extra software is necessary. Add your own material, put your images in the places assigned for them, adjust the colors, and then you can show your slides to the world, with an animated slide included.

Key Performance Management Of Digital Marketing Pyramid Designs PDF
This slide represents the pyramid showing the kpis of digital marketing team. It includes loyalty, sales, online advertising and traffic key performance indicators for the digital marketing team. Presenting Key Performance Management Of Digital Marketing Pyramid Designs PDF to dispense important information. This template comprises three stages. It also presents valuable insights into the topics including Key Performance Management, Digital Marketing Pyramid. This is a completely customizable PowerPoint theme that can be put to use immediately. So, download it and address the topic impactfully.

Safety Team Performance Management Dashboard With Key Kpis Rules PDF
This slide shows a dashboard representing performance measurement of the safety team of the organization on the basis of key performance indicators. It includes details related to safety team performance ranking, average result area scores etc. Pitch your topic with ease and precision using this Safety Team Performance Management Dashboard With Key Kpis Rules PDF. This layout presents information on Improve Corrective Actions, Safety Manager Objective, Conduct Risk Assessment. It is also available for immediate download and adjustment. So, changes can be made in the color, design, graphics or any other component to create a unique layout.
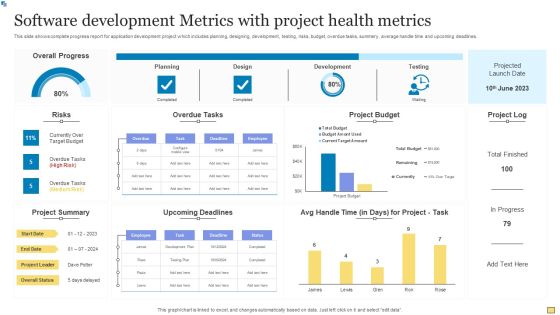
Software Development Metrics With Project Health Metrics Graphics PDF
This slide shows complete progress report for application development project which includes planning, designing, development, testing, risks, budget, overdue tasks, summery, average handle time and upcoming deadlines. Pitch your topic with ease and precision using this Software Development Metrics With Project Health Metrics Graphics PDF. This layout presents information on Overall Progress, Overdue Tasks, Project Budget. It is also available for immediate download and adjustment. So, changes can be made in the color, design, graphics or any other component to create a unique layout.
Executive Dashboards For Tracking Key Performance Icons PDF
This slide represents the dashboard for the CEO to track the companys performance. It includes key performance indicators such as no. of deals, open deals, revenue, expected revenue and win percentage. Showcasing this set of slides titled Executive Dashboards For Tracking Key Performance Icons PDF. The topics addressed in these templates are Pen Deals, Revenue, Expected Revenue. All the content presented in this PPT design is completely editable. Download it and make adjustments in color, background, font etc. as per your unique business setting.

Kaizen Process Report With Improvement Metrics Ppt PowerPoint Presentation File Icons PDF
This slide focuses on the kaizen event report which covers process owner, key performance indicators, summary, problem description, improvement metrics, goals, daily milestones, team members and other considerations, etc. Pitch your topic with ease and precision using this Kaizen Process Report With Improvement Metrics Ppt PowerPoint Presentation File Icons PDF. This layout presents information on Key Performance Indoctrinator, Improvement Goal, Improvement Metric. It is also available for immediate download and adjustment. So, changes can be made in the color, design, graphics or any other component to create a unique layout.

Balanced Scorecard Metrics Powerpoint Shapes
This is a balanced scorecard metrics powerpoint shapes. This is a four stage process. The stages in this process are finance, client, processes, people.

Monitor Effectiveness Metrics Powerpoint Guide
This is a monitor effectiveness metrics powerpoint guide. This is a six stage process. The stages in this process are design policies and enforcement mechanisms, deploy governance infrastructure, identify owners and funding model, monitor effectiveness metrics, deploy governance mechanisms, design governance infrastructure.

Customer Understanding Metrics Powerpoint Slide
This is a customer understanding metrics powerpoint slide. This is a three stage process. The stages in this process are inactive nonprofit able customer, active profitable customers, very active very profitable customers.

Key Metrics Presentation Powerpoint Example
This is a key metrics presentation powerpoint example. This is a two stage process. The stages in this process are residential customer churn, broadband availability.
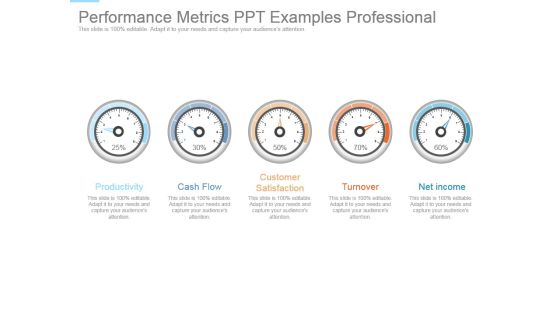
Performance Metrics Ppt Examples Professional
This is a performance metrics ppt examples professional. This is a five stage process. The stages in this process are productivity, cash flow, customer satisfaction, turnover, net income.

Business Goals Employee Performance Measurement Strategy Matrix Summary PDF
This slide exhibits measurement strategy matrix to assure achievement of business goals and objectives. It includes various elements such as objectives, goals, KPIs, metrics and analysis segments. Presenting Business Goals Employee Performance Measurement Strategy Matrix Summary PDF to dispense important information. This template comprises five stages. It also presents valuable insights into the topics including Key Performance Indicators, Aim And Goals, Business Objective. This is a completely customizable PowerPoint theme that can be put to use immediately. So, download it and address the topic impactfully.
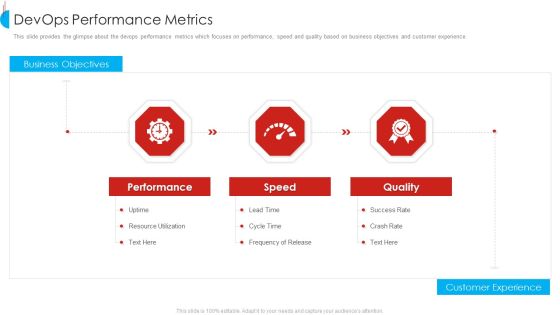
Devops Performance Metrics Themes PDF
This slide provides the glimpse about the devops performance metrics which focuses on performance, speed and quality based on business objectives and customer experience.This is a devops performance metrics themes pdf template with various stages. Focus and dispense information on three stages using this creative set, that comes with editable features. It contains large content boxes to add your information on topics like resource utilization, frequency of release, success rate . You can also showcase facts, figures, and other relevant content using this PPT layout. Grab it now.

Organization Compliance Metrics Pictures PDF
This slide covers the metrics that measure what you are doing with the awareness project, exactly how you will train and how. Such metrics are of particular importance for purposes of compliance and monitoring.Presenting organization compliance metrics pictures pdf. to provide visual cues and insights. Share and navigate important information on one stage that need your due attention. This template can be used to pitch topics like training completion, communication methods. In addtion, this PPT design contains high resolution images, graphics, etc, that are easily editable and available for immediate download.
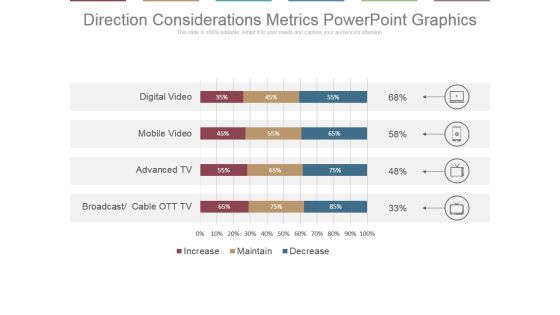
Direction Considerations Metrics Powerpoint Graphics
This is a direction considerations metrics powerpoint graphics. This is a four stage process. The stages in this process are digital video, mobile video, advanced tv, broadcast, cable ott tv.

Corporate Risk Metrics Dashboard And Control Dashboard With Expenditure Inspiration PDF
This slide illustrates corporate risk key performance indicators. It includes graphs of inherent risks, overdue risks, risk control data. Showcasing this set of slides titled Corporate Risk Metrics Dashboard And Control Dashboard With Expenditure Inspiration PDF. The topics addressed in these templates are Expenditure, Risk Management, Organization Risk. All the content presented in this PPT design is completely editable. Download it and make adjustments in color, background, font etc. as per your unique business setting.

Internal Promotion Strategy To Enhance Brand Awareness Internal Marketing Metrics To Track Annual Brochure PDF
This slide shows various key performance indicators to evaluate yearly performance of internal marketing. It includes comparison of actual and expected performance. If your project calls for a presentation, then Slidegeeks is your go to partner because we have professionally designed, easy to edit templates that are perfect for any presentation. After downloading, you can easily edit Internal Promotion Strategy To Enhance Brand Awareness Internal Marketing Metrics To Track Annual Brochure PDF and make the changes accordingly. You can rearrange slides or fill them with different images. Check out all the handy templates

Internal Audit Metrics Dashboard And Status Ppt Layouts Graphic Images PDF
This slide covers the key performance indicator dashboard and status for internal audit. It includes information related to the audit status and risk rating. Pitch your topic with ease and precision using this Internal Audit Metrics Dashboard And Status Ppt Layouts Graphic Images PDF. This layout presents information on Audit Status, Risk Rating, Auditable Entry. It is also available for immediate download and adjustment. So, changes can be made in the color, design, graphics or any other component to create a unique layout.
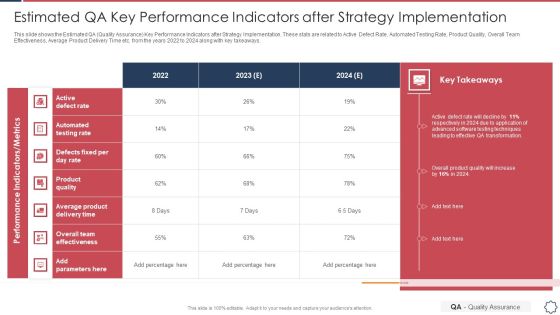
Quality Assurance Transformation Strategies To Improve Business Performance Efficiency Estimated QA Key Performance Topics PDF
This slide shows the Estimated QA Quality Assurance Key Performance Indicators after Strategy Implementation. These stats are related to Active Defect Rate, Automated Testing Rate, Product Quality, Overall Team Effectiveness, Average Product Delivery Time etc. from the years 2022 to 2024 along with key takeaways. Deliver and pitch your topic in the best possible manner with this quality assurance transformation strategies to improve business performance efficiency estimated qa key performance topics pdf. Use them to share invaluable insights on automated testing rate, average product delivery time, active defect rate and impress your audience. This template can be altered and modified as per your expectations. So, grab it now.

HR Scoreboard Manager Performance Inspiration PDF
The purpose of this slide is to showcase certain key performance indicators of human resource managers in order to measure their performance based on specific criteria. It includes key areas, metrics, targets, achieved, and performance rating. Showcasing this set of slides titled HR Scoreboard Manager Performance Inspiration PDF. The topics addressed in these templates are Target, Achieved, Performance Rating. All the content presented in this PPT design is completely editable. Download it and make adjustments in color, background, font etc. as per your unique business setting.

Key Tools To Enhance Owned Media Effectiveness Summary PDF
Following slide brings forth the major key performing indicators that can be used by digital marketers to measure the effectiveness of earned media strategies. Key elements consists of dimension, description, tools and key performing indicators metrics Showcasing this set of slides titled Key Tools To Enhance Owned Media Effectiveness Summary PDF. The topics addressed in these templates are Dimension, Description, Tools . All the content presented in this PPT design is completely editable. Download it and make adjustments in color, background, font etc. as per your unique business setting.
KPIs And Metrics To Measure Pharmaceutical Drug Of Pharmaceutical Company Icons PDF
Mentioned slide showcases various key performance indicators KPIs which can be used to measure the development of pharmaceutical companies in different years. The key metrics are productivity, competency, quality of care and financial. Showcasing this set of slides titled KPIs And Metrics To Measure Pharmaceutical Drug Of Pharmaceutical Company Icons PDF. The topics addressed in these templates are Productivity, Competency, Quality Of Care. All the content presented in this PPT design is completely editable. Download it and make adjustments in color, background, font etc. as per your unique business setting.
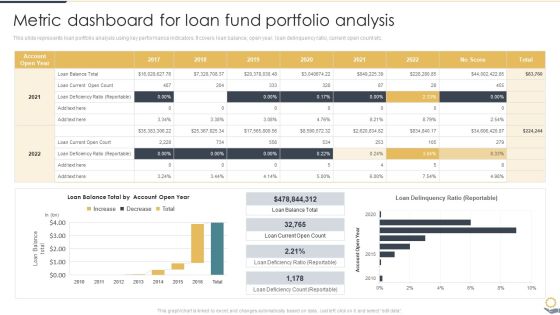
Metric Dashboard For Loan Fund Portfolio Analysis Portfolio Investment Analysis Formats PDF
This slide represents loan portfolio analysis using key performance indicators. It covers loan balance, open year, loan delinquency ratio, current open count etc.From laying roadmaps to briefing everything in detail, our templates are perfect for you. You can set the stage with your presentation slides. All you have to do is download these easy-to-edit and customizable templates. Metric Dashboard For Loan Fund Portfolio Analysis Portfolio Investment Analysis Formats PDF will help you deliver an outstanding performance that everyone would remember and praise you for. Do download this presentation today.

Comparison Metrics Of Digital And Offline Marketing Ppt Icon Format PDF
This slide showcases essential key performance indicators of online and offline marketing. Key metrics covered are spend, lead generated, revenue and customer retention. Persuade your audience using this Comparison Metrics Of Digital And Offline Marketing Ppt Icon Format PDF. This PPT design covers four stages, thus making it a great tool to use. It also caters to a variety of topics including Lead Generated, Revenue, Customer Retention, Spend. Download this PPT design now to present a convincing pitch that not only emphasizes the topic but also showcases your presentation skills.

Types Of Corporate Communication Techniques Evaluation For Stakeholders Communication Success Indicators Icons PDF
This template covers the stakeholders engagement success measurement key performance indicators including stakeholders type , evaluation areas, methods, sources of information and long term or short term success. Deliver and pitch your topic in the best possible manner with this Types Of Corporate Communication Techniques Evaluation For Stakeholders Communication Success Indicators Icons PDF. Use them to share invaluable insights on Evaluation Area, Method, Sources and impress your audience. This template can be altered and modified as per your expectations. So, grab it now.
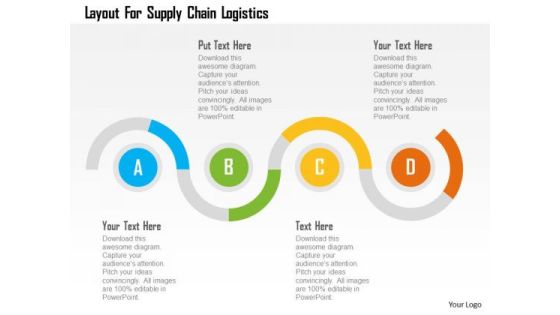
Business Diagram Layout For Supply Chain Logistics Presentation Template
This slide illustrates diagram of zigzag graphics. You may use it to represent concept of supply chain logistics. This diagram is suitable to display business information and also helps to keep your audience interested till the end of your presentation.
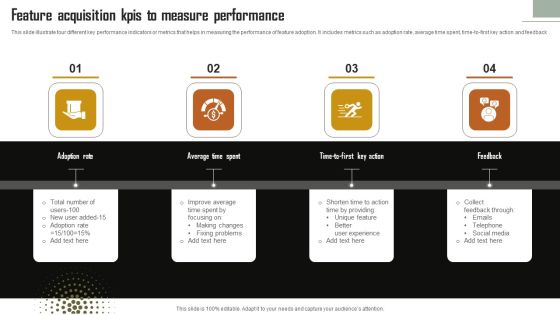
Feature Acquisition Kpis To Measure Performance Themes PDF
This slide illustrate four different key performance indicators or metrics that helps in measuring the performance of feature adoption. It includes metrics such as adoption rate, average time spent, time-to-first key action and feedback. Persuade your audience using this Feature Acquisition Kpis To Measure Performance Themes PDF. This PPT design covers four stages, thus making it a great tool to use. It also caters to a variety of topics including Adoption Rate, Average Time Spent, Feedback. Download this PPT design now to present a convincing pitch that not only emphasizes the topic but also showcases your presentation skills.

Funnel With Cubes For Sales Process Powerpoint Template
This PowerPoint template contains funnel diagram with cubes. This diagram may be used to display strategy for sales process. Earn appreciation with our slide. Your listeners will surely laud your performance.

Circular Diagram Of Agile Software Development Powerpoint Templates
This PowerPoint template has been designed with circular diagram This diagram is a data visualization tool that gives you a simple way to present statistical information. This slide helps your audience examine and interpret the data you present.

Company Financial Forecast And Essential Metrics Ppt Model Design Templates PDF
This slide shows the projections of the financials of a company with the key performance indicators to know exactly where the business stands and what needs to be enhanced or reduced to make the business profitable. Showcasing this set of slides titled Company Financial Forecast And Essential Metrics Ppt Model Design Templates PDF. The topics addressed in these templates are Budget, Income, Expense, 2018 To 2022. All the content presented in this PPT design is completely editable. Download it and make adjustments in color, background, font etc. as per your unique business setting.
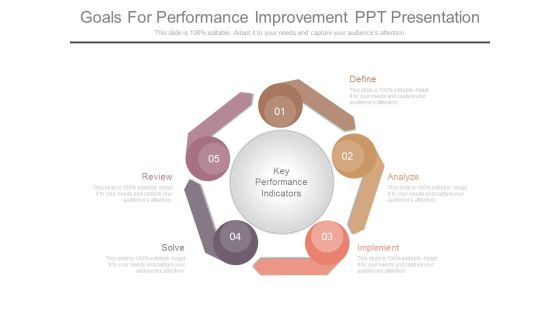
Goals For Performance Improvement Ppt Presentation
This is a goals for performance improvement ppt presentation. This is a five stage process. The stages in this process are key performance indicators, define, analyze, implement, solve, review.
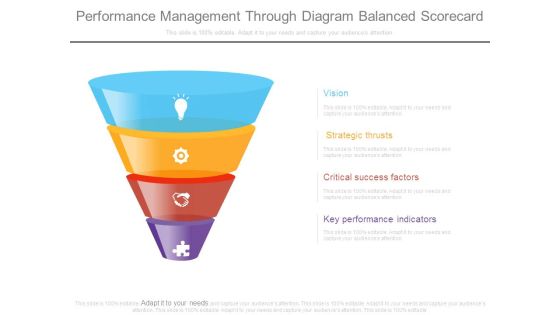
Performance Management Through Diagram Balanced Scorecard
This is a performance management through diagram balanced scorecard. This is a four stage process. The stages in this process are vision, strategic thrusts, critical success factors, key performance indicators.

Marketing Technology Stack Performance Measurement Dashboard Demonstration PDF
The purpose of the following slide is to display various metrices and key performing indicators to measure the future performance of the marketing technology stack. Deliver and pitch your topic in the best possible manner with this marketing technology stack performance measurement dashboard demonstration pdf. Use them to share invaluable insights on average response time, user satisfaction score, error rate and impress your audience. This template can be altered and modified as per your expectations. So, grab it now.
Education Metrics Dashboard For Tracking Student Ethnicity And Specially Abled Characteristics Brochure PDF
This slide covers the education key performance indicator tracker. It include metrics such as total applications, conversion rate, offers year to date, applications by ethnicity and disabilities, etc. Showcasing this set of slides titled Education Metrics Dashboard For Tracking Student Ethnicity And Specially Abled Characteristics Brochure PDF. The topics addressed in these templates are Total Applications, Conversion Rate 2022, Ethnicity. All the content presented in this PPT design is completely editable. Download it and make adjustments in color, background, font etc. as per your unique business setting.

Metrics To Track Effectiveness Of Integrated Digital Marketing Strategy Inspiration PDF
This slide demonstrates various key performing indicators utilized by organisations to track their marketing campaign progress and raise brand awareness. This slide includes elements such as KPIs, description, measures and approaches for further improvement. Showcasing this set of slides titled Metrics To Track Effectiveness Of Integrated Digital Marketing Strategy Inspiration PDF. The topics addressed in these templates are Metrics, Description, Measures. All the content presented in this PPT design is completely editable. Download it and make adjustments in color, background, font etc. as per your unique business setting.

Post Event Activities Metrics To Track Success Post Event Mockup PDF
This slide showcases performance indicators measured after event. Key metrics covered are number of registrations, revenue, ROI, email open rate, CSAT and social media mentions. Slidegeeks is one of the best resources for PowerPoint templates. You can download easily and regulate Post Event Activities Metrics To Track Success Post Event Mockup PDF for your personal presentations from our wonderful collection. A few clicks is all it takes to discover and get the most relevant and appropriate templates. Use our Templates to add a unique zing and appeal to your presentation and meetings. All the slides are easy to edit and you can use them even for advertisement purposes.

Current Vendor Management System Efficiency Indicators In The Company Microsoft PDF
This slide shows the current Vendor Management System Efficiency Indicators of the company that are compared for 3 years. Some indicators are Timely Order Fulfilment, Communication Time Lags, Delivery Lead Time, Vendor Availability, Supplier Risk etc. Deliver an awe-inspiring pitch with this creative current vendor management system efficiency indicators in the company microsoft pdf bundle. Topics like performance indicators, key takeaways can be discussed with this completely editable template. It is available for immediate download depending on the needs and requirements of the user.
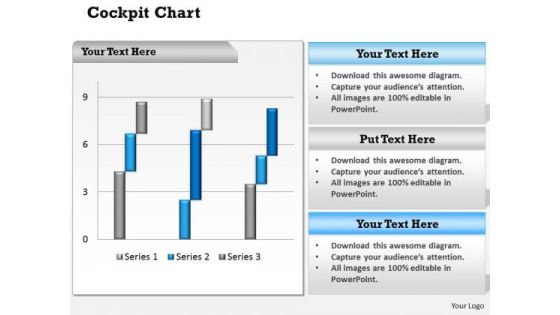
Business Cycle Diagram Dashboard Design Business Metrics Marketing Diagram
Analyze Ailments On Our Business Cycle Diagram Dashboard Design Business Metrics Marketing Diagram Powerpoint Templates. Bring Out The Thinking Doctor In You. Dock Your Thoughts With Our Business Cycle Diagram Dashboard Design Business Metrics Marketing Diagram Powerpoint Templates. They Will Launch Them Into Orbit.
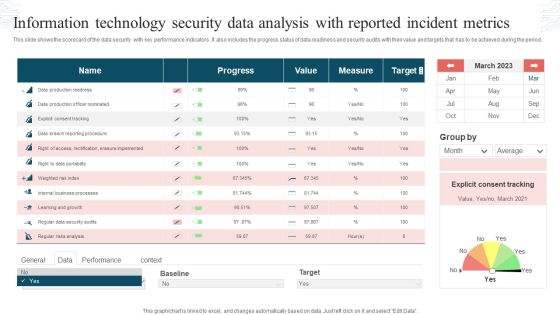
Information Technology Security Data Analysis With Reported Incident Metrics Rules PDF
This slide shows the scorecard of the data security with key performance indicators. It also includes the progress status of data readiness and security audits with their value and targets that has to be achieved during the period. Pitch your topic with ease and precision using this Information Technology Security Data Analysis With Reported Incident Metrics Rules PDF. This layout presents information on Progress, Value, Measure, Target. It is also available for immediate download and adjustment. So, changes can be made in the color, design, graphics or any other component to create a unique layout.

Metrics To Measure Business Performance Effective Rate Metrics By Customer And Offering Diagrams PDF
This slide covers effective rate metrics. It shows over year over comparison of effective rate per customer as well as effective rate per offering. Deliver and pitch your topic in the best possible manner with this Metrics To Measure Business Performance Effective Rate Metrics By Customer And Offering Diagrams PDF. Use them to share invaluable insights on Effective Rate, Per Customer, Per Offering and impress your audience. This template can be altered and modified as per your expectations. So, grab it now.
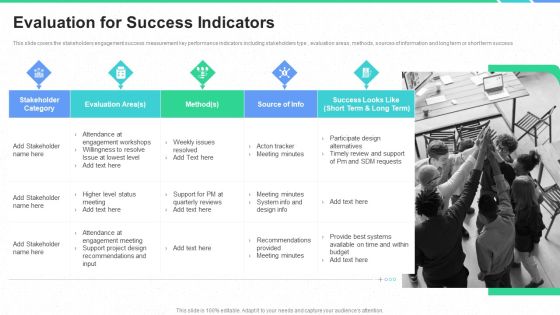
Stakeholders Participation Project Development Process Evaluation For Success Indicators Diagrams PDF
This slide covers the stakeholders engagement success measurement key performance indicators including stakeholders type , evaluation areas, methods, sources of information and long term or short term success. This is a stakeholders participation project development process evaluation for success indicators diagrams pdf template with various stages. Focus and dispense information on one stage using this creative set, that comes with editable features. It contains large content boxes to add your information on topics like stakeholder category, provide best systems available on time and within budget, support project design recommendations and input, meeting minutes. You can also showcase facts, figures, and other relevant content using this PPT layout. Grab it now.
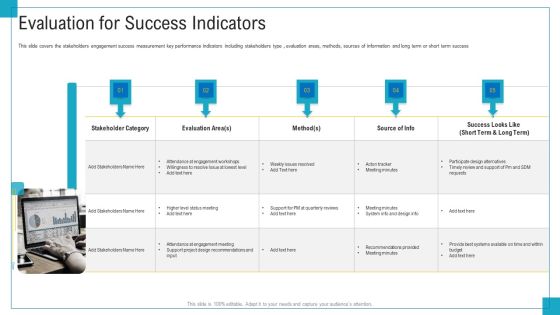
Program And PME Evaluation For Success Indicators Ppt Infographics Slide Download PDF
This slide covers the stakeholders engagement success measurement key performance indicators including stakeholders type , evaluation areas, methods, sources of information and long term or short term success. This is a program and PME evaluation for success indicators ppt infographics slide download pdf template with various stages. Focus and dispense information on five stages using this creative set, that comes with editable features. It contains large content boxes to add your information on topics like stakeholder category, provide best systems available on time and within budget, attendance at engagement workshops. You can also showcase facts, figures, and other relevant content using this PPT layout. Grab it now.
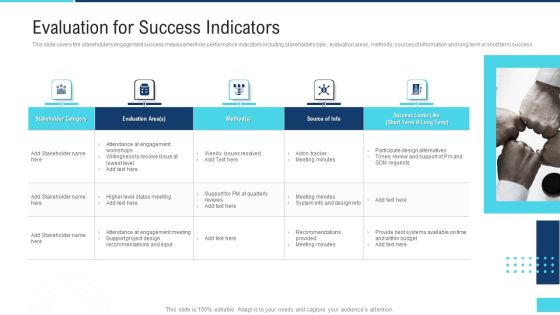
Profitable Initiation Project Engagement Process Evaluation For Success Indicators Ppt Outline Background Image PDF
This slide covers the stakeholders engagement success measurement key performance indicators including stakeholders type , evaluation areas, methods, sources of information and long term or short term success Deliver and pitch your topic in the best possible manner with this profitable initiation project engagement process evaluation for success indicators ppt outline background image pdf. Use them to share invaluable insights on stakeholder, evaluation, project design and impress your audience. This template can be altered and modified as per your expectations. So, grab it now.

Recruitment Metrics For Data Driven Selection Process Ppt PowerPoint Presentation Inspiration Graphics Download PDF
This slide highlights the key performance indicators to analyze hiring process in organization which includes time to fill, first year attrition rate, cost per hire, candidate job satisfaction and interview to hire ratio. Persuade your audience using this Recruitment Metrics For Data-Driven Selection Process Ppt PowerPoint Presentation Inspiration Graphics Download PDF. This PPT design covers one stage, thus making it a great tool to use. It also caters to a variety of topics including Candidate Job, Satisfaction, Attrition Rate. Download this PPT design now to present a convincing pitch that not only emphasizes the topic but also showcases your presentation skills.

Effective Public Relations Plan With Key Performance Keywords Ppt PowerPoint Presentation Professional Layouts
Presenting this set of slides with name effective public relations plan with key performance keywords ppt powerpoint presentation professional layouts. This is a six stage process. The stages in this process are objectives, key performance indicators, message, audiences, plan and implement, measure. This is a completely editable PowerPoint presentation and is available for immediate download. Download now and impress your audience.
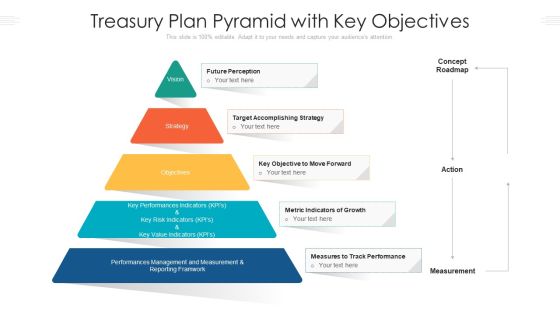
Treasury Plan Pyramid With Key Objectives Ppt PowerPoint Presentation Gallery Example Topics PDF
Presenting treasury plan pyramid with key objectives ppt powerpoint presentation gallery example topics pdf to dispense important information. This template comprises five stages. It also presents valuable insights into the topics including future perception, accomplishing strategy, metric indicators of growth, track performance. This is a completely customizable PowerPoint theme that can be put to use immediately. So, download it and address the topic impactfully.

Comprehensive Guide To Build Marketing Success Metrics To Measure Offline Marketing Sample PDF
The following slide showcases various key performance indicators KPIs through which marketers can evaluate the success of traditional marketing performance. The metrics mentioned in slide are customer acquisition cost CAC, cross-sells, referrals, sales per square foot, repeat purchase rate, foot traffic, average order value, etc. This Comprehensive Guide To Build Marketing Success Metrics To Measure Offline Marketing Sample PDF is perfect for any presentation, be it in front of clients or colleagues. It is a versatile and stylish solution for organizing your meetings. The Comprehensive Guide To Build Marketing Success Metrics To Measure Offline Marketing Sample PDF features a modern design for your presentation meetings. The adjustable and customizable slides provide unlimited possibilities for acing up your presentation. Slidegeeks has done all the homework before launching the product for you. So, do not wait, grab the presentation templates today.

Comprehensive Guide To Build Marketing Success Metrics To Measure Seo Marketing Graphics PDF
The following slide showcases different key performance indicators KPIs that can assist marketing teams to evaluate search engine optimization SEO marketing campaign performance. The metrics outlined in slide are organic sessions, backlinks, average session duration, cost per click CPC, conversion rate, etc. Welcome to our selection of the Comprehensive Guide To Build Marketing Success Metrics To Measure Seo Marketing Graphics PDF. These are designed to help you showcase your creativity and bring your sphere to life. Planning and Innovation are essential for any business that is just starting out. This collection contains the designs that you need for your everyday presentations. All of our PowerPoints are 100 percent editable, so you can customize them to suit your needs. This multi-purpose template can be used in various situations. Grab these presentation templates today.

Dashboard For Tracking Mobile Commercial Banking Marketing Campaign Performance Slides PDF
This slide depicts a dashboard for tracking performance of marketing campaigns of mobile banking across paid media channels. The key performing indicators are client acquisition metrics, client conversion metrics, expense metrics among many others. Showcasing this set of slides titled Dashboard For Tracking Mobile Commercial Banking Marketing Campaign Performance Slides PDF. The topics addressed in these templates are Dashboard For Tracking Mobile, Commercial Banking, Marketing Campaign Performance. All the content presented in this PPT design is completely editable. Download it and make adjustments in color, background, font etc. as per your unique business setting.

Comprehensive Guide To Build Marketing Success Metrics To Measure Social Media Slides PDF
The following slide showcases different key performance indicators KPIs through which startups can evaluate success of social media marketing SMM strategies. The key metrics outlined in slide are brand impressions, reach, customer conversion rate, unique link clicks, revenue, watch time, subscribes, etc. Explore a selection of the finest Comprehensive Guide To Build Marketing Success Metrics To Measure Social Media Slides PDF here. With a plethora of professionally designed and pre-made slide templates, you can quickly and easily find the right one for your upcoming presentation. You can use our Comprehensive Guide To Build Marketing Success Metrics To Measure Social Media Slides PDF to effectively convey your message to a wider audience. Slidegeeks has done a lot of research before preparing these presentation templates. The content can be personalized and the slides are highly editable. Grab templates today from Slidegeeks.

Comprehensive Guide To Build Marketing Success Metrics To Measure Email Marketing Graphics PDF
The following slide showcases key performance indicators KPIs that can be used to evaluate the success of email marketing campaign performance and revise strategy accordingly. The success metrics covered in slide are open rate, click-through rate CTR, conversion rate, bounce rate, and forward rate. Coming up with a presentation necessitates that the majority of the effort goes into the content and the message you intend to convey. The visuals of a PowerPoint presentation can only be effective if it supplements and supports the story that is being told. Keeping this in mind our experts created Comprehensive Guide To Build Marketing Success Metrics To Measure Email Marketing Graphics PDF to reduce the time that goes into designing the presentation. This way, you can concentrate on the message while our designers take care of providing you with the right template for the situation.

Evaluation For Stakeholder Success Indicators Strengthen And Manage Relationships Stakeholders Template PDF
This slide covers the stakeholders engagement success measurement key performance indicators including stakeholders type , evaluation areas, methods, sources of information and long term or short termPresenting this PowerPoint presentation, titled Evaluation For Stakeholder Success Indicators Strengthen And Manage Relationships Stakeholders Template PDF, with topics curated by our researchers after extensive research. This editable presentation is available for immediate download and provides attractive features when used. Download now and captivate your audience. Presenting this Evaluation For Stakeholder Success Indicators Strengthen And Manage Relationships Stakeholders Template PDF. Our researchers have carefully researched and created these slides with all aspects taken into consideration. This is a completely customizable Evaluation For Stakeholder Success Indicators Strengthen And Manage Relationships Stakeholders Template PDF that is available for immediate downloading. Download now and make an impact on your audience. Highlight the attractive features available with our Ppts.
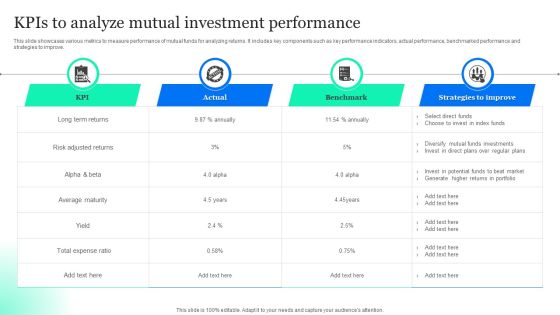
Kpis To Analyze Mutual Investment Performance Pictures PDF
This slide showcases various metrics to measure performance of mutual funds for analyzing returns. It includes key components such as key performance indicators, actual performance, benchmarked performance and strategies to improve. Pitch your topic with ease and precision using this Kpis To Analyze Mutual Investment Performance Pictures PDF. This layout presents information on Select Direct Funds, Choose Invest Index Funds, Diversify Mutual Funds. It is also available for immediate download and adjustment. So, changes can be made in the color, design, graphics or any other component to create a unique layout.
Safety And Health Kpis For Tracking Performance Graph Mockup PDF
This slide represents graph showing key performance indicators tracked by companies for assessment of safety and health performance of their workplace. It includes key metrics such as workforce awareness, safety meetings held, recordable injuries, lost work days, compliance, severity rates etc. Pitch your topic with ease and precision using this Safety And Health Kpis For Tracking Performance Graph Mockup PDF. This layout presents information on Safety And Health, Kpis For Tracking, Performance Graph. It is also available for immediate download and adjustment. So, changes can be made in the color, design, graphics or any other component to create a unique layout.
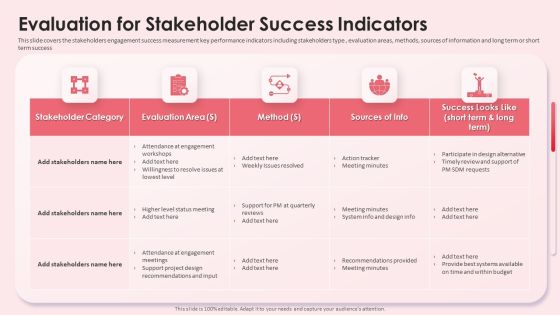
Evaluation For Stakeholder Success Indicators Impact Shareholder Decisions With Stakeholder Administration Clipart PDF
This slide covers the stakeholders engagement success measurement key performance indicators including stakeholders type , evaluation areas, methods, sources of information and long term or short term success. If you are looking for a format to display your unique thoughts, then the professionally designed Evaluation For Stakeholder Success Indicators Impact Shareholder Decisions With Stakeholder Administration Clipart PDF is the one for you. You can use it as a Google Slides template or a PowerPoint template. Incorporate impressive visuals, symbols, images, and other charts. Modify or reorganize the text boxes as you desire. Experiment with shade schemes and font pairings. Alter, share or cooperate with other people on your work. Download Evaluation For Stakeholder Success Indicators Impact Shareholder Decisions With Stakeholder Administration Clipart PDF and find out how to give a successful presentation. Present a perfect display to your team and make your presentation unforgettable.

Benefits Of Effective Stakeholder Relationship Evaluation For Stakeholder Success Indicators Background PDF
This slide covers the stakeholders engagement success measurement key performance indicators including stakeholders type , evaluation areas, methods, sources of information and long term or short term success. Here you can discover an assortment of the finest PowerPoint and Google Slides templates. With these templates, you can create presentations for a variety of purposes while simultaneously providing your audience with an eye-catching visual experience. Download Benefits Of Effective Stakeholder Relationship Evaluation For Stakeholder Success Indicators Background PDF to deliver an impeccable presentation. These templates will make your job of preparing presentations much quicker, yet still, maintain a high level of quality. Slidegeeks has experienced researchers who prepare these templates and write high-quality content for you. Later on, you can personalize the content by editing the Benefits Of Effective Stakeholder Relationship Evaluation For Stakeholder Success Indicators Background PDF.

Metric Progress Model Ppt Diagram Powerpoint Image
This is a metric progress model ppt diagram powerpoint image. This is a five stage process. The stages in this process are goals, overall business strategy, key business drivers, reporting, technical development.

Key Evaluation Metrics Ppt PowerPoint Presentation Files
This is a key evaluation metrics ppt powerpoint presentation files. This is a five stage process. The stages in this process are icons, business, management, success, percentage.
Setting Campaign Metrics Ppt PowerPoint Presentation Designs
This is a setting campaign metrics ppt powerpoint presentation designs. This is a five stage process. The stages in this process are business, strategy, marketing, management, planning.

Key Evaluation Metrics Ppt PowerPoint Presentation Model
This is a key evaluation metrics ppt powerpoint presentation model. This is a five stage process. The stages in this process are business, marketing, strategy, success, process.
 Home
Home