Kpi
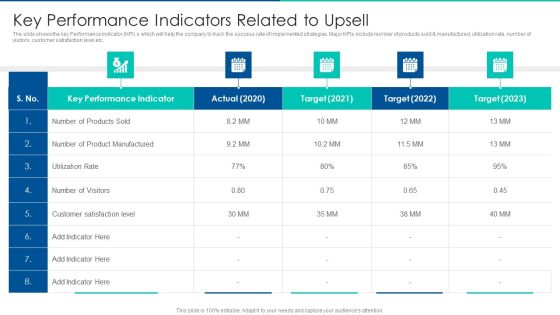
Sales Promotion Of Upgraded Product Through Upselling Key Performance Indicators Related To Upsell Information PDF
The slide shows the key Performance Indicator KPI s which will help the company to track the success rate of implemented strategies. Major KPIs include number of products sold and manufactured, utilization rate, number of visitors, customer satisfaction level etc. Deliver an awe inspiring pitch with this creative sales promotion of upgraded product through upselling key performance indicators related to upsell information pdf bundle. Topics like key performance indicator, customer satisfaction level, utilization rate can be discussed with this completely editable template. It is available for immediate download depending on the needs and requirements of the user.

Factor Influencing User Experience Dairy Industry Key Performance Indicators Rules PDF
The slide shows the key Performance Indicator KPI s which will help the company to track the success rate of implemented strategies. Major KPIs include number of Dairy Products sold and Total Milk Production, Total Milk Plants, number of customers, customer satisfaction level etc. Deliver an awe inspiring pitch with this creative factor influencing user experience dairy industry key performance indicators rules pdf bundle. Topics like key performance indicators related to dairy company can be discussed with this completely editable template. It is available for immediate download depending on the needs and requirements of the user.
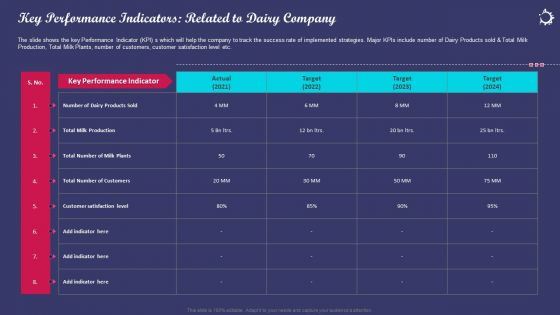
Enhancing Consumers Perception Towards Key Performance Indicators Related To Dairy Company Background PDF
The slide shows the key Performance Indicator KPI s which will help the company to track the success rate of implemented strategies. Major KPIs include number of Dairy Products sold and Total Milk Production, Total Milk Plants, number of customers, customer satisfaction level etc. Deliver and pitch your topic in the best possible manner with this enhancing consumers perception towards key performance indicators related to dairy company background pdf. Use them to share invaluable insights on key performance indicators related to dairy company and impress your audience. This template can be altered and modified as per your expectations. So, grab it now.

Environmental Impact Analysis For A Pharmaceutical Pharmaceutical Company Key Performance Indicators Template PDF
The slide shows the key Performance Indicator KPI s which will help the company to track the success rate of implemented strategies. Major KPIs include number of products sold, pharma products manufactures, research and development expenses per year, total number of patients, etcDeliver and pitch your topic in the best possible manner with this Environmental Impact Analysis For A Pharmaceutical Pharmaceutical Company Key Performance Indicators Template PDF Use them to share invaluable insights on Key Performance Indicator, Products Manufactured, Research And Development and impress your audience. This template can be altered and modified as per your expectations. So, grab it now.
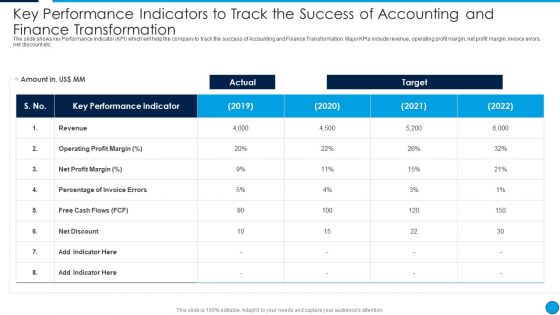
Key Performance Indicators To Track The Success Of Accounting And Finance Guidelines PDF
The slide shows key Performance Indicator KPI which will help the company to track the success of Accounting and Finance Transformation. Major KPIs include revenue, operating profit margin, net profit margin, invoice errors, net discount etc. Deliver an awe inspiring pitch with this creative Key Performance Indicators To Track The Success Of Accounting And Finance Guidelines PDF bundle. Topics like Key Performance Indicator, Target, Revenue, Net Discount can be discussed with this completely editable template. It is available for immediate download depending on the needs and requirements of the user.
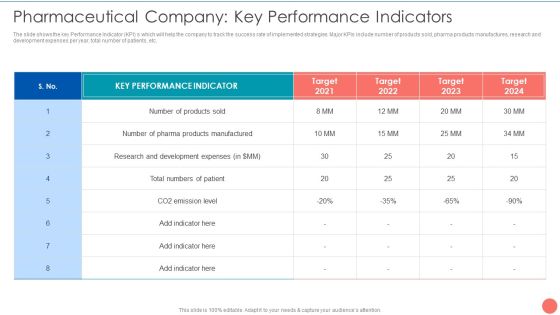
Tactics To Achieve Sustainability Pharmaceutical Company Key Performance Indicators Background PDF
The slide shows the key Performance Indicator KPI s which will help the company to track the success rate of implemented strategies. Major KPIs include number of products sold, pharma products manufactures, research and development expenses per year, total number of patients, etc. Deliver an awe inspiring pitch with this creative Tactics To Achieve Sustainability Pharmaceutical Company Key Performance Indicators Background PDF bundle. Topics like Key Performance Indicator, Number Products Sold, Total Numbers Patient can be discussed with this completely editable template. It is available for immediate download depending on the needs and requirements of the user.

Declining Of A Motor Vehicle Company Key Performance Indicators Structure PDF
The slide shows the key Performance Indicator KPI s which will help the company to track the success rate of implemented strategies. Major KPIs include number of vehicle sold and manufactured, utilization rate, number of visitors, customer satisfaction level etc. Deliver and pitch your topic in the best possible manner with this declining of a motor vehicle company key performance indicators structure pdf. Use them to share invaluable insights on manufactured, target, utilization rate, performance indicator and impress your audience. This template can be altered and modified as per your expectations. So, grab it now.
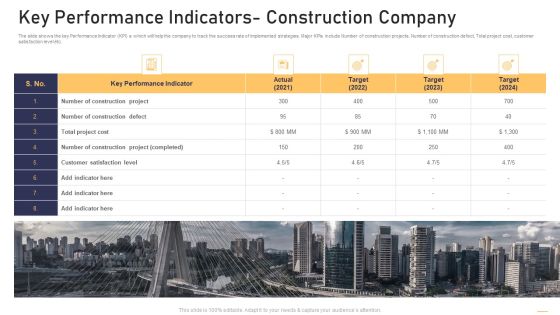
Surge In Construction Faults Lawsuits Case Competition Key Performance Indicators Construction Company Formats PDF
The slide shows the key Performance Indicator KPI s which will help the company to track the success rate of implemented strategies. Major KPIs include Number of construction projects, Number of construction defect, Total project cost, customer satisfaction level etc. Presenting surge in construction faults lawsuits case competition key performance indicators construction company formats pdf to provide visual cues and insights. Share and navigate important information on five stages that need your due attention. This template can be used to pitch topics like performance indicator, project cost, target, construction project. In addtion, this PPT design contains high resolution images, graphics, etc, that are easily editable and available for immediate download.

Innovative Business Model Of Pharmaceutical Company Key Performance Indicators Rules PDF
The slide shows the key Performance Indicator KPI s which will help the company to track the success rate of implemented strategies. Major KPIs include number of products sold, pharma products manufactures, research and development expenses per year, total number of patients, etc.Deliver and pitch your topic in the best possible manner with this Innovative Business Model Of Pharmaceutical Company Key Performance Indicators Rules PDF. Use them to share invaluable insights on Products Manufactured, Development Expenses, Key Performance and impress your audience. This template can be altered and modified as per your expectations. So, grab it now.

Key Performance Indicators Related To Talent Management And Engagement Ppt Pictures Vector PDF
The slide shows the key Performance Indicator KPI s which will help the company to track the success rate of implemented strategies. Major KPIs include number of employee recruitment , number of employee leaves, churn rate, employee satisfaction rate etc. Deliver an awe inspiring pitch with this creative key performance indicators related to talent management and engagement ppt pictures vector pdf bundle. Topics like recruitment, target, performance, churn rate, actual can be discussed with this completely editable template. It is available for immediate download depending on the needs and requirements of the user.
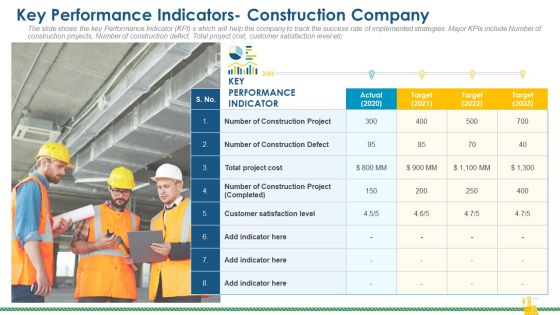
Rising Construction Defect Claims Against The Corporation Key Performance Indicators Construction Company Infographics PDF
The slide shows the key Performance Indicator KPI s which will help the company to track the success rate of implemented strategies. Major KPIs include Number of construction projects, Number of construction defect, Total project cost, customer satisfaction level etc. Deliver an awe inspiring pitch with this creative rising construction defect claims against the corporation key performance indicators construction company infographics pdf bundle. Topics like performance, project, customer satisfaction level can be discussed with this completely editable template. It is available for immediate download depending on the needs and requirements of the user.

Initiatives Atmosphere Operation Problems Pharmaceutical Firm Pharmaceutical Company Key Performance Indicators Summary PDF
The slide shows the key Performance Indicator KPI s which will help the company to track the success rate of implemented strategies. Major KPIs include number of products sold, pharma products manufactures, research and development expenses per year, total number of patients, etc Deliver and pitch your topic in the best possible manner with this initiatives atmosphere operation problems pharmaceutical firm pharmaceutical company key performance indicators summary pdf. Use them to share invaluable insights on performance, manufactured, development, research, expenses and impress your audience. This template can be altered and modified as per your expectations. So, grab it now.

Key Performance Indicators Of ABS Healthcare Company With Future Targets Topics PDF
The slide shows the key Performance Indicator KPI s which will help the company to track the success rate of implemented strategies. Some of the KPIs are number of cybersecurity cases, patient satisfaction rate, mean time to resolve threats, operational efficiency etc. Deliver an awe inspiring pitch with this creative key performance indicators of abs healthcare company with future targets topics pdf bundle. Topics like patient satisfaction rate, operational efficiency, target can be discussed with this completely editable template. It is available for immediate download depending on the needs and requirements of the user.

Key Performance Indicators Of ABS Healthcare Company With Future Targets Template PDF
The slide shows the key Performance Indicator KPI s which will help the company to track the success rate of implemented strategies. Some of the KPIs are number of cybersecurity cases, patient satisfaction rate, mean time to resolve threats, operational efficiency etc. Deliver an awe inspiring pitch with this creative key performance indicators of abs healthcare company with future targets template pdf bundle. Topics like company revenue, cybersecurity cases, operational efficiency can be discussed with this completely editable template. It is available for immediate download depending on the needs and requirements of the user.
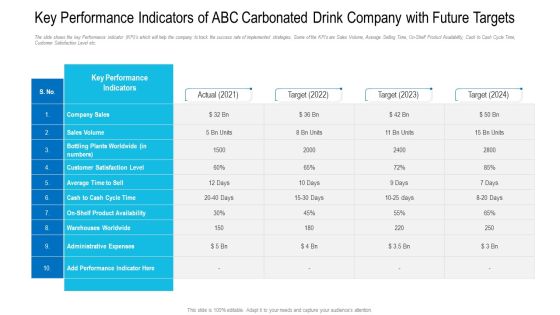
Key Performance Indicators Of ABC Carbonated Drink Company With Future Targets Infographics PDF
The slide shows the key Performance Indicator KPI s which will help the company to track the success rate of implemented strategies. Some of the KPIs are Sales Volume, Average Selling Time, On-Shelf Product Availability, Cash to Cash Cycle Time, Customer Satisfaction Level etc. Deliver and pitch your topic in the best possible manner with this key performance indicators of abc carbonated drink company with future targets infographics pdf. Use them to share invaluable insights on company sales, sales volume, average time to sell, cash to cash cycle time and impress your audience. This template can be altered and modified as per your expectations. So, grab it now.
Improvement In Employee Turnover In Technology Industry Key Performance Indicators Icons PDF
The slide shows the key Performance Indicator KPI s which will help the company to track the success rate of implemented strategies. Major KPIs include number of Total Employee Turnover, Employee Attrition rate, Total Recruitment, etc. Deliver and pitch your topic in the best possible manner with this improvement in employee turnover in technology industry key performance indicators icons pdf. Use them to share invaluable insights on recruitment, attrition, employee and impress your audience. This template can be altered and modified as per your expectations. So, grab it now.
Roadmap For Financial Accounting Transformation Key Performance Indicators To Track The Success Of Accounting Icons PDF
The slide shows key Performance Indicator KPI which will help the company to track the success of Accounting and Finance Transformation. Major KPIs include revenue, operating profit margin, net profit margin, invoice errors, net discount etc. Deliver an awe inspiring pitch with this creative roadmap for financial accounting transformation key performance indicators to track the success of accounting icons pdf bundle. Topics like revenue, operating profit margin, net profit margin, invoice errors, net discount can be discussed with this completely editable template. It is available for immediate download depending on the needs and requirements of the user.
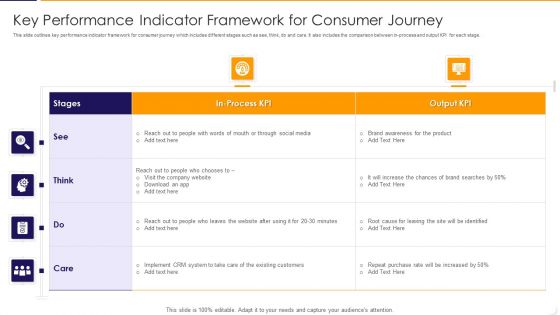
Key Performance Indicator Framework For Consumer Journey Ppt PowerPoint Presentation Gallery Good PDF
This slide outlines key performance indicator framework for consumer journey which includes different stages such as see, think, do and care. It also includes the comparison between in process and output KPI for each stage. Pitch your topic with ease and precision using this key performance indicator framework for consumer journey ppt powerpoint presentation gallery good pdf This layout presents information on social media, system, implement. It is also available for immediate download and adjustment. So, changes can be made in the color, design, graphics or any other component to create a unique layout.

Key Performance Indicators To Track The Success Of Accounting And Finance Transformation Ideas PDF
The slide shows key Performance Indicator KPI which will help the company to track the success of Accounting and Finance Transformation. Major KPIs include revenue, operating profit margin, net profit margin, invoice errors, net discount etc. Deliver and pitch your topic in the best possible manner with this Key Performance Indicators To Track The Success Of Accounting And Finance Transformation Ideas PDF. Use them to share invaluable insights on Revenue, Net Profit Margin, Target and impress your audience. This template can be altered and modified as per your expectations. So, grab it now.

Finance And Accounting Online Conversion Plan Key Performance Indicators To Track Microsoft PDF
The slide shows key Performance Indicator KPI which will help the company to track the success of Accounting and Finance Transformation. Major KPIs include revenue, operating profit margin, net profit margin, invoice errors, net discount etc. Deliver an awe inspiring pitch with this creative Finance And Accounting Online Conversion Plan Key Performance Indicators To Track Microsoft PDF bundle. Topics like Operating Profit, Percentage Invoice, Revenue can be discussed with this completely editable template. It is available for immediate download depending on the needs and requirements of the user.
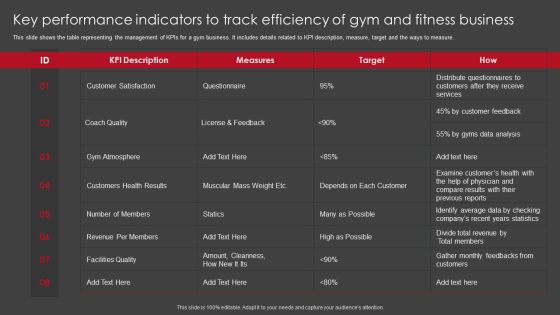
Key Performance Indicators To Track Efficiency Of Gym And Fitness Business Themes PDF
This slide shows the table representing the management of KPIs for a gym business. It includes details related to KPI description, measure, target and the ways to measure. Pitch your topic with ease and precision using this Key Performance Indicators To Track Efficiency Of Gym And Fitness Business Themes PDF. This layout presents information on Key Performance Indicators, Track Efficiency, Gym And Fitness Business. It is also available for immediate download and adjustment. So, changes can be made in the color, design, graphics or any other component to create a unique layout.

Debt Retrieval Techniques Our Key Performance Indicators For Balance Sheet Ppt Pictures Gallery PDF
Purpose of the following side is to display the major KPI for the balance sheet as it highlight the key components such as current asset, current liabilities, total assets and total liability of the organization for the financial year 2020 2021 Deliver and pitch your topic in the best possible manner with this debt retrieval techniques our key performance indicators for balance sheet ppt pictures gallery pdf. Use them to share invaluable insights on current assets, current liabilities, total assets, total liabilities and impress your audience. This template can be altered and modified as per your expectations. So, grab it now.

Debt Collection Improvement Plan Our Key Performance Indicators For Balance Sheet Professional PDF
Purpose of the following side is to display the major KPI for the balance sheet as it highlight the key components such as current asset, current liabilities, total assets and total liability of the organization for the financial year 2021 to 2022. Deliver and pitch your topic in the best possible manner with this debt collection improvement plan our key performance indicators for balance sheet professional pdf. Use them to share invaluable insights on current assets, current liabilities, total assets, total liabilities and impress your audience. This template can be altered and modified as per your expectations. So, grab it now.
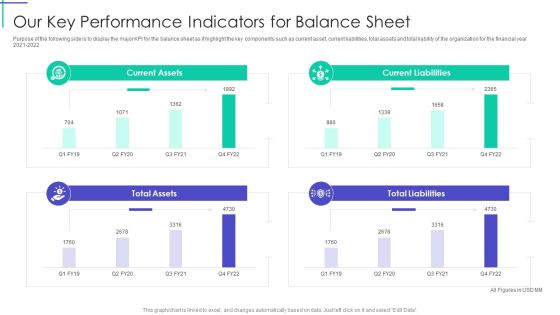
Mortgage Recovery Strategy For Finance Companies Our Key Performance Indicators For Balance Sheet Inspiration PDF
Purpose of the following side is to display the major KPI for the balance sheet as it highlight the key components such as current asset, current liabilities, total assets and total liability of the organization for the financial year 2021 to 2022. Deliver an awe inspiring pitch with this creative Mortgage Recovery Strategy For Finance Companies Our Key Performance Indicators For Balance Sheet Inspiration PDF bundle. Topics like Current Assets, Current Liabilities, Total Liabilities can be discussed with this completely editable template. It is available for immediate download depending on the needs and requirements of the user.

Metrics Dashboard Depicting Call Center Performance Pictures PDF
Mentioned slide outlines key performance indicator KPI dashboard which can be used by call center to optimize the agents performance. The major metrics covered in the template are total calls, average speed of answer, abandon rate, service level agreement SLA limit etc. Pitch your topic with ease and precision using this Metrics Dashboard Depicting Call Center Performance Pictures PDF. This layout presents information on Overall Satisfaction Score, Satisfaction Score, Performance. It is also available for immediate download and adjustment. So, changes can be made in the color, design, graphics or any other component to create a unique layout.
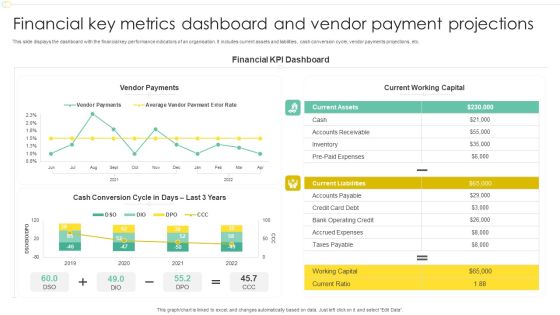
Financial Key Metrics Dashboard And Vendor Payment Projections Professional PDF
This slide displays the dashboard with the financial key performance indicators of an organisation. It includes current assets and liabilities, cash conversion cycle, vendor payments projections, etc. Pitch your topic with ease and precision using this Financial Key Metrics Dashboard And Vendor Payment Projections Professional PDF. This layout presents information on Financial KPI Dashboard, Current Working Capital, Vendor Payments. It is also available for immediate download and adjustment. So, changes can be made in the color, design, graphics or any other component to create a unique layout.
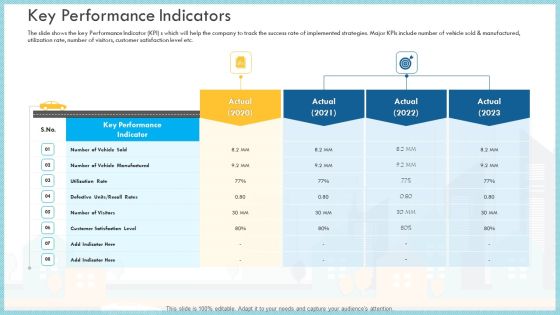
Loss Of Income And Financials Decline In An Automobile Organization Case Study Key Performance Indicators Brochure PDF
The slide shows the key Performance Indicator KPI s which will help the company to track the success rate of implemented strategies. Major KPIs include number of vehicle sold and manufactured, utilization rate, number of visitors, customer satisfaction level etc.Deliver an awe inspiring pitch with this creative loss of income and financials decline in an automobile organization case study key performance indicators brochure pdf bundle. Topics like key performance indicator, utilization rate, customer satisfaction level can be discussed with this completely editable template. It is available for immediate download depending on the needs and requirements of the user

Workforce Performance Metrics Scorecard With Recruiting Cost Per Hire Formats PDF
Mentioned slide outlines key performance indicator KPI metrics scorecard used to evaluate the performance of HR department. Average time to hire employees, recruiting cost per hire, time to build strategic competencies, etc.Showcasing this set of slides titled Workforce Performance Metrics Scorecard With Recruiting Cost Per Hire Formats PDF. The topics addressed in these templates are Strategic Competencies, Competencies Gap, Average Time Close. All the content presented in this PPT design is completely editable. Download it and make adjustments in color, background, font etc. as per your unique business setting.

Periodic Business Performance Metrics Scorecard Ideas PDF
The mentioned slide showcases how well organizations KPI have performed in overall four quarters of the year. It track and assess quarterly performance of employees,revenue generation,customer satisfaction, cash flow etc. Pitch your topic with ease and precision using this Periodic Business Performance Metrics Scorecard Ideas PDF. This layout presents information on Employee Performance, Revenue Generation, Customer Satisfaction. It is also available for immediate download and adjustment. So, changes can be made in the color, design, graphics or any other component to create a unique layout.
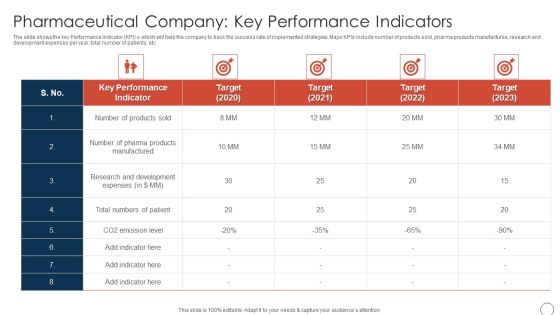
Pharmaceutical Company Key Performance Obtaining Sustainability Growing Pharmaceutical Organization Slides PDF
The slide shows the key Performance Indicator KPI s which will help the company to track the success rate of implemented strategies. Major KPIs include number of products sold, pharma products manufactures, research and development expenses per year, total number of patients, etc Deliver and pitch your topic in the best possible manner with this pharmaceutical company key performance obtaining sustainability growing pharmaceutical organization slides pdf. Use them to share invaluable insights on pharmaceutical company key performance indicators and impress your audience. This template can be altered and modified as per your expectations. So, grab it now.
Employee Training And Development Plan Performance Tracking Dashboard Portrait PDF
Mentioned slide outlines key performance indicator KPI dashboard which can be used by organization to monitor training and development strategies. The major metrics covered in the template are cost per participant, per hour, number of trainees , etc. Showcasing this set of slides titled Employee Training And Development Plan Performance Tracking Dashboard Portrait PDF. The topics addressed in these templates are Employee Training, Development Plan Performance, Tracking Dashboard. All the content presented in this PPT design is completely editable. Download it and make adjustments in color, background, font etc. as per your unique business setting.

Business Referral Marketing Program Performance Metrics Dashboard Introduction PDF
This slide shows KPI dashboard to effectively track performance of business referral program in order to attract more leads and potential customers to the busines. It includes details related to key metrics such as referral participation rate, referred customers, referral conversion rate and total revenue generated. Showcasing this set of slides titled Business Referral Marketing Program Performance Metrics Dashboard Introduction PDF. The topics addressed in these templates are Referral Participation Rate, Referred Customers, Referral Conversion Rate, Total Revenue Generated. All the content presented in this PPT design is completely editable. Download it and make adjustments in color, background, font etc. as per your unique business setting.

Metrics Scorecard For HR Manager Download PDF
This slide showcases KPI scorecard that can help to do the performance assessment of human resource manager. Its key result areas are recruitment, training and development, performance and career management and employee retention plus productivity. Showcasing this set of slides titled Metrics Scorecard For HR Manager Download PDF. The topics addressed in these templates are Key Results Areas, Recruitment, Training Development. All the content presented in this PPT design is completely editable. Download it and make adjustments in color, background, font etc. as per your unique business setting.

Business Key Performance Metrics Review Dashboard Portrait PDF
The following slide shows a dashboard of sales strategy review of firm that can be used by marketing, product, finance managers for reviewing the business. It further includes KPI that are revenue, new customer, gross profit purchaser satisfaction, income comparison, sales categories and profitability. Showcasing this set of slides titled Business Key Performance Metrics Review Dashboard Portrait PDF. The topics addressed in these templates are Sales, Revenue Comparison, Profitability. All the content presented in this PPT design is completely editable. Download it and make adjustments in color, background, font etc. as per your unique business setting.

Call Center Metrics And Metrics Dashboard With Tickets Raised Graphics PDF
Mentioned slide outlines a KPI dashboard showcasing the call center performance. The metrics covered in the slide are total dropped calls, waiting calls, total calls, team performance, recurring calls, tickets raised. Showcasing this set of slides titled Call Center Metrics And Metrics Dashboard With Tickets Raised Graphics PDF. The topics addressed in these templates are Call Management Data, Monthly Statics, Performance Records. All the content presented in this PPT design is completely editable. Download it and make adjustments in color, background, font etc. as per your unique business setting.

Measures For Demand Generation Marketing Tactics Ppt Slides Outline PDF
This slide covers the metrics used for analyzing the marketing strategies to create demand. The purpose of this template is to measure demand generation marketing efforts. It covers information about metrics including KPI Key Performance indicators, technology, etc. Pitch your topic with ease and precision using this Measures For Demand Generation Marketing Tactics Ppt Slides Outline PDF. This layout presents information on Key Performance Indicators, Details, Technology. It is also available for immediate download and adjustment. So, changes can be made in the color, design, graphics or any other component to create a unique layout.

Call Center Metrics Dashboard With Cost Per Contact Rules PDF
Mentioned slide outlines KPI dashboard which allows the business to monitor the efficiency of call center. The metrics covered in the slide are first call resolution, average speed of answer, customer satisfaction, cost per contact etc. Pitch your topic with ease and precision using this Call Center Metrics Dashboard With Cost Per Contact Rules PDF. This layout presents information on Cost Per Contract, Key Metrics, Customer Satisfaction. It is also available for immediate download and adjustment. So, changes can be made in the color, design, graphics or any other component to create a unique layout.
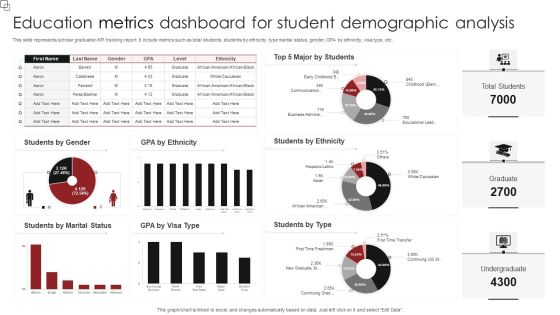
Education Metrics Dashboard For Student Demographic Analysis Diagrams PDF
This slide represents scholar graduation KPI tracking report. It include metrics such as total students, students by ethnicity, type marital status, gender, GPA by ethnicity, visa type, etc. Showcasing this set of slides titled Education Metrics Dashboard For Student Demographic Analysis Diagrams PDF. The topics addressed in these templates are Students Ethnicity, Students Type, Students Marital Status. All the content presented in this PPT design is completely editable. Download it and make adjustments in color, background, font etc. as per your unique business setting.

Customer Service Metrics Dashboard With Unresolved Calls Designs PDF
This slide showcases KPI dashboard for customer service that can help to identify the issue unresolved and response time by weekday. Its key elements are final call resolution, unresolved calls, avg response time and best day to call. Showcasing this set of slides titled Customer Service Metrics Dashboard With Unresolved Calls Designs PDF. The topics addressed in these templates are Customer Service, Metrics Dashboard, Unresolved Calls. All the content presented in this PPT design is completely editable. Download it and make adjustments in color, background, font etc. as per your unique business setting.

Dashboard For Tracking Sales Target Metrics Introduction PDF
This slide presents KPI dashboard for tracking Sales Target Metrics achievement monthly and region wise helpful in adjusting activities as per ongoing performance. It includes average weekly sales revenue, average sales target, annual sales growth, regional sales performance and average revenue per unit that should be regularly tracked. Showcasing this set of slides titled Dashboard For Tracking Sales Target Metrics Introduction PDF. The topics addressed in these templates are Average Revenue, Per Unit, Average Weekly, Sales Revenue. All the content presented in this PPT design is completely editable. Download it and make adjustments in color, background, font etc. as per your unique business setting.
Monthly Shipping And Inventory Tracking Metrics Tracker Icons PDF
This slide displays the KPI tracker for identifying the shipment, inventory, and fleet maintenance status. It also includes KPIs such as on-time delivery, on-time departure, inventory age, inventory cycle, etc. Showcasing this set of slides titled Monthly Shipping And Inventory Tracking Metrics Tracker Icons PDF. The topics addressed in these templates are Minimum Standard, Level Agreement, Metrics Tracker. All the content presented in this PPT design is completely editable. Download it and make adjustments in color, background, font etc. as per your unique business setting.
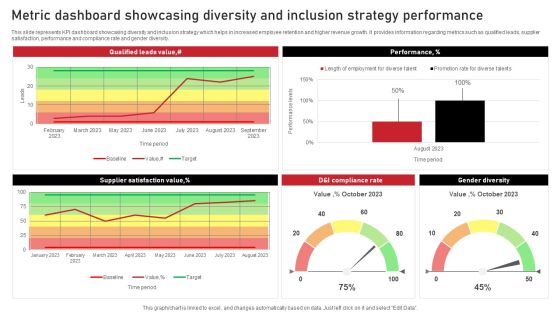
Metric Dashboard Showcasing Diversity And Inclusion Strategy Performance Background PDF
This slide represents KPI dashboard showcasing diversity and inclusion strategy which helps in increased employee retention and higher revenue growth. It provides information regarding metrics such as qualified leads, supplier satisfaction, performance and compliance rate and gender diversity. Showcasing this set of slides titled Metric Dashboard Showcasing Diversity And Inclusion Strategy Performance Background PDF. The topics addressed in these templates are Performance, Gender Diversity, Performance. All the content presented in this PPT design is completely editable. Download it and make adjustments in color, background, font etc. as per your unique business setting.
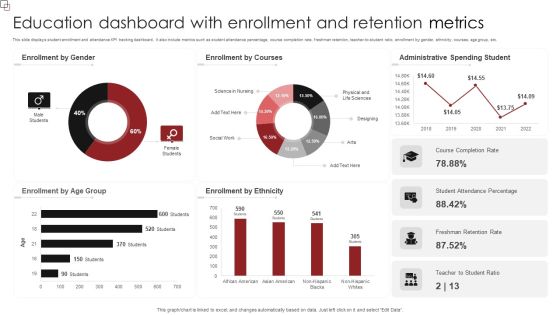
Education Dashboard With Enrollment And Retention Metrics Sample PDF
This slide displays student enrollment and attendance KPI tracking dashboard. It also include metrics such as student attendance percentage, course completion rate, freshman retention, teacher-to-student ratio, enrollment by gender, ethnicity, courses, age group, etc. Pitch your topic with ease and precision using this Education Dashboard With Enrollment And Retention Metrics Sample PDF. This layout presents information on Enrollment Gender, Enrollment Courses, Administrative Spending Student. It is also available for immediate download and adjustment. So, changes can be made in the color, design, graphics or any other component to create a unique layout.

Work Order Management Metric Dashboard Organization Physical Assets Template PDF
This slide represents KPI dashboard for work tracking and management. It covers metrics such as project health, time status, tasks, cost, progress and workload. Boost your pitch with our creative Work Order Management Metric Dashboard Organization Physical Assets Template PDF. Deliver an awe-inspiring pitch that will mesmerize everyone. Using these presentation templates you will surely catch everyones attention. You can browse the ppts collection on our website. We have researchers who are experts at creating the right content for the templates. So you do not have to invest time in any additional work. Just grab the template now and use them.
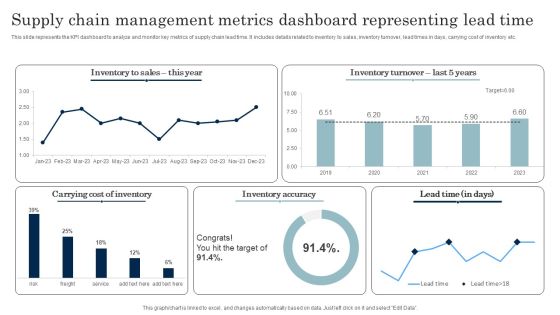
Supply Chain Management Metrics Dashboard Representing Lead Time Download PDF
This slide represents the KPI dashboard to analyze and monitor key metrics of supply chain lead time. It includes details related to inventory to sales, inventory turnover, lead times in days, carrying cost of inventory etc. Pitch your topic with ease and precision using this Supply Chain Management Metrics Dashboard Representing Lead Time Download PDF. This layout presents information on Inventory Accuracy, Carrying Cost Of Inventory. It is also available for immediate download and adjustment. So, changes can be made in the color, design, graphics or any other component to create a unique layout.

Engineering Performance Metrics Dashboard To Track Pull Requests Background PDF
This slide covers engineering KPI dashboard to track pull request. It involves KPIs such as open time of average pull requests, average comment received, revision rounds, frequency of posting pull requests. Pitch your topic with ease and precision using this Engineering Performance Metrics Dashboard To Track Pull Requests Background PDF. This layout presents information on Dashboard Track Pull Requests, Engineering Performance Metrics. It is also available for immediate download and adjustment. So, changes can be made in the color, design, graphics or any other component to create a unique layout.
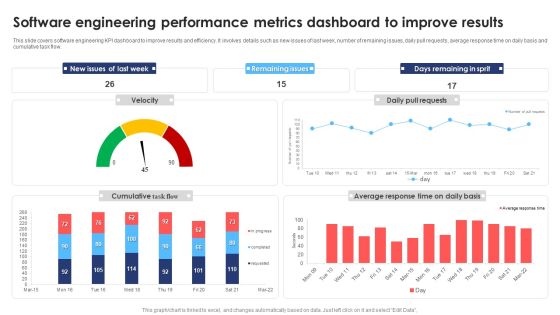
Software Engineering Performance Metrics Dashboard To Improve Results Infographics PDF
This slide covers software engineering KPI dashboard to improve results and efficiency. It involves details such as new issues of last week, number of remaining issues, daily pull requests, average response time on daily basis and cumulative task flow. Pitch your topic with ease and precision using this Software Engineering Performance Metrics Dashboard To Improve Results Infographics PDF. This layout presents information on Software Engineering Performance, Metrics Dashboard Improve Results. It is also available for immediate download and adjustment. So, changes can be made in the color, design, graphics or any other component to create a unique layout.
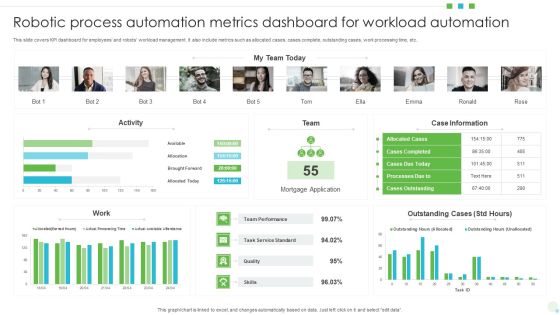
Robotic Process Automation Metrics Dashboard For Workload Automation Mockup PDF
This slide covers KPI dashboard for employees and robots workload management. It also include metrics such as allocated cases, cases complete, outstanding cases, work processing time, etc. Pitch your topic with ease and precision using this Robotic Process Automation Metrics Dashboard For Workload Automation Mockup PDF. This layout presents information on Mortgage Application, Team Performance, Case Information. It is also available for immediate download and adjustment. So, changes can be made in the color, design, graphics or any other component to create a unique layout.

Workforce Performance Metrics Scorecard To Measure Training Effectiveness Information PDF
Mentioned slide outlines HR KPI scorecard showcasing most important kpis. Organization can measure the success rate of HR strategy by tracking metrics such as training effectiveness, absence rate and cost, benefits satisfaction, productivity rate, net promotor score, etc.Pitch your topic with ease and precision using this Workforce Performance Metrics Scorecard To Measure Training Effectiveness Information PDF. This layout presents information on Absence Rate, Internal Promotion, Engagement Index. It is also available for immediate download and adjustment. So, changes can be made in the color, design, graphics or any other component to create a unique layout.

Call Center Metrics Dashboard With Average Response Time Inspiration PDF
Mentioned slide outlines KPI dashboard which can be used by call center to measure the performance of their agents. The key metrics highlighted in the dashboard are first call resolution, daily abandonment rate, total number of calls by topic, top performing call agents etc. Showcasing this set of slides titled Call Center Metrics Dashboard With Average Response Time Inspiration PDF. The topics addressed in these templates are Efficiency, Quality, Activity, Daily Average Response, Daily Average Transfer. All the content presented in this PPT design is completely editable. Download it and make adjustments in color, background, font etc. as per your unique business setting.

Call Center Metrics Dashboard With Customer Satisfaction Score Ideas PDF
Mentioned slide outlines a comprehensive call center KPI dashboard which can be used for those customers who are seeking technical support. It provides detailed information about metrics such as ticket status, ticket by channels and type, overall customer satisfaction score, etc. Showcasing this set of slides titled Call Center Metrics Dashboard With Customer Satisfaction Score Ideas PDF. The topics addressed in these templates are Customer Satisfaction, Score Ticket Status, Satisfaction Score. All the content presented in this PPT design is completely editable. Download it and make adjustments in color, background, font etc. as per your unique business setting.

Metrics Dashboard To Measure Call Center Success Themes PDF
Mentioned slide outlines a comprehensive KPI dashboard used to measure the call center performance. The dashboard monitors the status of key metrics such as call abandonment levels, current service level, average call length, total calls attended, calls waiting etc. Showcasing this set of slides titled Metrics Dashboard To Measure Call Center Success Themes PDF. The topics addressed in these templates are Center Success, Call Center Status, Call Monitor. All the content presented in this PPT design is completely editable. Download it and make adjustments in color, background, font etc. as per your unique business setting.

Metrics And Objectives To Measure Employees Performance Clipart PDF
The purpose of this slide is to showcase different KPIs and objectives used to measure employee efficiency. The KPI could be Revenue per employee profit per employee average task completion rate and utilization rate. Showcasing this set of slides titled Metrics And Objectives To Measure Employees Performance Clipart PDF. The topics addressed in these templates are Utilization Rate, Profit Per Employee, Revenue Per Employee. All the content presented in this PPT design is completely editable. Download it and make adjustments in color, background, font etc. as per your unique business setting.
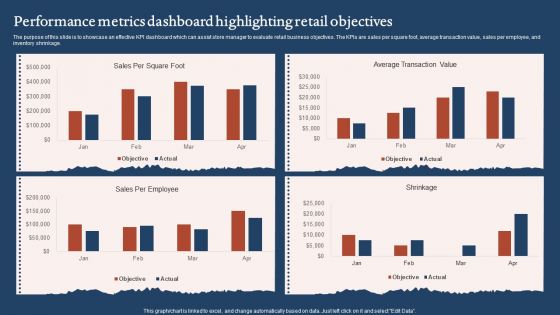
Performance Metrics Dashboard Highlighting Retail Objectives Sample PDF
The purpose of this slide is to showcase an effective KPI dashboard which can assist store manager to evaluate retail business objectives. The KPIs are sales per square foot, average transaction value, sales per employee, and inventory shrinkage. Pitch your topic with ease and precision using this Performance Metrics Dashboard Highlighting Retail Objectives Sample PDF. This layout presents information on Average Transaction Value, Sales Per Employee. It is also available for immediate download and adjustment. So, changes can be made in the color, design, graphics or any other component to create a unique layout.
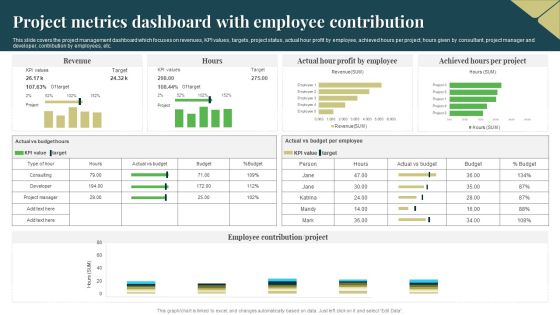
Project Metrics Dashboard With Employee Contribution Guidelines PDF
This slide covers the project management dashboard which focuses on revenues, KPI values, targets, project status, actual hour profit by employee, achieved hours per project, hours given by consultant, project manager and developer, contribution by employees, etc. Showcasing this set of slides titled Project Metrics Dashboard With Employee Contribution Guidelines PDF. The topics addressed in these templates are Target, Revenue, Profit By Employee. All the content presented in this PPT design is completely editable. Download it and make adjustments in color, background, font etc. as per your unique business setting.

Advertising Campaign Cost Metrics With Click Through Rate Pictures PDF
This slide covers advertising campaign cost KPI with click through rate which includes advertising cost, cost per conversion etc. Further, it includes monthly advertisement impressions and clicks for user engagement. Showcasing this set of slides titled Advertising Campaign Cost Metrics With Click Through Rate Pictures PDF. The topics addressed in these templates are Conversion Rate, Cost Per Click, Advertising Cost. All the content presented in this PPT design is completely editable. Download it and make adjustments in color, background, font etc. as per your unique business setting.

Construction Project Engineering Performance Metrics Dashboard Ideas PDF
This slide covers construction project engineering KPI dashboard to analyse work status. It involves KPIs such as work status, projects by stage, completion percentage of projects, utilized duration, budget variance and workload. Showcasing this set of slides titled Construction Project Engineering Performance Metrics Dashboard Ideas PDF. The topics addressed in these templates are Budget Variance, Resource, Project. All the content presented in this PPT design is completely editable. Download it and make adjustments in color, background, font etc. as per your unique business setting.

Call Center Metrics Dashboard Highlighting Service Level Infographics PDF
Mentioned slide outlines comprehensive call center KPI dashboard. Information covered in this slide is related to various metrics such as queue calls, support and billing service level, inbound volume, outbound volume etc. Pitch your topic with ease and precision using this Call Center Metrics Dashboard Highlighting Service Level Infographics PDF. This layout presents information on All Agents, Queue Calls, Billing Service Level. It is also available for immediate download and adjustment. So, changes can be made in the color, design, graphics or any other component to create a unique layout.

Call Center Metrics Dashboard With First Response Time Background PDF
Mentioned slide outlines a KPI dashboard which can be used by call centers for the ticket system. Tickets created, unassigned, open, solved, escalated, tickets solved by agents, first response and full resolution time are the key metrics highlighted in the slide. Pitch your topic with ease and precision using this Call Center Metrics Dashboard With First Response Time Background PDF. This layout presents information on First Response Time, First Resolution Time, Response Time. It is also available for immediate download and adjustment. So, changes can be made in the color, design, graphics or any other component to create a unique layout.

Marketing Objectives And Metrics With Key Strategies Formats PDF
The purpose of this slide is to showcase different objectives and KPIs of the marketing team. The KPI could be customer lifetime value digital marketing ROI landing page conversion rate and lead to customer ratio. Pitch your topic with ease and precision using this Marketing Objectives And Metrics With Key Strategies Formats PDF. This layout presents information on Key Strategies, Conversion Rate, Customer Lifetime Value. It is also available for immediate download and adjustment. So, changes can be made in the color, design, graphics or any other component to create a unique layout.

Customer Service Metrics Dashboard With Net Retention Rate Sample PDF
This slide showcases KPI dashboard for customer service that can help to compare the customer churn rate, revenue churn rate, net retention rate and MRR growth rate as compared to previous month. Its key elements are net promoter score, loyal customer rate, percentage of premium users and customer lifetime value. Pitch your topic with ease and precision using this Customer Service Metrics Dashboard With Net Retention Rate Sample PDF. This layout presents information on Loyal Customer Rate, Premium Users, Customer Lifetime Value. It is also available for immediate download and adjustment. So, changes can be made in the color, design, graphics or any other component to create a unique layout.
Shipping Delivery Tracking Metrics Analysis Dashboard Structure PDF
This template illustrates the KPI dashboard for tracking shipment orders. It also includes shipment analysis based on different KPIs such as ongoing delivery, completed delivery, on-time delivery, actual delivery duration, and variance between expected and actual delivery time. Pitch your topic with ease and precision using this Shipping Delivery Tracking Metrics Analysis Dashboard Structure PDF. This layout presents information on Recipient Country, Completed Deliveries, Delivery Duration. It is also available for immediate download and adjustment. So, changes can be made in the color, design, graphics or any other component to create a unique layout.

Quarterly Cost Variance Analysis With Maintenance Metrics Dashboard Information PDF
The following slide depicts a maintenance KPI dashboard to have useful insights for effective decision making. It includes key performance areas such as quarterly cost variance, scrap, quarterly run time variance analysis etc. Pitch your topic with ease and precision using this Quarterly Cost Variance Analysis With Maintenance Metrics Dashboard Information PDF. This layout presents information on Production, Budgeted Cost, Planned Run Time, Actual Run Time. It is also available for immediate download and adjustment. So, changes can be made in the color, design, graphics or any other component to create a unique layout.

Metric Dashboard To Track Supplier Diversity And Performance Designs PDF
This slide represents KPI dashboard for tracking supplier diversity in organization and measure performance. It provides information regarding organization spending cost, supplier count, diversity type, status etc. Pitch your topic with ease and precision using this Metric Dashboard To Track Supplier Diversity And Performance Designs PDF. This layout presents information on Diversity Type, Diversity Status, Diverse Supplier. It is also available for immediate download and adjustment. So, changes can be made in the color, design, graphics or any other component to create a unique layout.

Customer Service Kpis Metrics With Objectives Introduction PDF
The purpose of this slide is to showcase KPIs and objectives of customer service department. Customer satisfaction score, first response time, average handle time and cost per resolution are some of the key KPI mentioned in the slide. Persuade your audience using this Customer Service Kpis Metrics With Objectives Introduction PDF. This PPT design covers one stages, thus making it a great tool to use. It also caters to a variety of topics including Customer Satisfaction, Target, Average Handle. Download this PPT design now to present a convincing pitch that not only emphasizes the topic but also showcases your presentation skills.
Robotic Process Automation Metrics Dashboard For Tracking Business Return On Investment Information PDF
This slide illustrates KPI Dashboard for measuring time and money saved after RPA deployment. It also include metrics for analysis such as productivity in robot hours, hours saved per process, money saved per process, etc. Pitch your topic with ease and precision using this Robotic Process Automation Metrics Dashboard For Tracking Business Return On Investment Information PDF. This layout presents information on Management, Goal, Productivity. It is also available for immediate download and adjustment. So, changes can be made in the color, design, graphics or any other component to create a unique layout.

Key Tips To Improve E Commerce Website Management Ppt Icon Show PDF
This slide illustrates key tips which can be used by online business to increase website traffic and conversion rate. It includes tips such as website backup, loading time, perform keyword analysis and key performance indicators review. Persuade your audience using this Key Tips To Improve E Commerce Website Management Ppt Icon Show PDF. This PPT design covers four stages, thus making it a great tool to use. It also caters to a variety of topics including Website Backup, Loading Time, Perform Keyword Analysis, KPI Review . Download this PPT design now to present a convincing pitch that not only emphasizes the topic but also showcases your presentation skills.
Market Evaluation Of IT Industry Marketing Campaign Dashboard For B2b Marketers Icons PDF
The following slide showcases key performance indicator KPI dashboard that can assist managers to evaluate digital marketing campaign performance. The key metrics mentioned in the slide are click through rate CTR, conversion rate, cost per click CPC, etc. Make sure to capture your audiences attention in your business displays with our gratis customizable Market Evaluation Of IT Industry Marketing Campaign Dashboard For B2b Marketers Icons PDF. These are great for business strategies, office conferences, capital raising or task suggestions. If you desire to acquire more customers for your tech business and ensure they stay satisfied, create your own sales presentation with these plain slides.

Dashboard To Analyze Flexible Working Strategies Impact On Employees Performance Rules PDF
The following slide delineates a key performance indicator KPI dashboard through which managers can evaluate the success of a flexible working policy on workforce performance. The major KPIs are absenteeism rate, overall labor effectiveness etc.If your project calls for a presentation, then Slidegeeks is your go-to partner because we have professionally designed, easy to edit templates that are perfect for any presentation. After downloading, you can easily edit Dashboard To Analyze Flexible Working Strategies Impact On Employees Performance Rules PDF and make the changes accordingly. You can rearrange slides or fill them with different images. Check out all the handy templates
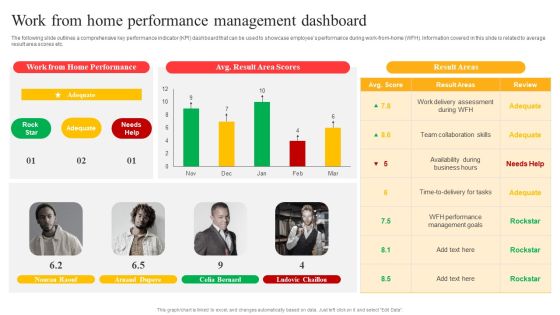
Flexible Working Policies And Guidelines Work From Home Performance Management Dashboard Introduction PDF
The following slide outlines a comprehensive key performance indicator KPI dashboard that can be used to showcase employees performance during work from home WFH. Information covered in this slide is related to average result area scores etc. There are so many reasons you need a Flexible Working Policies And Guidelines Work From Home Performance Management Dashboard Introduction PDF. The first reason is you cannot spend time making everything from scratch, Thus, Slidegeeks has made presentation templates for you too. You can easily download these templates from our website easily.

Human Resource Robotic Process Automation Metrics Operations Kpis With Success Rate Themes PDF
This slide covers KPI dashboard for measuring the impact of RPA deployment on the HR department. It also include metrics such as automated processes, success rate, robot utilization, robot productivity, average processes duration in hours, etc. Showcasing this set of slides titled Human Resource Robotic Process Automation Metrics Operations Kpis With Success Rate Themes PDF. The topics addressed in these templates are Processes Automated, Robot Productivity, Robot Utilization. All the content presented in this PPT design is completely editable. Download it and make adjustments in color, background, font etc. as per your unique business setting.

Service Teams Performance Analysis Robotic Process Automation Metrics Dashboard Brochure PDF
This template covers KPI dashboard for measuring the impact of RPA on support team performance. It also include metrics such as average NPS, average desktop focus, application utilization, etc. Showcasing this set of slides titled Service Teams Performance Analysis Robotic Process Automation Metrics Dashboard Brochure PDF. The topics addressed in these templates are Opportunity, Production Goal Strategically, Application Utilization. All the content presented in this PPT design is completely editable. Download it and make adjustments in color, background, font etc. as per your unique business setting.

Improving Digital Community Engagement Strategy Social Media Platforms Dashboard With Key Metrics Professional PDF
This slide shows KPI dashboard for assessing performance of social media platforms. It provides information about followers, likes, clicks, shares, impressions, engaged users, new followers, etc. Deliver and pitch your topic in the best possible manner with this Improving Digital Community Engagement Strategy Social Media Platforms Dashboard With Key Metrics Professional PDF. Use them to share invaluable insights on Social Media Platforms Engagement, Key Engagement Metrics and impress your audience. This template can be altered and modified as per your expectations. So, grab it now.
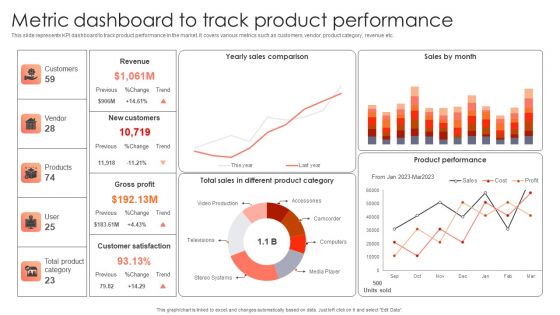
Management Plan For Product Life Cycle Metric Dashboard To Track Product Performance Infographics PDF
This slide represents KPI dashboard to track product performance in the market. It covers various metrics such as customers, vendor, product category, revenue etc. Slidegeeks has constructed Management Plan For Product Life Cycle Metric Dashboard To Track Product Performance Infographics PDF after conducting extensive research and examination. These presentation templates are constantly being generated and modified based on user preferences and critiques from editors. Here, you will find the most attractive templates for a range of purposes while taking into account ratings and remarks from users regarding the content. This is an excellent jumping-off point to explore our content and will give new users an insight into our top-notch PowerPoint Templates.

Metric Dashboard Showcasing Measurement Of Gender Diversity Pay Gap Sample PDF
This slide represents KPI dashboard showcasing metrics to measure gender pay gap. It provides information regarding salary pay gap, bonus pay gap, women promoted, recruited, and total women in each department. Pitch your topic with ease and precision using this Metric Dashboard Showcasing Measurement Of Gender Diversity Pay Gap Sample PDF. This layout presents information on Marketing, Screened, Delivery. It is also available for immediate download and adjustment. So, changes can be made in the color, design, graphics or any other component to create a unique layout.

Strategies For Effective Product Metric Dashboard To Measure Product Performance Download PDF
This slide represents KPI dashboard for measuring product performance. It covers total activities, new customers, events, net promoter score etc. Welcome to our selection of the Strategies For Effective Product Metric Dashboard To Measure Product Performance Download PDF. These are designed to help you showcase your creativity and bring your sphere to life. Planning and Innovation are essential for any business that is just starting out. This collection contains the designs that you need for your everyday presentations. All of our PowerPoints are 100 percent editable, so you can customize them to suit your needs. This multi-purpose template can be used in various situations. Grab these presentation templates today.

Engineering Performance Metrics Dashboard To Track Cloud Services Cost Clipart PDF
This slide covers engineering KPI dashboard to track cost of cloud services. It involves KPIs such as average delay of product, cost of cloud services, pageview by browser and pull requests by projects. Showcasing this set of slides titled Engineering Performance Metrics Dashboard To Track Cloud Services Cost Clipart PDF. The topics addressed in these templates are Cost Of Cloud Services, Average, Product. All the content presented in this PPT design is completely editable. Download it and make adjustments in color, background, font etc. as per your unique business setting.

Marketing Success Metrics Tracking Followers Count To Improve User Engagement Template PDF
This slide covers an overview of the follower count KPI to identify the number of users following the account on social media platforms. It also includes strategies to increase followers, such as throwing contests, posting exclusive content, and partnering with influencers. From laying roadmaps to briefing everything in detail, our templates are perfect for you. You can set the stage with your presentation slides. All you have to do is download these easy-to-edit and customizable templates. Marketing Success Metrics Tracking Followers Count To Improve User Engagement Template PDF will help you deliver an outstanding performance that everyone would remember and praise you for. Do download this presentation today.
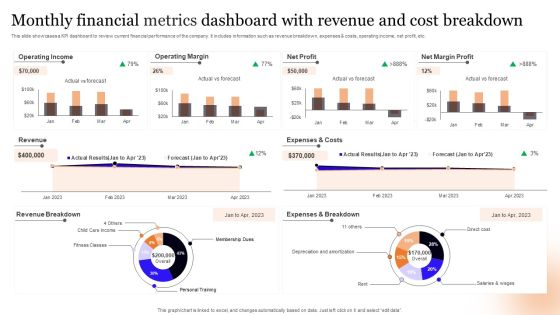
Monthly Financial Metrics Dashboard With Revenue And Cost Breakdown Information PDF
This slide showcases a KPI dashboard to review current financial performance of the company. It includes information such as revenue breakdown, expenses and costs, operating income, net profit, etc. Pitch your topic with ease and precision using this Monthly Financial Metrics Dashboard With Revenue And Cost Breakdown Information PDF. This layout presents information on Operating Income, Operating Margin, Net Profit. It is also available for immediate download and adjustment. So, changes can be made in the color, design, graphics or any other component to create a unique layout.

Call Center Metrics Dashboard To Measure Customer Satisfaction Level Slides PDF
Mentioned slide outlines call center KPI dashboard which will assist various call centers to evaluate the customer satisfaction level. The critical KPIs mentioned in the template are total revenue earned, cost per support, average time taken to solve an issue etc. Showcasing this set of slides titled Call Center Metrics Dashboard To Measure Customer Satisfaction Level Slides PDF. The topics addressed in these templates are Total Revenue, Support Costs, Customer Satisfaction. All the content presented in this PPT design is completely editable. Download it and make adjustments in color, background, font etc. as per your unique business setting.
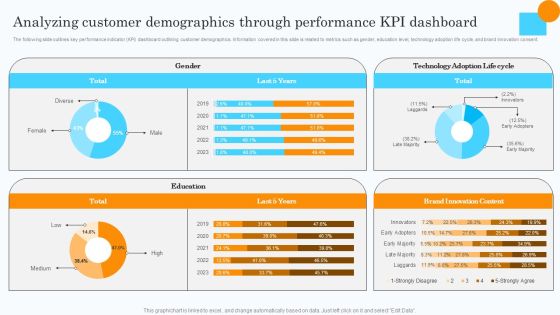
Market Research Assessment Of Target Market Requirements Analyzing Customer Demographics Clipart PDF
The following slide outlines key performance indicator KPI dashboard outlining customer demographics. Information covered in this slide is related to metrics such as gender, education level, technology adoption life cycle, and brand innovation consent. There are so many reasons you need a Market Research Assessment Of Target Market Requirements Analyzing Customer Demographics Clipart PDF. The first reason is you cannot spend time making everything from scratch, Thus, Slidegeeks has made presentation templates for you too. You can easily download these templates from our website easily.

Awareness Kpis To Track Brand Effectiveness Brand Introduction Plan Background PDF
This template covers key performance indicator KPI to determine the performance against the company objectives. These Social media KPIs would be focusing on social engagements, content reach, purchase leads and conversions.Want to ace your presentation in front of a live audience Our Awareness Kpis To Track Brand Effectiveness Brand Introduction Plan Background PDF can help you do that by engaging all the users towards you.. Slidegeeks experts have put their efforts and expertise into creating these impeccable powerpoint presentations so that you can communicate your ideas clearly. Moreover, all the templates are customizable, and easy-to-edit and downloadable. Use these for both personal and commercial use.
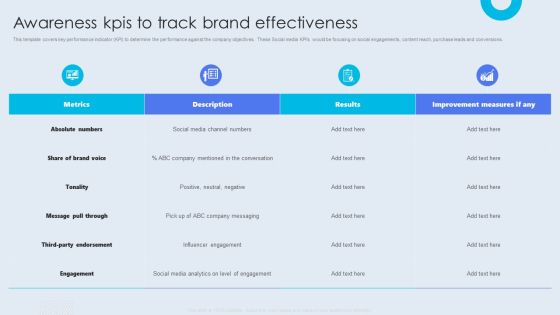
Internal Brand Launch Plan Awareness Kpis To Track Brand Effectiveness Template PDF
This template covers key performance indicator KPI to determine the performance against the company objectives. These Social media KPIs would be focusing on social engagements, content reach, purchase leads and conversions. Want to ace your presentation in front of a live audience Our Internal Brand Launch Plan Awareness Kpis To Track Brand Effectiveness Template PDF can help you do that by engaging all the users towards you. Slidegeeks experts have put their efforts and expertise into creating these impeccable powerpoint presentations so that you can communicate your ideas clearly. Moreover, all the templates are customizable, and easy-to-edit and downloadable. Use these for both personal and commercial use.

Direct Marketing Techniques To Enhance Business Presence Social Media Marketing Dashboard To Evaluate Rules PDF
The purpose of this slide is to highlight key performance indicator KPI dashboard which will assist marketers to analyze company performance across social media platforms. The kpis outlined in slide are social media followers, page likes, etc. Make sure to capture your audiences attention in your business displays with our gratis customizable Direct Marketing Techniques To Enhance Business Presence Social Media Marketing Dashboard To Evaluate Rules PDF. These are great for business strategies, office conferences, capital raising or task suggestions. If you desire to acquire more customers for your tech business and ensure they stay satisfied, create your own sales presentation with these plain slides.

Advertising New Commodities Through Affect Of Extension Strategies On Brands Icons PDF
This slide showcases affect of key extension strategies on major key performance indicators KPI and market insights. It provides details about lifetime value, audience share, customer retention rate, customer engagement, online promotion, etc. Find a pre-designed and impeccable Advertising New Commodities Through Affect Of Extension Strategies On Brands Icons PDF. The templates can ace your presentation without additional effort. You can download these easy-to-edit presentation templates to make your presentation stand out from others. So, what are you waiting for Download the template from Slidegeeks today and give a unique touch to your presentation.

Change Administration Strategies Key Kpis For Digital Transformation Designs PDF
Purpose of the following slide is to show the KPI which can be used to measure the digital transformation, these kpis can be customer experience, user metrics and application metrics. This is a Change Administration Strategies Key Kpis For Digital Transformation Designs PDF template with various stages. Focus and dispense information on five stages using this creative set, that comes with editable features. It contains large content boxes to add your information on topics like Customer Experience Metrics, Application Metrics, User Metrics. You can also showcase facts, figures, and other relevant content using this PPT layout. Grab it now.

Playbook For Enterprise Transformation Administration Key Kpis For Digital Transformation Sample PDF
Purpose of the following slide is to show the KPI which can be used to measure the digital transformation, these KPIs can be customer experience, user metrics and application metrics. This is a Playbook For Enterprise Transformation Administration Key Kpis For Digital Transformation Sample PDF template with various stages. Focus and dispense information on five stages using this creative set, that comes with editable features. It contains large content boxes to add your information on topics like User Metrics, Application Metrics, Customer Experience Metrics. You can also showcase facts, figures, and other relevant content using this PPT layout. Grab it now.

Digitalization Guide For Business Key Kpis For Digital Transformation Mockup PDF
Purpose of the following slide is to show the KPI which can be used to measure the digital transformation, these KPIs can be customer experience, user metrics and application metrics. This is a Digitalization Guide For Business Key Kpis For Digital Transformation Mockup PDF template with various stages. Focus and dispense information on five stages using this creative set, that comes with editable features. It contains large content boxes to add your information on topics like Measuring Digital, Transformation, Strategy Enlisted. You can also showcase facts, figures, and other relevant content using this PPT layout. Grab it now.

Cost Estimate For Execution Of The Strategies Portrait PDF
The slide shows the key Performance Indicator KPI s which will help the company to track the success rate of implemented strategies. Major KPIs include Number of construction projects, Number of construction defect, Total project cost, customer satisfaction level etc.Deliver and pitch your topic in the best possible manner with this cost estimate for execution of the strategies portrait pdf. Use them to share invaluable insights on quality assurance strategy, evaluations of the site strategy, establish quality and impress your audience. This template can be altered and modified as per your expectations. So, grab it now.

Best Practices To Improve Vendor Management Strategy Vendor Management Strategies Microsoft PDF
This slide showcases best practices to enhance supplier management strategy. It provides information about requirements, expectations, deadlines, collaboration, key performance indicators KPIs, vendor risk assessment, etc. Presenting Best Practices To Improve Vendor Management Strategy Vendor Management Strategies Microsoft PDF to provide visual cues and insights. Share and navigate important information on three stages that need your due attention. This template can be used to pitch topics like Vendor Collaboration, Risk Assessment, Kpi Establishment. In addtion, this PPT design contains high resolution images, graphics, etc, that are easily editable and available for immediate download.
Tracking Sheet To Planning Multiples Projects With Task Status Information PDF
Mentioned slide outlines a key performance indicator KPI dashboard to plan and measure project progress . Information covered in this slide is related to project names, start and end date, progress details, planned vs actual hours, and issues and risks involved. Showcasing this set of slides titled Tracking Sheet To Planning Multiples Projects With Task Status Information PDF. The topics addressed in these templates are Progress, Issues And Risks, Project. All the content presented in this PPT design is completely editable. Download it and make adjustments in color, background, font etc. as per your unique business setting.
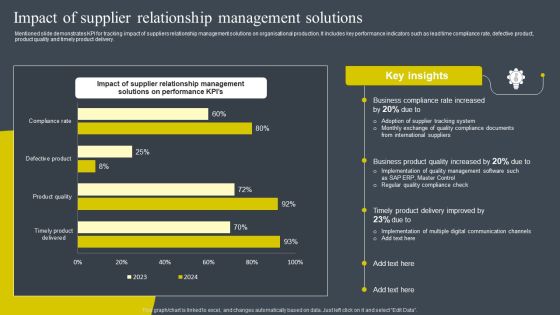
Impact Of Supplier Relationship Management Solutions Rules PDF
Mentioned slide demonstrates KPI for tracking impact of suppliers relationship management solutions on organisational production. It includes key performance indicators such as lead time compliance rate, defective product, product quality and timely product delivery. The best PPT templates are a great way to save time, energy, and resources. Slidegeeks have 100 percent editable powerpoint slides making them incredibly versatile. With these quality presentation templates, you can create a captivating and memorable presentation by combining visually appealing slides and effectively communicating your message. Download Impact Of Supplier Relationship Management Solutions Rules PDF from Slidegeeks and deliver a wonderful presentation.

Electronic Playbook Key Kpis For Digital Transformation Infographics PDF
Purpose of the following slide is to show the KPI which can be used to measure the digital transformation, these KPIs can be customer experience, user metrics and application metrics. This is a electronic playbook key kpis for digital transformation infographics pdf template with various stages. Focus and dispense information on five stages using this creative set, that comes with editable features. It contains large content boxes to add your information on topics like customer experience metrics, application metrics, satisfaction rate customer You can also showcase facts, figures, and other relevant content using this PPT layout. Grab it now.

Call Center Kpis Agent Performance Dashboard Clipart PDF
This slide covers contact center agent performance metrics KPI dashboard. It involves metrics such as number of calls, average response time, average hold time, daily average transfer rate and agents with most hold time and transfer rate. Showcasing this set of slides titled Call Center Kpis Agent Performance Dashboard Clipart PDF. The topics addressed in these templates are Transfer Rate, Call Center, Hold Time. All the content presented in this PPT design is completely editable. Download it and make adjustments in color, background, font etc. as per your unique business setting.

Project Delivery Method Dashboard With Service Level Agreement Status Clipart PDF
This slide outlines KPI dashboard which cover details of project delivery metrics. The metrics covered in the dashboard are total investment, revenue generated, total days spent on projects, service level agreement status by individual project etc. Pitch your topic with ease and precision using this project delivery method dashboard with service level agreement status clipart pdf. This layout presents information on project delivery method dashboard with service level agreement status. It is also available for immediate download and adjustment. So, changes can be made in the color, design, graphics or any other component to create a unique layout.
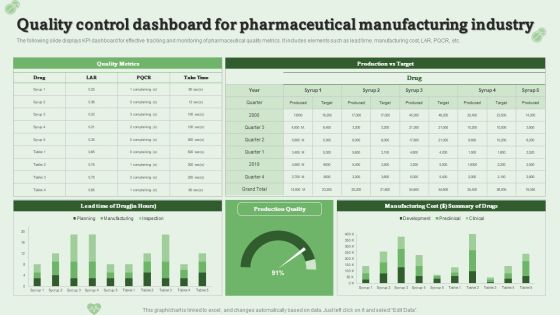
Quality Control Dashboard For Pharmaceutical Manufacturing Industry Ppt PowerPoint Presentation Model Layouts PDF
The following slide displays KPI dashboard for effective tracking and monitoring of pharmaceutical quality metrics. It includes elements such as lead time, manufacturing cost, LAR, PQCR, etc.Pitch your topic with ease and precision using this Quality Control Dashboard For Pharmaceutical Manufacturing Industry Ppt PowerPoint Presentation Model Layouts PDF. This layout presents information on Manufacturing Cost, Summary Drugs, Quality Metrics. It is also available for immediate download and adjustment. So, changes can be made in the color, design, graphics or any other component to create a unique layout.

Consumer Journey Mapping Techniques Dashboard For Tracking Social Media Platforms Introduction PDF
This slide covers the KPI dashboard for analyzing social media channels. It includes metrics such as social media followers, Facebook daily reach, Facebook engaged users and page impressions, etc. Pitch your topic with ease and precision using this Consumer Journey Mapping Techniques Dashboard For Tracking Social Media Platforms Introduction PDF. This layout presents information on Linkedin Key Metrics, Social Media Followers, Awareness. It is also available for immediate download and adjustment. So, changes can be made in the color, design, graphics or any other component to create a unique layout.
Developing Appealing Persona Social Media Marketing Performance Tracking Guidelines PDF
Following slide displays KPI dashboard that can be used to monitor the performance of social media marketing campaign. Metrics covered are related to fans number, engagement rate and page impressions. Create an editable Developing Appealing Persona Social Media Marketing Performance Tracking Guidelines PDF that communicates your idea and engages your audience. Whether youre presenting a business or an educational presentation, pre-designed presentation templates help save time. Developing Appealing Persona Social Media Marketing Performance Tracking Guidelines PDF is highly customizable and very easy to edit, covering many different styles from creative to business presentations. Slidegeeks has creative team members who have crafted amazing templates. So, go and get them without any delay.
Optimizing Consumer Lead Nurturing Procedure Lead Generation Dashboard For Tracking Introduction PDF
This slide covers the KPI dashboard for tracking lead conversion rates. It includes metrics such as visitors, average session rate, per visit, bounce rate, page views, etc. Create an editable Optimizing Consumer Lead Nurturing Procedure Lead Generation Dashboard For Tracking Introduction PDF that communicates your idea and engages your audience. Whether youre presenting a business or an educational presentation, pre designed presentation templates help save time. Optimizing Consumer Lead Nurturing Procedure Lead Generation Dashboard For Tracking Introduction PDF is highly customizable and very easy to edit, covering many different styles from creative to business presentations. Slidegeeks has creative team members who have crafted amazing templates. So, go and get them without any delay.
Digital Sales Enhancement Marketing Strategy Inspiration PDF
The following slide exhibits marketing strategy at various stages to improve digital sales which can also assist businesses to attain their goals and gain competitive edge over competition. The slide covers elements such as objective, tactics, and several metrics. Showcasing this set of slides titled Digital Sales Enhancement Marketing Strategy Inspiration PDF. The topics addressed in these templates are Objective, Strategies, KPI Measure. All the content presented in this PPT design is completely editable. Download it and make adjustments in color, background, font etc. as per your unique business setting.

Stream Processing Dashboard With Incidents Status Ppt PowerPoint Presentation Gallery Portrait PDF
The following slide outlines a KPI dashboard of data ingestion. The dashboard covers key metrics such as incidents by category and severity, contributing cause, root cause, incident trends and status, etc. Showcasing this set of slides titled Stream Processing Dashboard With Incidents Status Ppt PowerPoint Presentation Gallery Portrait PDF. The topics addressed in these templates are Incidens, Category And Severity, Incidents By Facility, Contributing Cause. All the content presented in this PPT design is completely editable. Download it and make adjustments in color, background, font etc. as per your unique business setting.

Brand Promotion Advertising Dashboard With Purchase Kpis Ppt PowerPoint Presentation File Format PDF
This slide illustrates the KPI dashboard for brand management. It also includes tracking metrics such as brand awareness, brand commitment, brand attribute, advertising awareness, sources of ad awareness, market share, repeat purchase, etc. Showcasing this set of slides titled Brand Promotion Advertising Dashboard With Purchase Kpis Ppt PowerPoint Presentation File Format PDF. The topics addressed in these templates are Brand Awareness, Advertising Awareness, Purchase Frequency. All the content presented in this PPT design is completely editable. Download it and make adjustments in color, background, font etc. as per your unique business setting.

Consumer Journey Mapping Techniques Dashboard For Tracking Digital Content Performance Clipart PDF
This slide covers the KPI dashboard for analyzing online content. It includes metrics such as blog visitors, pageviews, newsletter conversion rate, new signups, new customers, etc. Showcasing this set of slides titled Consumer Journey Mapping Techniques Dashboard For Tracking Digital Content Performance Clipart PDF. The topics addressed in these templates are Purchase Amount, Customers, Tracking Digital Content Performance. All the content presented in this PPT design is completely editable. Download it and make adjustments in color, background, font etc. as per your unique business setting.
Consumer Journey Mapping Techniques Online Ad Campaign Performance Tracking Dashboard Topics PDF
This slide covers the KPI dashboard for measuring digital campaign results. It includes metrics such as Ad cost, clicks, impressions, CTR, cost per click, conversions, conversion rate, cost per click, cost per thousand impressions, etc. Showcasing this set of slides titled Consumer Journey Mapping Techniques Online Ad Campaign Performance Tracking Dashboard Topics PDF. The topics addressed in these templates are Conversation Rate, Cost Per Conversion. All the content presented in this PPT design is completely editable. Download it and make adjustments in color, background, font etc. as per your unique business setting.
Consumer Journey Mapping Techniques Referral Program Performance Tracking Dashboard Formats PDF
This slide covers the KPI dashboard for analyzing referral campaign results. It includes metrics such as total revenue generated, monthly recurring revenue, new customers, clicks, cancelled customers, paying customers, etc. Showcasing this set of slides titled Consumer Journey Mapping Techniques Referral Program Performance Tracking Dashboard Formats PDF. The topics addressed in these templates are Revenue, New Customers, Paying Customers. All the content presented in this PPT design is completely editable. Download it and make adjustments in color, background, font etc. as per your unique business setting.
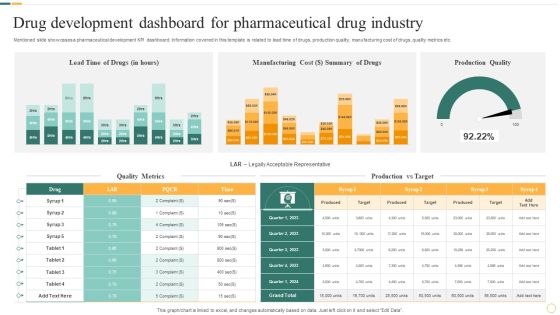
Drug Development Dashboard For Pharmaceutical Drug Industry Portrait PDF
Mentioned slide showcases a pharmaceutical development KPI dashboard. Information covered in this template is related to lead time of drugs, production quality, manufacturing cost of drugs, quality metrics etc. Showcasing this set of slides titled Drug Development Dashboard For Pharmaceutical Drug Industry Portrait PDF. The topics addressed in these templates are Manufacturing Cost, Summary Of Drugs, Production Quality. All the content presented in this PPT design is completely editable. Download it and make adjustments in color, background, font etc. as per your unique business setting.
Google Adwords Strategic Campaign Performance Tracking Dashboard Icons PDF
This slide showcases KPI dashboard for real time tracking of performance metrics for google adwords campaign. It includes elements such as cost interactions, impressions, device, etc. Showcasing this set of slides titled Google Adwords Strategic Campaign Performance Tracking Dashboard Icons PDF. The topics addressed in these templates are Campaign Performance Device, Interaction Rate Cost Device, Daily Cost Device. All the content presented in this PPT design is completely editable. Download it and make adjustments in color, background, font etc. as per your unique business setting.
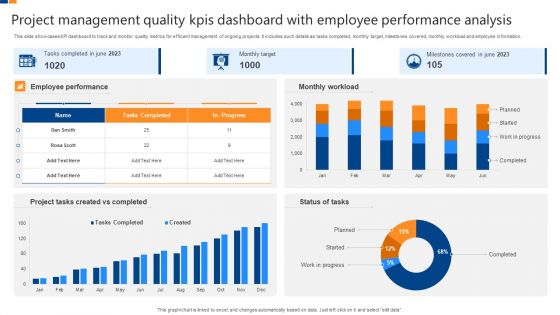
Project Management Quality Kpis Dashboard With Employee Performance Analysis Professional PDF
This slide showcases KPI dashboard to track and monitor quality metrics for efficient management of ongoing projects. It includes such details as tasks completed, monthly target, milestones covered, monthly workload and employee information. Showcasing this set of slides titled Project Management Quality Kpis Dashboard With Employee Performance Analysis Professional PDF. The topics addressed in these templates are Employee Performance, Monthly Workload, Milestones Covered, Monthly Target, Project Tasks Created Completed. All the content presented in this PPT design is completely editable. Download it and make adjustments in color, background, font etc. as per your unique business setting.
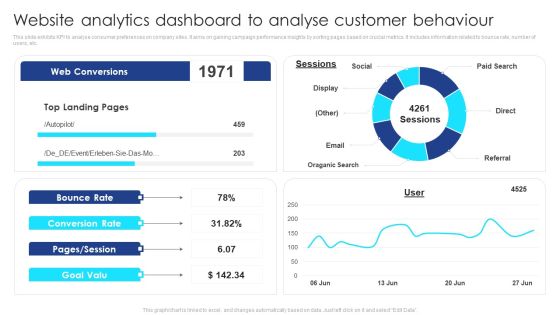
Website Analytics Dashboard To Analyse Customer Behaviour Themes PDF
This slide exhibits KPI to analyse consumer preferences on company sites. It aims on gaining campaign performance insights by sorting pages based on crucial metrics. It includes information related to bounce rate, number of users, etc. Showcasing this set of slides titled Website Analytics Dashboard To Analyse Customer Behaviour Themes PDF. The topics addressed in these templates are Social, Paid Search, Referral, Email, Oraganic Search. All the content presented in this PPT design is completely editable. Download it and make adjustments in color, background, font etc. as per your unique business setting.

Big Data In Health Industry Dashboard In Industry Summary PDF
The slide depicts patient KPI dashboard for healthcare which can be used to improve service levels as well as treatment across departments. It include metrics such as bed occupancy rate, patient turnover, satisfaction rate, missed and cancelled appointment rate. Showcasing this set of slides titled Big Data In Health Industry Dashboard In Industry Summary PDF. The topics addressed in these templates are Geriatrics, Gynecology, Internal Medicine. All the content presented in this PPT design is completely editable. Download it and make adjustments in color, background, font etc. as per your unique business setting.

Display Ad Campaigning Dashboard To Monitor Productivity Infographics PDF
This slide showcases KPI dashboard for display advertising for real- time tracking of key marketing metrices, It includes elements such as cost, clicks, impressions, CTR, conversion rate, CPC, etc. Showcasing this set of slides titled Display Ad Campaigning Dashboard To Monitor Productivity Infographics PDF. The topics addressed in these templates are Cost Per Conversion, Conversions, Ad Impressions. All the content presented in this PPT design is completely editable. Download it and make adjustments in color, background, font etc. as per your unique business setting.
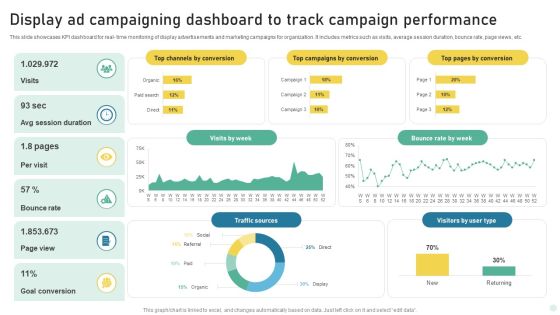
Display Ad Campaigning Dashboard To Track Campaign Performance Background PDF
This slide showcases KPI dashboard for real- time monitoring of display advertisements and marketing campaigns for organization. It includes metrics such as visits, average session duration, bounce rate, page views, etc. Showcasing this set of slides titled Display Ad Campaigning Dashboard To Track Campaign Performance Background PDF. The topics addressed in these templates are Traffic Sources, Bounce Rate, Goal Conversion. All the content presented in this PPT design is completely editable. Download it and make adjustments in color, background, font etc. as per your unique business setting.
Professional Scrum Master Training IT Risk Monitoring Dashboard For Software Development Projects Icons PDF
Following slide displays risk monitoring KPI dashboard that can be used by a firm to track multiple risk events. Metrics covered in the dashboard are residual risk by period and category by total risk rating. Deliver an awe inspiring pitch with this creative professional scrum master training it risk monitoring dashboard for software development projects icons pdf bundle. Topics like financial risk, people risk, governance risk, competitive risk, system or technology can be discussed with this completely editable template. It is available for immediate download depending on the needs and requirements of the user.
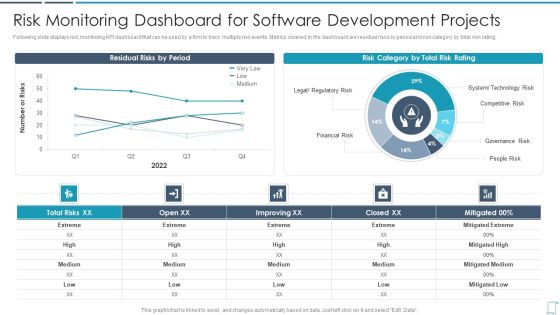
Professional Scrum Master Certification Training Program IT Risk Monitoring Dashboard Background PDF
Following slide displays risk monitoring KPI dashboard that can be used by a firm to track multiple risk events. Metrics covered in the dashboard are residual risks by period and risk category by total risk rating.Deliver an awe inspiring pitch with this creative professional scrum master certification training program it risk monitoring dashboard background pdf bundle. Topics like competitive risk, governance risk, people risk can be discussed with this completely editable template. It is available for immediate download depending on the needs and requirements of the user.
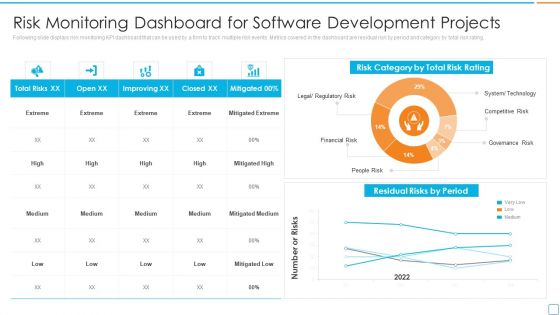
Professional Scrum Master Certification Risk Monitoring Dashboard For Software Development Portrait PDF
Following slide displays risk monitoring KPI dashboard that can be used by a firm to track multiple risk events. Metrics covered in the dashboard are residual risk by period and category by total risk rating. Deliver an awe inspiring pitch with this creative professional scrum master certification risk monitoring dashboard for software development portrait pdf bundle. Topics like residual risks by period, risk category, total risk rating can be discussed with this completely editable template. It is available for immediate download depending on the needs and requirements of the user.

Professional Scrum Master Risk Monitoring Dashboard For Software Development Projects Designs PDF
Following slide displays risk monitoring KPI dashboard that can be used by a firm to track multiple risk events. Metrics covered in the dashboard are residual risk by period and category by total risk rating. Deliver an awe inspiring pitch with this creative Professional Scrum Master Risk Monitoring Dashboard For Software Development Projects Designs PDF bundle. Topics like Residual Risks By Period, Risk Category By Total Risk Rating, Total Risks can be discussed with this completely editable template. It is available for immediate download depending on the needs and requirements of the user.
Online Customer Interaction Dashboard For Tracking Customer Service Team Performance Infographics PDF
This slide covers the KPI dashboard for analyzing the performance of client support department. It includes metrics such as first call resolution, unresolved calls, average response rate, the best day to call, average time to solve issues, etc. Deliver and pitch your topic in the best possible manner with this Online Customer Interaction Dashboard For Tracking Customer Service Team Performance Infographics PDF. Use them to share invaluable insights on Response Time, Issue Solving, Call Resolution and impress your audience. This template can be altered and modified as per your expectations. So, grab it now.
Online Customer Interaction Online Ad Campaign Performance Tracking Dashboard Demonstration PDF
This slide covers the KPI dashboard for measuring digital campaign results. It includes metrics such as Ad cost, clicks, impressions, CTR, cost per click, conversions, conversion rate, cost per click, cost per thousand impressions, etc. Deliver and pitch your topic in the best possible manner with this Online Customer Interaction Online Ad Campaign Performance Tracking Dashboard Demonstration PDF. Use them to share invaluable insights on Conversations, Impressions, Conversation Rate and impress your audience. This template can be altered and modified as per your expectations. So, grab it now.

Customer Relationship Management Software CRM Dashboard For Tracking Sales Pipeline Background PDF
This slide covers the CRM KPI dashboard for monitoring lead status in the sales funnel. It includes metrics such as open pipeline value, open pipeline by product package, pipeline value forecast, etc. Deliver and pitch your topic in the best possible manner with this Customer Relationship Management Software CRM Dashboard For Tracking Sales Pipeline Background PDF. Use them to share invaluable insights on Product Package, Pipeline Value, Value Forecast and impress your audience. This template can be altered and modified as per your expectations. So, grab it now.

CRM System Implementation Stages CRM Dashboard For Tracking Sales Pipeline Background PDF
This slide covers the CRM KPI dashboard for monitoring lead status in the sales funnel. It includes metrics such as open pipeline value, open pipeline by product package, pipeline value forecast, etc. Deliver and pitch your topic in the best possible manner with this CRM System Implementation Stages CRM Dashboard For Tracking Sales Pipeline Background PDF. Use them to share invaluable insights on Pipeline Value, Value Forecast, Sales Opportunities and impress your audience. This template can be altered and modified as per your expectations. So, grab it now.
 Home
Home