Kpi
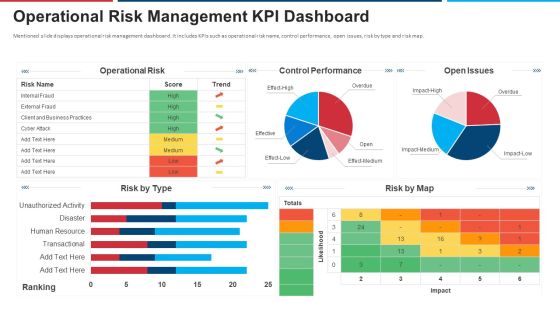
Mitigation Strategies For Operational Threat Operational Risk Management KPI Dashboard Ppt Slides Guide PDF
Mentioned slide displays operational risk management dashboard. It includes KPIs such as operational risk name, control performance, open issues, risk by type and risk map. Deliver an awe inspiring pitch with this creative mitigation strategies for operational threat operational risk management kpi dashboard ppt slides guide pdf bundle. Topics like operational risk, control performance, open issues, risk by map risk by type can be discussed with this completely editable template. It is available for immediate download depending on the needs and requirements of the user.
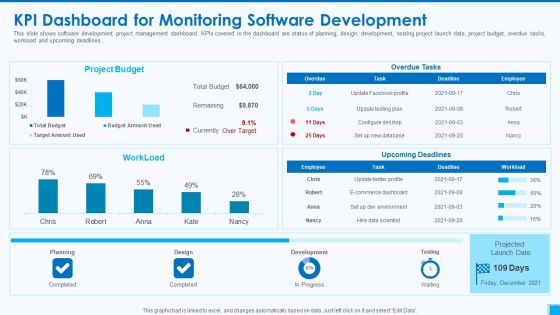
Devops Tools And Configuration IT Kpi Dashboard For Monitoring Software Development Slides PDF
This slide shows software development project management dashboard. KPIs covered in the dashboard are status of planning, design, development, testing project launch date, project budget, overdue tasks, workload and upcoming deadlines. Deliver and pitch your topic in the best possible manner with this devops tools and configuration it kpi dashboard for monitoring software development slides pdf. Use them to share invaluable insights on project budget, planning, design, development and impress your audience. This template can be altered and modified as per your expectations. So, grab it now.
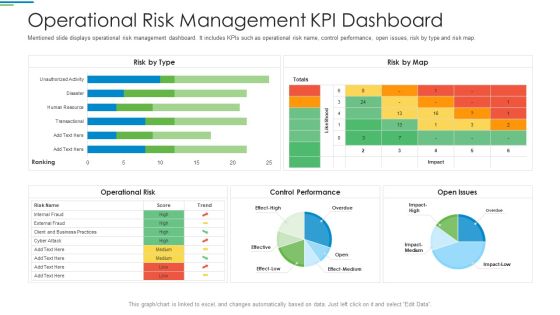
Operational Risk Management Structure In Financial Companies Operational Risk Management Kpi Dashboard Download PDF
Mentioned slide displays operational risk management dashboard. It includes KPIs such as operational risk name, control performance, open issues, risk by type and risk map. Deliver and pitch your topic in the best possible manner with this operational risk management structure in financial companies operational risk management kpi dashboard download pdf. Use them to share invaluable insights on operational risk name, control performance, open issues, risk by type and risk map and impress your audience. This template can be altered and modified as per your expectations. So, grab it now.

AI And ML Driving Monetary Value For Organization Customer Service Management Kpi Dashboard Formats PDF
Following slide illustrates customer service dashboard. It includes KPIs such as request answered, customer satisfaction, average time to solve an issue, costs per support and customer retention. Deliver and pitch your topic in the best possible manner with this ai and ml driving monetary value for organization customer service management kpi dashboard formats pdf. Use them to share invaluable insights on customer retention, cost per support, customer satisfaction, cost to revenue and impress your audience. This template can be altered and modified as per your expectations. So, grab it now.

AI And ML Driving Monetary Value For Organization KPI Dashboard To Monitor Business Performance Graphics PDF
Following slide shows business performance dashboard. It covers KPIs such as revenue generated, projected revenue, marketing expenses, satisfaction rate and tickets volume by priority. Deliver and pitch your topic in the best possible manner with this ai and ml driving monetary value for organization kpi dashboard to monitor business performance graphics pdf. Use them to share invaluable insights on business offerings, current impact, product innovations, customer service and impress your audience. This template can be altered and modified as per your expectations. So, grab it now.
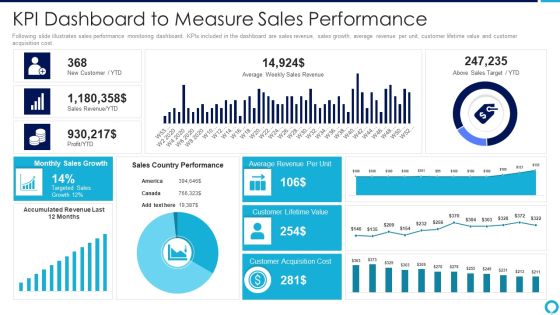
Partnership Management Strategies Kpi Dashboard To Measure Sales Performance Introduction PDF
Following slide illustrates sales performance monitoring dashboard. KPIs included in the dashboard are sales revenue, sales growth, average revenue per unit, customer lifetime value and customer acquisition cost.Deliver and pitch your topic in the best possible manner with this partnership management strategies kpi dashboard to measure sales performance introduction pdf Use them to share invaluable insights on average revenue, monthly sales growth, customer acquisition cost and impress your audience. This template can be altered and modified as per your expectations. So, grab it now.

Sustainability Calculation With KPI Cash Flow Dashboard Liquidity Ratio Inspiration PDF Introduction PDF
Following slide covers cash flow dashboard covering details like beginning cash on hand, cash going in, cash going out, profit loss and ending cash on hand. It also includes detail of accounts receivable and payable. Deliver an awe inspiring pitch with this creative sustainability calculation with kpi cash flow dashboard cash designs pdf bundle. Topics like beginning cash on hand, cash going out, profit and loss, ending cash on hand can be discussed with this completely editable template. It is available for immediate download depending on the needs and requirements of the user.

Sustainability Calculation With KPI Customer Service Dashboard Revenue Ideas PDF Graphics PDF
Following slide illustrates customer service dashboard covering details such as request answered, total requests, total revenue and support cost revenue. It also includes customer satisfaction score, customer retention in a 12 months format. Deliver and pitch your topic in the best possible manner with this sustainability calculation with kpi customer service dashboard microsoft pdf. Use them to share invaluable insights on customer satisfaction, revenue, customer retention and impress your audience. This template can be altered and modified as per your expectations. So, grab it now.

Sustainability Calculation With KPI Employee Billable Hours Dashboard Demonstration PDF Portrait PDF
Following slide shows employee billable hours dashboard covering total hours capacity, allocated hours billable, total hours worked, and total billable hours worked for the assignment. It also includes details of each team member indulged for same assignment. Deliver an awe inspiring pitch with this creative sustainability calculation with kpi employee billable hours dashboard demonstration pdf bundle. Topics like employee billable hours dashboard can be discussed with this completely editable template. It is available for immediate download depending on the needs and requirements of the user.

Sustainability Calculation With KPI Employee Engagement And Company Culture Sample PDF Topics PDF
Following slide shows employee engagement and company culture dashboard. It includes employee details, engagement score, total given recognition, previous seven days performance and radar chart to measure employee performance. Deliver and pitch your topic in the best possible manner with this sustainability calculation with kpi employee engagement and company culture sample pdf. Use them to share invaluable insights on employee engagement and company culture dashboard and impress your audience. This template can be altered and modified as per your expectations. So, grab it now.
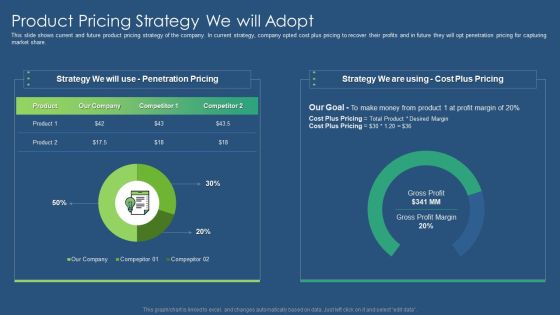
Sustainability Calculation With KPI Product Pricing Strategy We Will Adopt Information PDF Diagrams PDF
This slide shows current and future product pricing strategy of the company. In current strategy, company opted cost plus pricing to recover their profits and in future they will opt penetration pricing for capturing market share. Deliver an awe inspiring pitch with this creative sustainability calculation with kpi product pricing strategy we will adopt information pdf bundle. Topics like gross profit margin, cost plus pricing, penetration pricing can be discussed with this completely editable template. It is available for immediate download depending on the needs and requirements of the user.
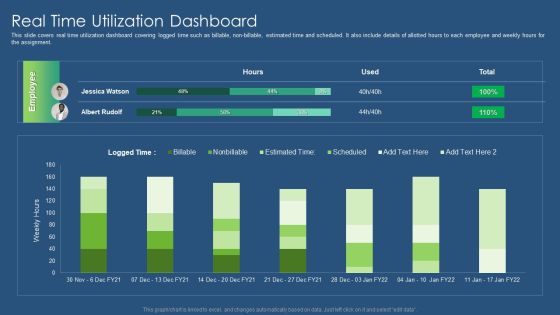
Sustainability Calculation With KPI Real Time Utilization Dashboard Inspiration PDF Information PDF
This slide covers real time utilization dashboard covering logged time such as billable, non billable, estimated time and scheduled. It also include details of allotted hours to each employee and weekly hours for the assignment. Deliver and pitch your topic in the best possible manner with this sustainability calculation with kpi real time utilization dashboard inspiration pdf. Use them to share invaluable insights on real time utilization dashboard and impress your audience. This template can be altered and modified as per your expectations. So, grab it now.
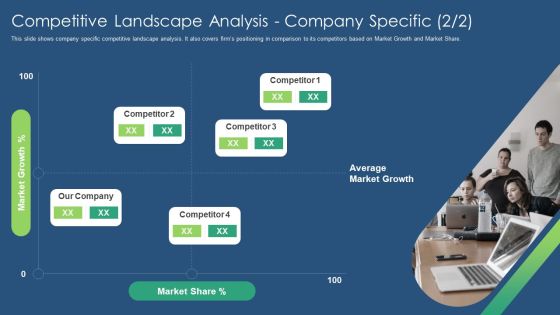
Sustainability Calculation With KPI Competitive Landscape Analysis Company Ppt PowerPoint Presentation File Deck PDF
This slide shows company specific competitive landscape analysis. It also covers firms positioning in comparison to its competitors based on Market Growth and Market Share. This is a sustainability calculation with kpi competitive landscape analysis company ppt powerpoint presentation file deck pdf template with various stages. Focus and dispense information on one stages using this creative set, that comes with editable features. It contains large content boxes to add your information on topics like market growth, market share, competitor. You can also showcase facts, figures, and other relevant content using this PPT layout. Grab it now.

Sustainability Calculation With KPI Domestic Presence Of The Company Ppt PowerPoint Presentation File Introduction PDF
This slide illustrates domestic presence of the firm. It also covers details of the manufacturing plant and sales office located at different locations. This is a sustainability calculation with kpi domestic presence of the company ppt powerpoint presentation file introduction pdf template with various stages. Focus and dispense information on one stages using this creative set, that comes with editable features. It contains large content boxes to add your information on topics like domestic presence of the company. You can also showcase facts, figures, and other relevant content using this PPT layout. Grab it now.
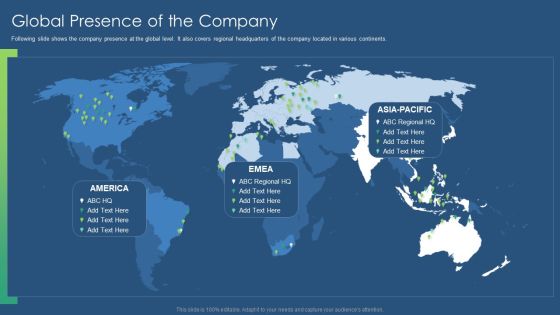
Sustainability Calculation With KPI Global Presence Of The Company Ppt PowerPoint Presentation Gallery Guide PDF
Following slide shows the company presence at the global level. It also covers regional headquarters of the company located in various continents. This is a sustainability calculation with kpi global presence of the company ppt powerpoint presentation gallery guide pdf template with various stages. Focus and dispense information on one stages using this creative set, that comes with editable features. It contains large content boxes to add your information on topics like global presence of the company. You can also showcase facts, figures, and other relevant content using this PPT layout. Grab it now.
Sustainability Calculation With KPI Long Term Goals Of The Company Ppt PowerPoint Presentation Gallery Icon PDF
This slide shows long term goals set by the firm. Goals covered are to enlist the company fortune 500, to acquire product market share in US alone and to become top FMCG company in North America. Presenting sustainability calculation with kpi long term goals of the company ppt powerpoint presentation gallery icon pdf to provide visual cues and insights. Share and navigate important information on five stages that need your due attention. This template can be used to pitch topics like long term goals of the company. In addtion, this PPT design contains high resolution images, graphics, etc, that are easily editable and available for immediate download.
Sustainability Calculation With KPI Milestones Achieved In Fy20 Ppt PowerPoint Presentation Icon Slides PDF
This slide demonstrates monthly milestones achieved by the company in 2020 financial year. It also includes that company listed its name in fortune 1000 list of companies. This is a sustainability calculation with kpi milestones achieved in fy20 ppt powerpoint presentation icon slides pdf template with various stages. Focus and dispense information on twelve stages using this creative set, that comes with editable features. It contains large content boxes to add your information on topics like milestones achieved in fy20. You can also showcase facts, figures, and other relevant content using this PPT layout. Grab it now.
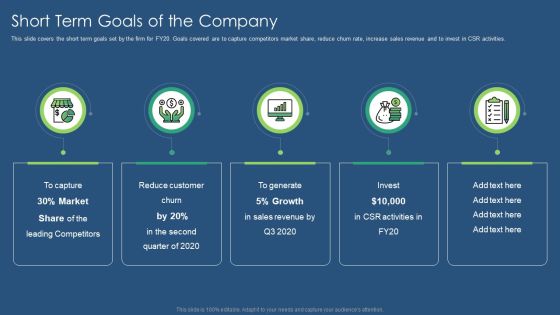
Sustainability Calculation With KPI Short Term Goals Of The Company Ppt PowerPoint Presentation File Rules PDF
This slide covers the short term goals set by the firm for FY20. Goals covered are to capture competitors market share, reduce churn rate, increase sales revenue and to invest in CSR activities. Presenting sustainability calculation with kpi short term goals of the company ppt powerpoint presentation file rules pdf to provide visual cues and insights. Share and navigate important information on five stages that need your due attention. This template can be used to pitch topics like short term goals of the company. In addtion, this PPT design contains high resolution images, graphics, etc, that are easily editable and available for immediate download.

Quality Assurance Procedure In Agile Project Quality Control Kpi Dashboard Clipart PDF
This slide shows the quality control dashboard to monitor the effectiveness of agile quality assurance model. It includes KPIs namely test execution summary, defect severity distribution, module wise text execution and defect severity index. Deliver an awe inspiring pitch with this creative quality assurance procedure in agile project quality control kpi dashboard clipart pdf bundle. Topics like modules wise test execution summary, defect severity distribution, defect severity index can be discussed with this completely editable template. It is available for immediate download depending on the needs and requirements of the user.
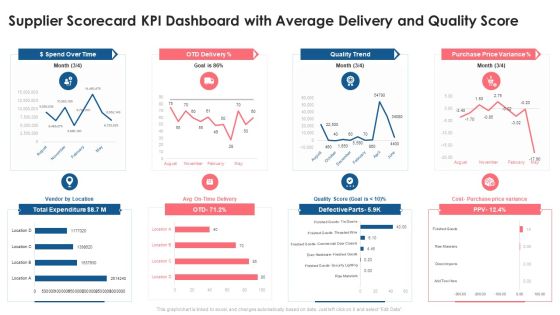
Supplier Scorecard Supplier Scorecard KPI Dashboard With Average Delivery And Quality Score Introduction PDF
This graph or chart is linked to excel, and changes automatically based on data. Just left click on it and select Edit Data. Deliver an awe inspiring pitch with this creative supplier scorecard supplier scorecard kpi dashboard with average delivery and quality score introduction pdf bundle. Topics like dollar spend over time, otd delivery, quality trend, purchase price variance, total expenditure can be discussed with this completely editable template. It is available for immediate download depending on the needs and requirements of the user.

Client Achievements Playbook Customer Success KPI Dashboard To Measure Support Brochure PDF
Mentioned slide showcases customer success dashboard that company is currently using to measure its support team performance. KPIs covered in the dashboard are health score, retention cost, churn rate etc. Deliver an awe inspiring pitch with this creative client achievements playbook customer success kpi dashboard to measure support brochure pdf bundle. Topics like customer retention cost, current health score, customer churn rate, customer accounts, customer health can be discussed with this completely editable template. It is available for immediate download depending on the needs and requirements of the user.
Guide For Software Developers KPI Dashboard For Tracking Project Team Performance Guidelines PDF
Following slide illustrates performance monitoring dashboard that can be used by managers to track their developers team efficiency. It also includes details about billable and non-billable hours along with task summary. Deliver an awe inspiring pitch with this creative guide for software developers kpi dashboard for tracking project team performance guidelines pdf bundle. Topics like task milestone, employee productivity, estimated time, actual time can be discussed with this completely editable template. It is available for immediate download depending on the needs and requirements of the user.
Software Developer Playbook Kpi Dashboard For Tracking Project Team Performance Guidelines PDF
Following slide illustrates performance monitoring dashboard that can be used by managers to track their developers team efficiency. It also includes details about billable and non-billable hours along with task summary. Deliver an awe inspiring pitch with this creative software developer playbook kpi dashboard for tracking project team performance guidelines pdf bundle. Topics like task milestone, employee productivity, estimated time, actual time can be discussed with this completely editable template. It is available for immediate download depending on the needs and requirements of the user.
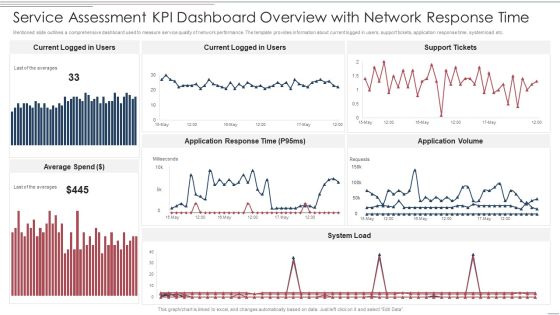
Service Assessment Kpi Dashboard Overview With Network Response Time Themes PDF
Mentioned slide outlines a comprehensive dashboard used to measure service quality of network performance. The template provides information about current logged in users, support tickets, application response time, system load etc. Pitch your topic with ease and precision using this Service Assessment Kpi Dashboard Overview With Network Response Time Themes PDF. This layout presents information on Average Spend, System Load, Application Response Time. It is also available for immediate download and adjustment. So, changes can be made in the color, design, graphics or any other component to create a unique layout.

Investing In Tech Innovation Performance Measurement Kpi Dashboard For Fintech Firm Mockup PDF
Following slide portrays performance measurement dashboard for FinTech companies with KPIs namely available cash, cash flow, ROA, working capital ratio, days sales outstanding and days payable outstanding. Deliver and pitch your topic in the best possible manner with this Investing In Tech Innovation Performance Measurement Kpi Dashboard For Fintech Firm Mockup PDF. Use them to share invaluable insights on Available Cash, Cash Flow, Return on Assets, Working Capital Ratio and impress your audience. This template can be altered and modified as per your expectations. So, grab it now.

Maintaining Partner Relationships KPI Dashboard To Measure Sales Performance Rules PDF
Following slide illustrates sales performance monitoring dashboard. KPIs included in the dashboard are sales revenue, sales growth, average revenue per unit, customer lifetime value and customer acquisition cost. Deliver and pitch your topic in the best possible manner with this Maintaining Partner Relationships KPI Dashboard To Measure Sales Performance Rules PDF. Use them to share invaluable insights on Sales Country Performance, Above Sales Target, YTD, Customer Lifetime Value, Customer Acquisition Cost and impress your audience. This template can be altered and modified as per your expectations. So, grab it now.

KPI To Measure Inbound And Outbound Marketing Campaign Performance Demonstration PDF
The following slide displays Various KPIs which can be used by marketing manager to measure inbound and outbound campaign performance. The KPIs mentioned in the template are email open rate, page views, lead conversion rate, revenue generated etc. Presenting KPI To Measure Inbound And Outbound Marketing Campaign Performance Demonstration PDF to dispense important information. This template comprises two stages. It also presents valuable insights into the topics including Revenue Generated, Conversion Rate, Average Session. This is a completely customizable PowerPoint theme that can be put to use immediately. So, download it and address the topic impactfully.
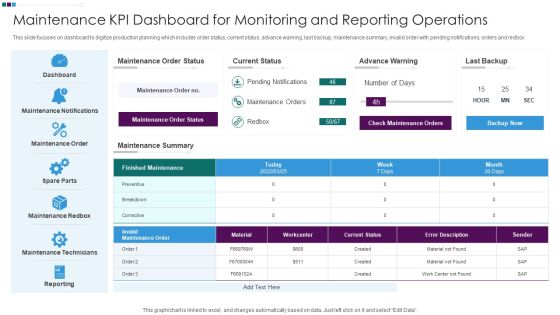
Maintenance KPI Dashboard For Monitoring And Reporting Operations Ppt Model Guide PDF
This slide focuses on dashboard to digitize production planning which includes order status, current status, advance warning, last backup, maintenance summary, invalid order with pending notifications, orders and redbox. Showcasing this set of slides titled Maintenance KPI Dashboard For Monitoring And Reporting Operations Ppt Model Guide PDF. The topics addressed in these templates are Maintenance Order Status, Dashboard Maintenance Notifications, Maintenance Order Status. All the content presented in this PPT design is completely editable. Download it and make adjustments in color, background, font etc. as per your unique business setting.

Maintenance KPI Dashboard Of Service Companies Ppt Outline Graphics Design PDF
This slide focuses on maintenance dashboard which includes total assets, evolution, relevant assets, reports status, alert faults, asset status with good, satisfied, unsatisfied, inaccurate , overdue, completed and in-progress. Pitch your topic with ease and precision using this Maintenance KPI Dashboard Of Service Companies Ppt Outline Graphics Design PDF. This layout presents information on Assent Status Current, Reports Status 2023, Asset Status Evolution. It is also available for immediate download and adjustment. So, changes can be made in the color, design, graphics or any other component to create a unique layout.
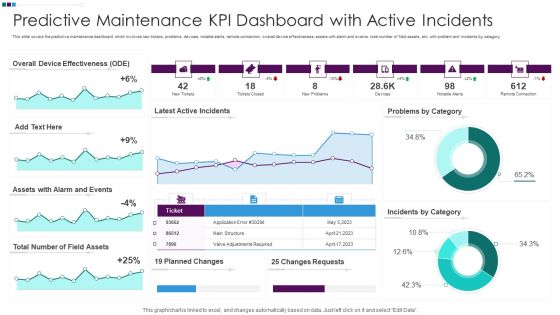
Predictive Maintenance KPI Dashboard With Active Incidents Ppt Slides Backgrounds PDF
This slide covers the predictive maintenance dashboard which involves new tickets, problems, devices, notable alerts, remote connection, overall device effectiveness, assets with alarm and events, total number of field assets, etc. with problem and incidents by category. Showcasing this set of slides titled Predictive Maintenance KPI Dashboard With Active Incidents Ppt Slides Backgrounds PDF. The topics addressed in these templates are Overall Device Effectiveness, Assets Alarm Events, Total Number Field. All the content presented in this PPT design is completely editable. Download it and make adjustments in color, background, font etc. as per your unique business setting.
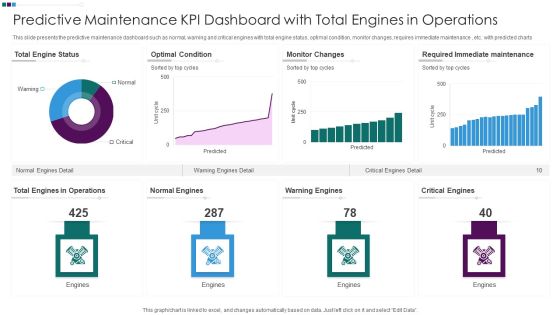
Predictive Maintenance KPI Dashboard With Total Engines In Operations Ppt Professional Inspiration PDF
This slide presents the predictive maintenance dashboard such as normal, warning and critical engines with total engine status, optimal condition, monitor changes, requires immediate maintenance , etc. with predicted charts. Pitch your topic with ease and precision using this Predictive Maintenance KPI Dashboard With Total Engines In Operations Ppt Professional Inspiration PDF. This layout presents information on Total Engine Status, Optimal Condition Monitor, Changes Warning Engines, Required Immediate Maintenance. It is also available for immediate download and adjustment. So, changes can be made in the color, design, graphics or any other component to create a unique layout.

Workforce Management Strategies For Effective Hiring Process Kpi Dashboard To Measure Talent Performance Formats PDF
This slide represents dashboard to measure talent performance in organization. It includes talent applicant status, team training methods, talented candidate status, risk for loss of potential talent pool etc. Deliver an awe inspiring pitch with this creative Workforce Management Strategies For Effective Hiring Process Kpi Dashboard To Measure Talent Performance Formats PDF bundle. Topics like Potential Candidate, Talent Performance, Learning Platform can be discussed with this completely editable template. It is available for immediate download depending on the needs and requirements of the user.

KPI Dashboard Highlighting Automation Results In Supply Chain Management Rules PDF
The following slide outlines a comprehensive dashboard depicting the business process automation BPA results in the supply chain. Information covered in the slide is related to average order processing days, average shipping days, etc. Deliver and pitch your topic in the best possible manner with this KPI Dashboard Highlighting Automation Results In Supply Chain Management Rules PDF. Use them to share invaluable insights on Average Order Fulfillment Days, Average Shipping Days, Average Order Processing Days and impress your audience. This template can be altered and modified as per your expectations. So, grab it now.
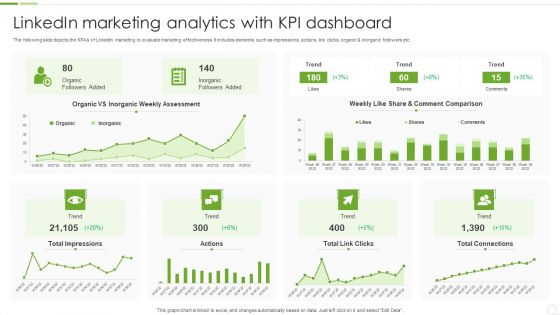
Linkedin Marketing Analytics With KPI Dashboard Ppt PowerPoint Presentation File Inspiration PDF
The following slide depicts the KPAs of LinkedIn marketing to evaluate marketing effectiveness. It includes elements such as impressions, actions, link clicks, organic and inorganic followers etc. Showcasing this set of slides titled Linkedin Marketing Analytics With KPI Dashboard Ppt PowerPoint Presentation File Inspiration PDF. The topics addressed in these templates are Total Impressions, Total Connections, Inorganic Followers Added. All the content presented in this PPT design is completely editable. Download it and make adjustments in color, background, font etc. as per your unique business setting.
Saas Cloud Security Analysis With KPI Dashboard Ppt PowerPoint Presentation Icon Slides PDF
The following slide highlights the assessment of Software as a security to meet safety standards. It includes key elements such as critical incidents, risk analysis, number of open tasks etc. Pitch your topic with ease and precision using this Saas Cloud Security Analysis With KPI Dashboard Ppt PowerPoint Presentation Icon Slides PDF. This layout presents information on Quarterly Incident Severity, Incident Risk Analysis, Critical Incidents. It is also available for immediate download and adjustment. So, changes can be made in the color, design, graphics or any other component to create a unique layout.

Firm KPI Dashboard With Average Click Through Rate Ppt Inspiration Sample PDF
This graph or chart is linked to excel, and changes automatically based on data. Just left click on it and select Edit Data. Pitch your topic with ease and precision using this Firm KPI Dashboard With Average Click Through Rate Ppt Inspiration Sample PDF. This layout presents information on Total Clicks, Total Impressive, Average CTR, Average Position. It is also available for immediate download and adjustment. So, changes can be made in the color, design, graphics or any other component to create a unique layout.

Firm KPI Dashboard With Schedule Performance Index Ppt Visual Aids PDF
This graph or chart is linked to excel, and changes automatically based on data. Just left click on it and select Edit Data. Pitch your topic with ease and precision using this Firm KPI Dashboard With Schedule Performance Index Ppt Visual Aids PDF. This layout presents information on Project Cost Performance, Project Planning Stage, Monitor And Control. It is also available for immediate download and adjustment. So, changes can be made in the color, design, graphics or any other component to create a unique layout.

KPI Dashboard Of Workforce Performance In Organization Ppt Gallery Portfolio PDF
This slide shows the performance of employees in an organization. It includes KPIs such as headcount, average employee age, gender diversity ratio, absenteeism, etc. Showcasing this set of slides titled KPI Dashboard Of Workforce Performance In Organization Ppt Gallery Portfolio PDF. The topics addressed in these templates are Employee Count Status, Employee Count Department, Average Employee Age. All the content presented in this PPT design is completely editable. Download it and make adjustments in color, background, font etc. as per your unique business setting.

Dashboard Of Shipment Logistics KPI With Operating Cost Ppt Styles Example Topics PDF
The following slide highlights dashboard of shipment transportation with operating cost illustrating transportation operating cost, monthly order completion rate, operating cost distribution, order completion trend, transportation by destination and transportation efficiency. Showcasing this set of slides titled Dashboard Of Shipment Logistics KPI With Operating Cost Ppt Styles Example Topics PDF. The topics addressed in these templates are Transportation Operating Cost, Monthly Order, Completion Rate, Operating Cost Distribution. All the content presented in this PPT design is completely editable. Download it and make adjustments in color, background, font etc. as per your unique business setting.
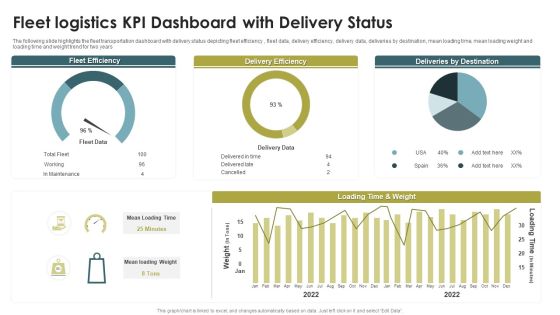
Fleet Logistics KPI Dashboard With Delivery Status Ppt Model Guide PDF
The following slide highlights the fleet transportation dashboard with delivery status depicting fleet efficiency , fleet data, delivery efficiency, delivery data, deliveries by destination, mean loading time, mean loading weight and loading time and weight trend for two years. Pitch your topic with ease and precision using this Fleet Logistics KPI Dashboard With Delivery Status Ppt Model Guide PDF. This layout presents information on Fleet Efficiency, Delivery Efficiency, Deliveries By Destination. It is also available for immediate download and adjustment. So, changes can be made in the color, design, graphics or any other component to create a unique layout.
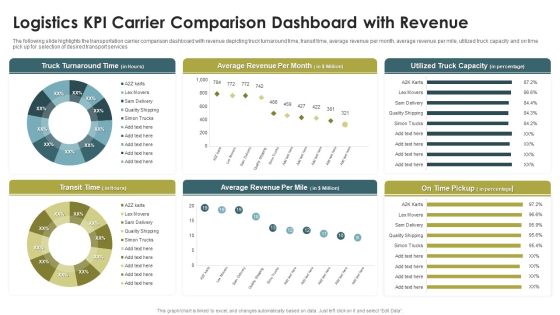
Logistics KPI Carrier Comparison Dashboard With Revenue Ppt Infographics Portfolio PDF
The following slide highlights the transportation carrier comparison dashboard with revenue depicting truck turnaround time, transit time, average revenue per month, average revenue per mile, utilized truck capacity and on time pick up for selection of desired transport services. Pitch your topic with ease and precision using this Logistics KPI Carrier Comparison Dashboard With Revenue Ppt Infographics Portfolio PDF. This layout presents information on Truck Turnaround Time, Average Revenue, Per Month, Transit Time. It is also available for immediate download and adjustment. So, changes can be made in the color, design, graphics or any other component to create a unique layout.
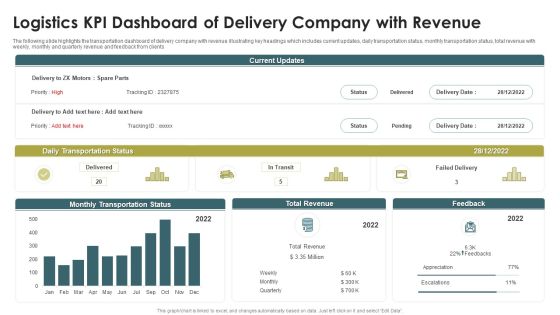
Logistics KPI Dashboard Of Delivery Company With Revenue Ppt Show PDF
The following slide highlights the transportation dashboard of delivery company with revenue illustrating key headings which includes current updates, daily transportation status, monthly transportation status, total revenue with weekly, monthly and quarterly revenue and feedback from clients. Showcasing this set of slides titled Logistics KPI Dashboard Of Delivery Company With Revenue Ppt Show PDF. The topics addressed in these templates are Daily Transportation Status, Monthly Transportation Status, Total Revenue. All the content presented in this PPT design is completely editable. Download it and make adjustments in color, background, font etc. as per your unique business setting.

Logistics KPI Reporting And Analytics Dashboard Ppt Infographic Template Background PDF
The following slide highlights the transportation reporting and analytics dashboard illustrating total order on time pick up, on time delivery, delivery efficiency, shipment lead time, carrier details and address specific pick up, delivery and transit time reports. Presenting Logistics KPI Reporting And Analytics Dashboard Ppt Infographic Template Background PDF to dispense important information. This template comprises one stages. It also presents valuable insights into the topics including On Time Delivery, Total Order, Origin Locations. This is a completely customizable PowerPoint theme that can be put to use immediately. So, download it and address the topic impactfully.

Dashboard For International Logistics KPI Via Third Party Carriers Rules PDF
The following slide highlights the dashboard for international transportation via third party carriers illustrating total shipment, payment method, revenue, shipment status and shipment details such as company, tracking id, Item, weight, address, payment, status to monitor the transportation. Showcasing this set of slides titled Dashboard For International Logistics KPI Via Third Party Carriers Rules PDF. The topics addressed in these templates are Total Shipment, Payment Method, Revenue, 20. All the content presented in this PPT design is completely editable. Download it and make adjustments in color, background, font etc. as per your unique business setting.

Dashboard For Logistics KPI Management System Of Logistics Company Infographics PDF
The following slide highlights the dashboard for transportation management system of logistics company illustrating shipment status of 30 days, shipment by carrier, on time shipment, average shipment cost, carrier efficiency and shipment count. Pitch your topic with ease and precision using this Dashboard For Logistics KPI Management System Of Logistics Company Infographics PDF. This layout presents information on Shipment Status, Shipment By Carrier, On Time Shipment. It is also available for immediate download and adjustment. So, changes can be made in the color, design, graphics or any other component to create a unique layout.
Market Insights Research Results With KPI Dashboard Ppt PowerPoint Presentation Icon File Formats PDF
The given below slide highlights the KPAs of market research associated with customer satisfaction. It includes net promoter score, customer effort score, monthly NPS and CES trend etc.Pitch your topic with ease and precision using this Market Insights Research Results With KPI Dashboard Ppt PowerPoint Presentation Icon File Formats PDF. This layout presents information on Satisfaction Score, Customer Effort, Customer Score. It is also available for immediate download and adjustment. So, changes can be made in the color, design, graphics or any other component to create a unique layout.
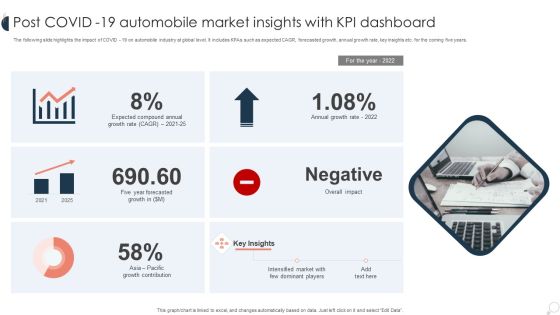
Post COVID 19 Automobile Market Insights With KPI Dashboard Ppt PowerPoint Presentation Slides Background Images PDF
The following slide highlights the impact of COVID 19 on automobile industry at global level. It includes KPAs such as expected CAGR, forecasted growth, annual growth rate, key insights etc. for the coming five years. Showcasing this set of slides titled Post COVID 19 Automobile Market Insights With KPI Dashboard Ppt PowerPoint Presentation Slides Background Images PDF. The topics addressed in these templates are Expected Compound, Annual Growth, Overall Impact. All the content presented in this PPT design is completely editable. Download it and make adjustments in color, background, font etc. as per your unique business setting.

Guide To Client Success Customer Success KPI Dashboard To Measure Support Team Performance Topics PDF
Mentioned slide showcases customer success dashboard that company is currently using to measure its support team performance. Kpis covered in the dashboard are health score, retention cost, churn rate etc. Deliver an awe inspiring pitch with this creative Guide To Client Success Customer Success KPI Dashboard To Measure Support Team Performance Topics PDF bundle. Topics like Customer Churn Rate, Customer Retention Cost, Revenue can be discussed with this completely editable template. It is available for immediate download depending on the needs and requirements of the user.
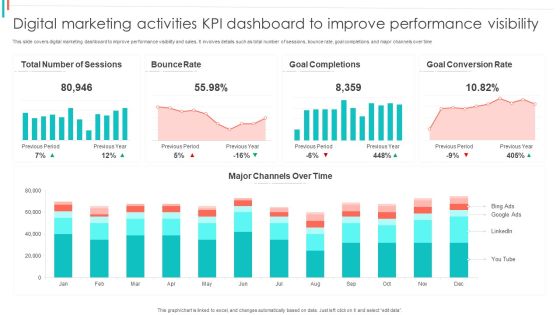
Digital Marketing Activities KPI Dashboard To Improve Performance Visibility Summary PDF
This slide covers digital marketing dashboard to improve performance visibility and sales. It involves details such as total number of sessions, bounce rate, goal completions and major channels over time.Showcasing this set of slides titled Digital Marketing Activities KPI Dashboard To Improve Performance Visibility Summary PDF. The topics addressed in these templates are Bounce Rate, Goal Completions, Goal Conversion. All the content presented in this PPT design is completely editable. Download it and make adjustments in color, background, font etc. as per your unique business setting.

Product KPI Key Attributes Scorecard Based On Customer Feedback Report Ideas PDF
This slide covers scorecard for various product attributes based on customer surveys. It includes packaging, resource sustainability, product performance, design , quality, quantity, etc. Pitch your topic with ease and precision using this Product KPI Key Attributes Scorecard Based On Customer Feedback Report Ideas PDF. This layout presents information on Product Design, Product Performance, Resource Sustainability. It is also available for immediate download and adjustment. So, changes can be made in the color, design, graphics or any other component to create a unique layout.

Service Level Agreement KPI Dashboard Indicating Violation Count And Overdue Requests Diagrams PDF
This graph or chart is linked to excel, and changes automatically based on data. Just left click on it and select Edit Data. Showcasing this set of slides titled Service Level Agreement KPI Dashboard Indicating Violation Count And Overdue Requests Diagrams PDF. The topics addressed in these templates are Total Requests Category, Total Requests Status, Urgent Requests. All the content presented in this PPT design is completely editable. Download it and make adjustments in color, background, font etc. as per your unique business setting.

Service Level Agreement KPI Dashboard With Current Risk Statistics Topics PDF
This graph or chart is linked to excel, and changes automatically based on data. Just left click on it and select Edit Data. Pitch your topic with ease and precision using this Service Level Agreement KPI Dashboard With Current Risk Statistics Topics PDF. This layout presents information on Current Risk SLAS, Current Breached Slas, Personal Active SLA It is also available for immediate download and adjustment. So, changes can be made in the color, design, graphics or any other component to create a unique layout.
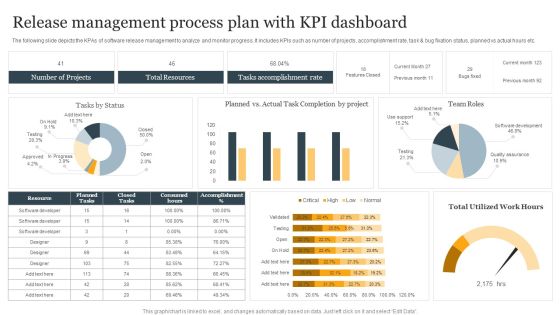
Release Management Process Plan With KPI Dashboard Ppt Infographic Template Structure PDF
The following slide depicts the KPAs of software release management to analyze and monitor progress. It includes KPIs such as number of projects, accomplishment rate, task and bug fixation status, planned vs actual hours etc. Showcasing this set of slides titled Release Management Process Plan With KPI Dashboard Ppt Infographic Template Structure PDF. The topics addressed in these templates are Number Of Projects, Total Resources, Tasks Accomplishment Rate. All the content presented in this PPT design is completely editable. Download it and make adjustments in color, background, font etc. as per your unique business setting.
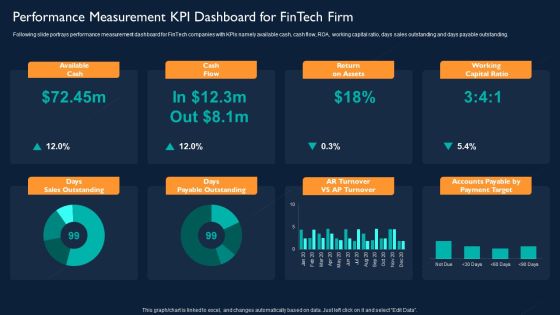
Technology Investment To Enhance Business Growth Performance Measurement KPI Dashboard For Fintech Firm Slides PDF
Following slide portrays performance measurement dashboard for FinTech companies with KPIs namely available cash, cash flow, ROA, working capital ratio, days sales outstanding and days payable outstanding. Deliver an awe inspiring pitch with this creative Technology Investment To Enhance Business Growth Performance Measurement KPI Dashboard For Fintech Firm Slides PDF bundle. Topics like Available Cash, Cash Flow, Return On Assets, Working Capital Ratio can be discussed with this completely editable template. It is available for immediate download depending on the needs and requirements of the user.
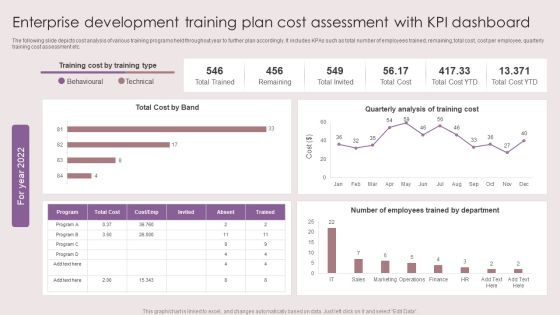
Enterprise Development Training Plan Cost Assessment With KPI Dashboard Mockup PDF
The following slide depicts cost analysis of various training programs held throughout year to further plan accordingly. It includes KPAs such as total number of employees trained, remaining, total cost, cost per employee, quarterly training cost assessment etc. Showcasing this set of slides titled Enterprise Development Training Plan Cost Assessment With KPI Dashboard Mockup PDF. The topics addressed in these templates are Total Cost Band, Quarterly Analysis, Training Cost. All the content presented in this PPT design is completely editable. Download it and make adjustments in color, background, font etc. as per your unique business setting.

Domestic Presence Of The Company Company Performance Evaluation Using KPI Demonstration PDF
This slide illustrates domestic presence of the firm. It also covers details of the manufacturing plant and sales office located at different locations. This is a Domestic Presence Of The Company Company Performance Evaluation Using KPI Demonstration PDF template with various stages. Focus and dispense information on one stage using this creative set, that comes with editable features. It contains large content boxes to add your information on topics like Domestic Presence, Company. You can also showcase facts, figures, and other relevant content using this PPT layout. Grab it now.

Employee Billable Hours Dashboard Company Performance Evaluation Using KPI Topics PDF
Following slide shows employee billable hours dashboard covering total hours capacity, allocated hours billable, total hours worked, and total billable hours worked for the assignment. It also includes details of each team member indulged for same assignment. Deliver and pitch your topic in the best possible manner with this Employee Billable Hours Dashboard Company Performance Evaluation Using KPI Topics PDF. Use them to share invaluable insights on Employee Billable, Hours Dashboard, Budgeted Billings and impress your audience. This template can be altered and modified as per your expectations. So, grab it now.

Global Presence Of The Company Company Performance Evaluation Using KPI Graphics PDF
Following slide shows the company presence at the global level. It also covers regional headquarters of the company located in various continents. Presenting Global Presence Of The Company Company Performance Evaluation Using KPI Graphics PDF to provide visual cues and insights. Share and navigate important information on one stage that need your due attention. This template can be used to pitch topics like Global Presence, The Company. In addtion, this PPT design contains high resolution images, graphics, etc, that are easily editable and available for immediate download.

Milestones Achieved In FY22 Company Performance Evaluation Using KPI Icons PDF
This slide demonstrates monthly milestones achieved by the company in 2022 financial year. It also includes that company listed its name in fortune 1000 list of companies. Presenting Milestones Achieved In FY22 Company Performance Evaluation Using KPI Icons PDF to provide visual cues and insights. Share and navigate important information on twelve stages that need your due attention. This template can be used to pitch topics like Company, Milestones Achieved, New Product. In addtion, this PPT design contains high resolution images, graphics, etc, that are easily editable and available for immediate download.
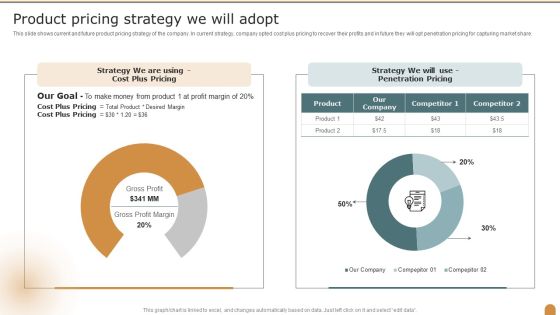
Product Pricing Strategy We Will Adopt Company Performance Evaluation Using KPI Slides PDF
This slide shows current and future product pricing strategy of the company. In current strategy, company opted cost plus pricing to recover their profits and in future they will opt penetration pricing for capturing market share. Deliver an awe inspiring pitch with this creative Product Pricing Strategy We Will Adopt Company Performance Evaluation Using KPI Slides PDF bundle. Topics like Strategy, Penetration Pricing, Our Company can be discussed with this completely editable template. It is available for immediate download depending on the needs and requirements of the user.
 Home
Home