Kpi Summary

Online Marketing Analytics To Enhance Business Growth Analyzing Quality Scores To Determine Relevance Introduction PDF
This slide covers a brief introduction to quality score KPI along with improvement strategies such as using ad group and keyword structure, writing relevant and compelling ad copies, using ad formats and dynamic headlines Want to ace your presentation in front of a live audience Our Online Marketing Analytics To Enhance Business Growth Analyzing Quality Scores To Determine Relevance Introduction PDF can help you do that by engaging all the users towards you. Slidegeeks experts have put their efforts and expertise into creating these impeccable powerpoint presentations so that you can communicate your ideas clearly. Moreover, all the templates are customizable, and easy to edit and downloadable. Use these for both personal and commercial use.

ATS Administration To Improve Asset Management Dashboard To Track System Guidelines PDF
This slide covers KPI dashboard to track system performance. It involves detail such as total number of assets, value of assets and purchases in fiscal year. Get a simple yet stunning designed ATS Administration To Improve Asset Management Dashboard To Track System Guidelines PDF. It is the best one to establish the tone in your meetings. It is an excellent way to make your presentations highly effective. So, download this PPT today from Slidegeeks and see the positive impacts. Our easy-to-edit ATS Administration To Improve Asset Management Dashboard To Track System Guidelines PDF can be your go-to option for all upcoming conferences and meetings. So, what are you waiting for Grab this template today.
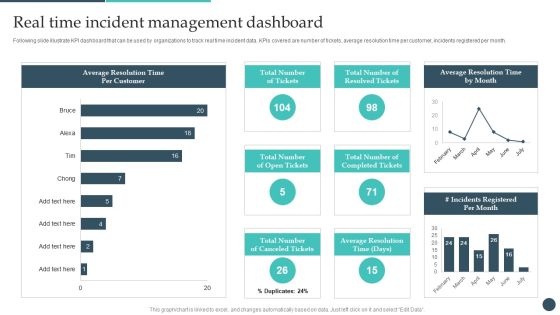
Safety Breach Response Playbook Real Time Incident Management Dashboard Formats PDF
Following slide illustrate KPI dashboard that can be used by organizations to track real time incident data. KPIs covered are number of tickets, average resolution time per customer, incidents registered per month. Find highly impressive Safety Breach Response Playbook Real Time Incident Management Dashboard Formats PDF on Slidegeeks to deliver a meaningful presentation. You can save an ample amount of time using these presentation templates. No need to worry to prepare everything from scratch because Slidegeeks experts have already done a huge research and work for you. You need to download Safety Breach Response Playbook Real Time Incident Management Dashboard Formats PDF for your upcoming presentation. All the presentation templates are 100 percent editable and you can change the color and personalize the content accordingly. Download now.

Generating Leads Through Impact Of New Social Media Marketing Campaign Clipart PDF
This slide showcases impact on marketing KPI after implementing improved social media marketing campaign. It illustrates increase in leads generated and organic reach of social media content. Find highly impressive Generating Leads Through Impact Of New Social Media Marketing Campaign Clipart PDF on Slidegeeks to deliver a meaningful presentation. You can save an ample amount of time using these presentation templates. No need to worry to prepare everything from scratch because Slidegeeks experts have already done a huge research and work for you. You need to download Generating Leads Through Impact Of New Social Media Marketing Campaign Clipart PDF for your upcoming presentation. All the presentation templates are 100 percent editable and you can change the color and personalize the content accordingly. Download now.
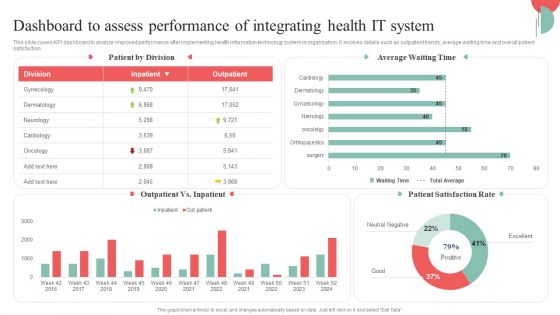
Incorporating HIS To Enhance Healthcare Services Dashboard To Assess Performance Of Integrating Health IT System Diagrams PDF
This slide covers KPI dashboard to analyze improved performance after implementing health information technology system in organization. It involves details such as outpatient trends, average waiting time and overall patient satisfaction. Create an editable Incorporating HIS To Enhance Healthcare Services Dashboard To Assess Performance Of Integrating Health IT System Diagrams PDF that communicates your idea and engages your audience. Whether youre presenting a business or an educational presentation, pre designed presentation templates help save time. Incorporating HIS To Enhance Healthcare Services Dashboard To Assess Performance Of Integrating Health IT System Diagrams PDF is highly customizable and very easy to edit, covering many different styles from creative to business presentations. Slidegeeks has creative team members who have crafted amazing templates. So, go and get them without any delay.
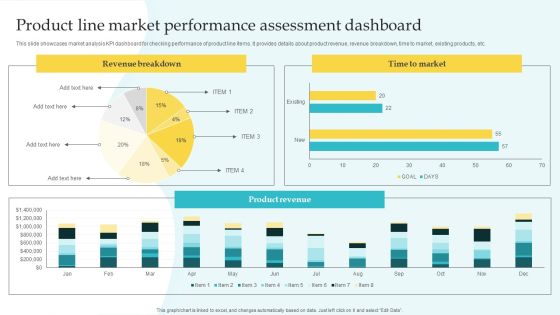
Commodity Line Expansion Product Line Market Performance Assessment Download PDF
This slide showcases market analysis KPI dashboard for checking performance of product line items. It provides details about product revenue, revenue breakdown, time to market, existing products, etc. Explore a selection of the finest Commodity Line Expansion Product Line Market Performance Assessment Download PDF here. With a plethora of professionally designed and pre-made slide templates, you can quickly and easily find the right one for your upcoming presentation. You can use our Commodity Line Expansion Product Line Market Performance Assessment Download PDF to effectively convey your message to a wider audience. Slidegeeks has done a lot of research before preparing these presentation templates. The content can be personalized and the slides are highly editable. Grab templates today from Slidegeeks.

Search Engine Marketing Sem Campaign Performance Evaluation Dashboard Mockup PDF
The following slide showcases the search engine marketing performance through KPI dashboard to evaluate return on investments ROI and promote visibility. It includes KPAs such as targets, unique purchases, cost per click, conversion rate, campaign reach, profile views etc. Crafting an eye-catching presentation has never been more straightforward. Let your presentation shine with this tasteful yet straightforward Search Engine Marketing Sem Campaign Performance Evaluation Dashboard Mockup PDF template. It offers a minimalistic and classy look that is great for making a statement. The colors have been employed intelligently to add a bit of playfulness while still remaining professional. Construct the ideal Search Engine Marketing Sem Campaign Performance Evaluation Dashboard Mockup PDF that effortlessly grabs the attention of your audience Begin now and be certain to wow your customers.

Data Driven Marketing Solutions Firm Company Profile Operational Kpis Graphics PDF
The following slide showcases the business operations KPI to illustrate the performance of the organization. The KPIs include YOY growth, repeat clients revenue, survey completion growth, client growth, and incentives earned. Are you searching for a Data Driven Marketing Solutions Firm Company Profile Operational Kpis Graphics PDF that is uncluttered, straightforward, and original Its easy to edit, and you can change the colors to suit your personal or business branding. For a presentation that expresses how much effort you have put in, this template is ideal. With all of its features, including tables, diagrams, statistics, and lists, its perfect for a business plan presentation. Make your ideas more appealing with these professional slides. Download Data Driven Marketing Solutions Firm Company Profile Operational Kpis Graphics PDF from Slidegeeks today.

Operational KPIsA Marketing Research Services Management Business Sample Pdf
The following slide showcases the business operations KPI to illustrate the performance of the organization. The KPIs include YOY growth, repeat clients revenue, survey completion growth, client growth, and incentives earned. Are you searching for a Operational KPIsA Marketing Research Services Management Business Sample Pdf that is uncluttered, straightforward, and original It is easy to edit, and you can change the colors to suit your personal or business branding. For a presentation that expresses how much effort you have put in, this template is ideal With all of its features, including tables, diagrams, statistics, and lists, it is perfect for a business plan presentation. Make your ideas more appealing with these professional slides. Download Operational KPIsA Marketing Research Services Management Business Sample Pdf from Slidegeeks today.

Enterprise Marketing And Sales Plan Overview Download PDF
The following slide showcases the sales plan summary to achieve qualitative and quantitative goals. It includes elements such as target, strategies, tactics, date and metrics. Presenting Enterprise Marketing And Sales Plan Overview Download PDF to dispense important information. This template comprises six stages. It also presents valuable insights into the topics including Goal, Target, Strategies. This is a completely customizable PowerPoint theme that can be put to use immediately. So, download it and address the topic impactfully.

Summarize Techniques For Organization Cost Allocation Project Cost Allocation Information PDF
The table below provides a general summary of the regional cost allocation through driver, criteria and metrics Deliver an awe inspiring pitch with this creative summarize techniques for organization cost allocation project cost allocation information pdf bundle. Topics like projected, economic, market, payment can be discussed with this completely editable template. It is available for immediate download depending on the needs and requirements of the user.

Cost Allotment Technique Project Cost Allocation Guidelines PDF
The table below provides a general summary of the regional cost allocation through driver, criteria and metrics.Deliver and pitch your topic in the best possible manner with this Cost Allotment Technique Project Cost Allocation Guidelines PDF. Use them to share invaluable insights on Transmission Owner, Environmental Impacts, Reliability Issues and impress your audience. This template can be altered and modified as per your expectations. So, grab it now.

Project Cost Allocation Cost Sharing And Exercisebased Costing System Topics PDF
The table below provides a general summary of the regional cost allocation through driver, criteria and metrics.Deliver and pitch your topic in the best possible manner with this Project Cost Allocation Cost Sharing And Exercisebased Costing System Topics PDF. Use them to share invaluable insights on Owner Reliability, Provide Reliability, Environmental Impacts and impress your audience. This template can be altered and modified as per your expectations. So, grab it now.

Cost Distribution Accounting Techniques Project Cost Allocation Introduction PDF
The table below provides a general summary of the regional cost allocation through driver, criteria and metrics. Presenting Cost Distribution Accounting Techniques Project Cost Allocation Introduction PDF to provide visual cues and insights. Share and navigate important information on four stages that need your due attention. This template can be used to pitch topics like Project, Driver, Criteria. In addtion, this PPT design contains high resolution images, graphics, etc, that are easily editable and available for immediate download.
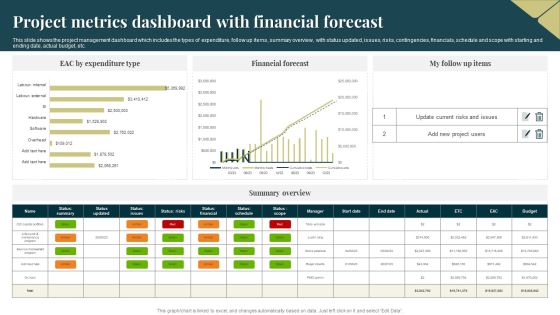
Project Metrics Dashboard With Financial Forecast Professional PDF
This slide shows the project management dashboard which includes the types of expenditure, follow up items, summary overview, with status updated, issues, risks, contingencies, financials, schedule and scope with starting and ending date, actual budget, etc. Showcasing this set of slides titled Project Metrics Dashboard With Financial Forecast Professional PDF. The topics addressed in these templates are Expenditure, Financial Forecast, Risks. All the content presented in this PPT design is completely editable. Download it and make adjustments in color, background, font etc. as per your unique business setting.

Project Crisis Metrics Dashboard With Updates Sample PDF
This slide focuses on the project crisis management dashboard which depicts the number of repairs, summary which includes risks, assumptions, dependencies, actions and repairs with the title, description, due date, score, status, owner and updates of repair. Showcasing this set of slides titled Project Crisis Metrics Dashboard With Updates Sample PDF. The topics addressed in these templates are Project, Risk, Damaged. All the content presented in this PPT design is completely editable. Download it and make adjustments in color, background, font etc. as per your unique business setting.

Formulating Money Laundering Transaction Monitoring And Fraud Detection Software Professional PDF
This slide illustrates transaction monitoring and fraud detection software framework. It provides information about command, control, dashboards, key performance indicators KPIs, risk score, real time detection, sanction screening, etc. Present like a pro with Deploying Banking Transaction Transaction Monitoring And Aml Training Plan Summary PDF Create beautiful presentations together with your team, using our easy-to-use presentation slides. Share your ideas in real-time and make changes on the fly by downloading our templates. So whether youre in the office, on the go, or in a remote location, you can stay in sync with your team and present your ideas with confidence. With Slidegeeks presentation got a whole lot easier. Grab these presentations today.

Financial Highlights Of SW Care Company Ppt File Template PDF
This slide shows the Financial Highlights of SW Care Company such as net trade sales, gross profit, net income, sales and marketing investment, share metrics, value creation metrics, market growth etc. along with decision point summary details. Deliver an awe inspiring pitch with this creative financial highlights of sw care company ppt file template pdf bundle. Topics like gross profit, investment, sales, price can be discussed with this completely editable template. It is available for immediate download depending on the needs and requirements of the user.
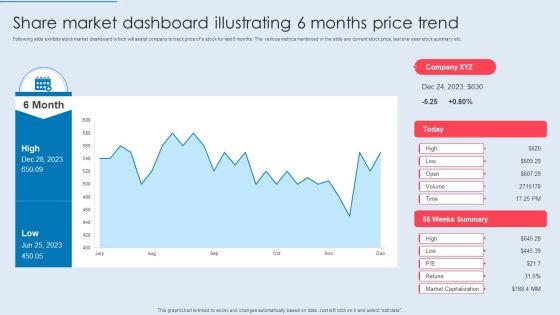
Share Market Dashboard Illustrating 6 Months Price Trend Ideas PDF
Following slide exhibits stock market dashboard which will assist company to track price of a stock for last 6 months. The various metrics mentioned in the slide are current stock price, last one year stock summary etc. Showcasing this set of slides titled Share Market Dashboard Illustrating 6 Months Price Trend Ideas PDF. The topics addressed in these templates are Share Market, Dashboard Illustrating, Months Price Trend. All the content presented in this PPT design is completely editable. Download it and make adjustments in color, background, font etc. as per your unique business setting.
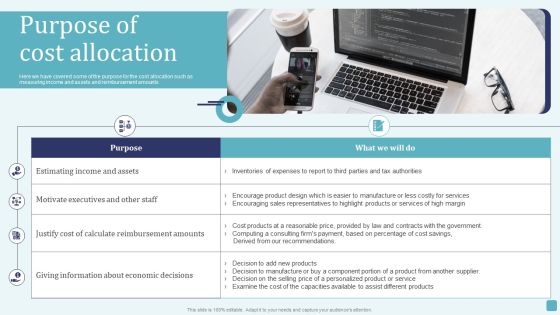
Purpose Of Cost Allocation Stages Of Cost Allocation Procedure Information PDF
The table below provides a general summary of the regional cost allocation through driver, criteria and metrics . Find highly impressive Purpose Of Cost Allocation Stages Of Cost Allocation Procedure Information PDF on Slidegeeks to deliver a meaningful presentation. You can save an ample amount of time using these presentation templates. No need to worry to prepare everything from scratch because Slidegeeks experts have already done a huge research and work for you. You need to download Purpose Of Cost Allocation Stages Of Cost Allocation Procedure Information PDF for your upcoming presentation. All the presentation templates are 100 precent editable and you can change the color and personalize the content accordingly. Download now.

Brand Building Techniques Enhance Customer Engagement Loyalty Addressing The Process To Develop Brand Professional PDF
The following slide outlines the six step process to develop and strengthen brand communication strategy. Understanding of target audience, selecting the channels, developing customer persona, determining the product USP, crafting the message and establishing key performance indicators KPI are the steps which are mentioned in the slide. Here you can discover an assortment of the finest PowerPoint and Google Slides templates. With these templates, you can create presentations for a variety of purposes while simultaneously providing your audience with an eye catching visual experience. Download Brand Building Techniques Enhance Customer Engagement Loyalty Addressing The Process To Develop Brand Professional PDF to deliver an impeccable presentation. These templates will make your job of preparing presentations much quicker, yet still, maintain a high level of quality. Slidegeeks has experienced researchers who prepare these templates and write high quality content for you. Later on, you can personalize the content by editing the Brand Building Techniques Enhance Customer Engagement Loyalty Addressing The Process To Develop Brand Professional PDF.

Analyzing Email Click Through Rate For Better Campaign Performance Slides PDF
This slide covers an overview of email click through rate KPI to identify total email recipients who clicked on one or more links attached in the email. It also includes strategies to increase the email click through rate, such as incorporating compelling calls to action, using A or B email testing, collecting recipient feedback, etc. If you are looking for a format to display your unique thoughts, then the professionally designed Analyzing Email Click Through Rate For Better Campaign Performance Slides PDF is the one for you. You can use it as a Google Slides template or a PowerPoint template. Incorporate impressive visuals, symbols, images, and other charts. Modify or reorganize the text boxes as you desire. Experiment with shade schemes and font pairings. Alter, share or cooperate with other people on your work. Download Analyzing Email Click Through Rate For Better Campaign Performance Slides PDF and find out how to give a successful presentation. Present a perfect display to your team and make your presentation unforgettable.
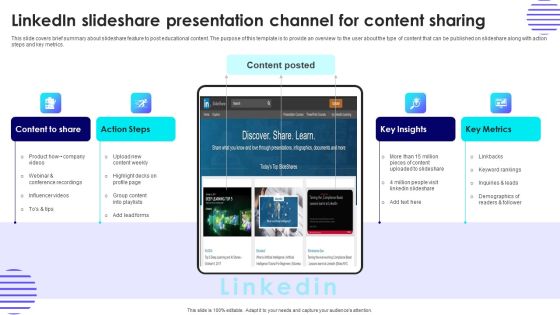
Linkedin Slideshare Presentation Channel For Content Sharing Template PDF
This slide covers brief summary about slideshare feature to post educational content. The purpose of this template is to provide an overview to the user about the type of content that can be published on slideshare along with action steps and key metrics. Present like a pro with Linkedin Slideshare Presentation Channel For Content Sharing Template PDF Create beautiful presentations together with your team, using our easy to use presentation slides. Share your ideas in real time and make changes on the fly by downloading our templates. So whether you are in the office, on the go, or in a remote location, you can stay in sync with your team and present your ideas with confidence. With Slidegeeks presentation got a whole lot easier. Grab these presentations today.

Key Findings Ppt PowerPoint Presentation Complete Deck With Slides
This is a key findings ppt powerpoint presentation complete deck with slides. This is a one stage process. The stages in this process are key findings, management, planning, business, analysis.
Kpis And Dashboards Vector Icons Ppt Powerpoint Presentation Infographics Outline
This is a kpis and dashboards vector icons ppt powerpoint presentation infographics outline. This is a eight stage process. The stages in this process are dashboard, kpi, metrics.

Business Improvement Metrics Example Ppt Presentation
This is a business improvement metrics example ppt presentation. This is a four stage process. The stages in this process are focus, area of focus, metrics, targets, objectives.
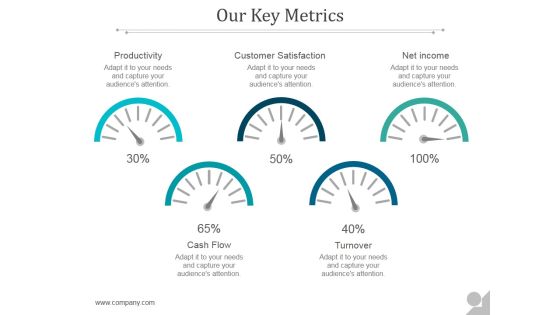
Our Key Metrics Ppt PowerPoint Presentation Examples
This is a our key metrics ppt powerpoint presentation examples. This is a five stage process. The stages in this process are productivity, customer satisfaction, net income, cash flow, turnover.

Our Key Metrics Ppt PowerPoint Presentation Portfolio
This is a our key metrics ppt powerpoint presentation portfolio. This is a five stage process. The stages in this process are cash flow, turnover, productivity, customer satisfaction, net income.
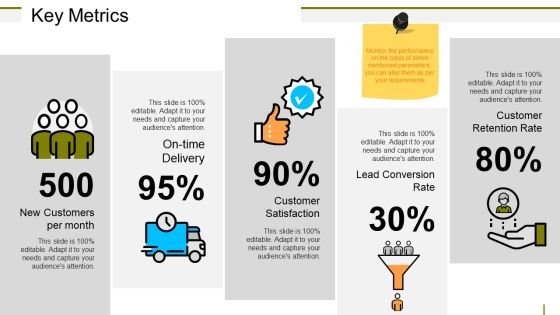
Key Metrics Ppt PowerPoint Presentation Model Portrait
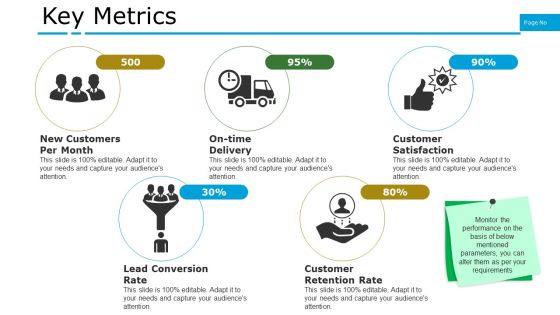
Key Metrics Ppt PowerPoint Presentation Infographics Example Topics
This is a key metrics ppt powerpoint presentation infographics example topics. This is a five stage process. The stages in this process are new customers per month, on time delivery, customer satisfaction, lead conversion rate, customer retention rate.

Actual Vs Target Sales Ppt PowerPoint Presentation Gallery Images
This is a actual vs target sales ppt powerpoint presentation ideas brochure. This is a seven stage process. The stages in this process are actual target, kpi.
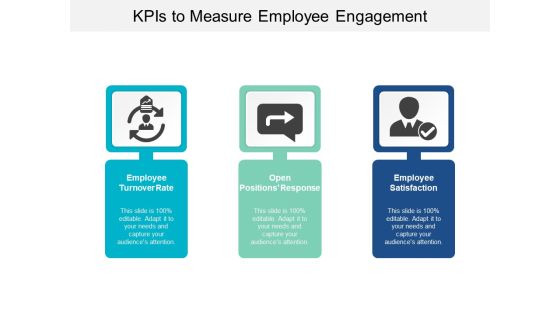
Kpis To Measure Employee Engagement Ppt Powerpoint Presentation Pictures Gridlines
This is a kpis to measure employee engagement ppt powerpoint presentation pictures gridlines. This is a three stage process. The stages in this process are dashboard, kpi, metrics.

Technology Reporting Template Presentation Powerpoint
This is a technology reporting template presentation powerpoint. This is a five stage process. The stages in this process are metrics, technology summary, issues, data lacking, technical report.

Content Marketing Freelance Metrics Dashboard With Content Visit And Reach Mockup PDF
Showcasing this set of slides titled Content Marketing Freelance Metrics Dashboard With Content Visit And Reach Mockup PDF. The topics addressed in these templates are Content Visits, Content Summary, Marketing Summary. All the content presented in this PPT design is completely editable. Download it and make adjustments in color, background, font etc. as per your unique business setting.

Business Performance With Regional Scorecard Ppt PowerPoint Presentation Slides Tips PDF
Presenting this set of slides with name business performance with regional scorecard ppt powerpoint presentation slides tips pdf. The topics discussed in these slides are regional scorecard, set ratio kpi, based on profit ratio kpi, 2019, 2020. This is a completely editable PowerPoint presentation and is available for immediate download. Download now and impress your audience.

Sample Project Management Metrics Ppt Powerpoint Show
This is a sample project management metrics ppt powerpoint show. This is a seven stage process. The stages in this process are impart, routes, sections, summary, estimates, metadata, samples, create tops, import samples, validate, lrs, sections, samples, coverage, verify, sample, adequacy, expansion factor, sample data item check, reports, spatial intersection, impart, routes, sections, summary, estimates, metadata, samples, create tops, import samples, validate, lrs, sections, samples, coverage, verify, sample, adequacy, expansion factor, sample data item check, reports, spatial intersection.

Key Performance Indicators Template 2 Ppt PowerPoint Presentation Ideas Background Images
This is a key performance indicators template 2 ppt powerpoint presentation ideas background images. This is a four stage process. The stages in this process are objective, measures, targets, invites.

Data Statistics Charts And Key Performance Indicators Ppt Powerpoint Presentation Layouts Guide
This is a data statistics charts and key performance indicators ppt powerpoint presentation layouts guide. This is a four stage process. The stages in this process are business metrics, business kpi, business dashboard.

Availability Key Performance Indicator Inventory Turnover Ratio Ppt Powerpoint Presentation Layouts Graphics Download
This is a availability key performance indicator inventory turnover ratio ppt powerpoint presentation layouts graphics download. This is a two stage process. The stages in this process are availability kpi, availability dashboard, availability metrics.
Ten Examples Of Key Performance Indicators Ppt Powerpoint Presentation Layouts Professional
This is a ten examples of key performance indicators ppt powerpoint presentation layouts professional. This is a ten stage process. The stages in this process are dashboard, kpi, metrics.

Real Estate Outlook Ppt PowerPoint Presentation Layout
This is a real estate outlook ppt powerpoint presentation layout. This is a one stage process. The stages in this process are business, marketing, management, real estate, innovation.

Key Product Service Offerings Template 2 Ppt PowerPoint Presentation Templates
This is a key product service offerings template 2 ppt powerpoint presentation templates. This is a six stage process. The stages in this process are product, marketing, business, management, strategy.
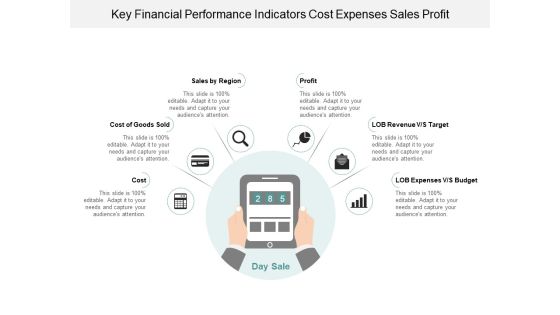
Key Financial Performance Indicators Cost Expenses Sales Profit Ppt Powerpoint Presentation Infographic Template Graphic Images
This is a key financial performance indicators cost expenses sales profit ppt powerpoint presentation infographic template graphic images. This is a six stage process. The stages in this process are dashboard, kpi, metrics.

Our Keys To Success Template Ppt PowerPoint Presentation Guide
This is a our keys to success template ppt powerpoint presentation guide. This is a four stage process. The stages in this process are shapes, key, business, marketing, strategy.
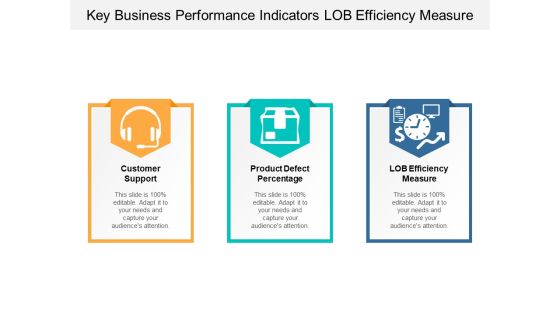
Key Business Performance Indicators Lob Efficiency Measure Ppt Powerpoint Presentation Infographics File Formats
This is a key business performance indicators lob efficiency measure ppt powerpoint presentation infographics file formats. This is a three stage process. The stages in this process are dashboard, kpi, metrics.

Key Financial Ratios Template Ppt PowerPoint Presentation Show Graphics Design
This is a key financial ratios template ppt powerpoint presentation show graphics design. This is a four stage process. The stages in this process are liquidity, profitability, activity, solvency.

Key Financial Ratios Ppt PowerPoint Presentation Infographic Template Master Slide
This is a key financial ratios ppt powerpoint presentation infographic template master slide. This is a eight stage process. The stages in this process are debt to equity ratio, current ratio, return on equity, return on investment.

Inventory Metrics Carrying Cost Order Inventory Delivered Unit Costs Ppt Powerpoint Presentation Layouts Guidelines
This is a inventory metrics carrying cost order inventory delivered unit costs ppt powerpoint presentation layouts guidelines. This is a two stage process. The stages in this process are availability kpi, availability dashboard, availability metrics.

Automated Dashboard To Track Status Of Order Request Themes PDF
The following slide highlights automated dashboard which can be used to track the status of pleased orders, and manage the inventory across various outlets. The key performance indicators are order, summary, inventory, summary, cost of goods sold, financial statement. Showcasing this set of slides titled Automated Dashboard To Track Status Of Order Request Themes PDF. The topics addressed in these templates are Inventory Value, Inventory Summary, Cost. All the content presented in this PPT design is completely editable. Download it and make adjustments in color, background, font etc. as per your unique business setting.
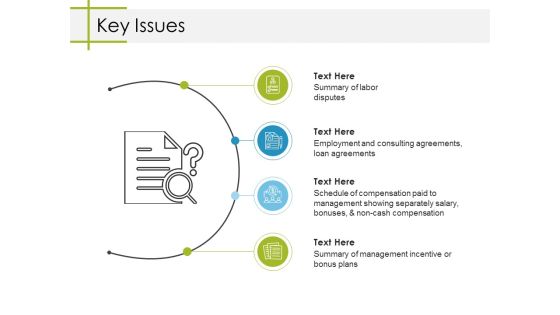
Key Issues Ppt PowerPoint Presentation Slides Deck
This is a key issues ppt powerpoint presentation slides deck. This is a four stage process. The stages in this process are key issues, business, marketing, icons, strategy.

4 Key Market Drivers Of Economic Growth Ppt PowerPoint Presentation Templates
This is a 4 key market drivers of economic growth ppt powerpoint presentation templates. This is a four stage process. The stages in this process are key market driver.
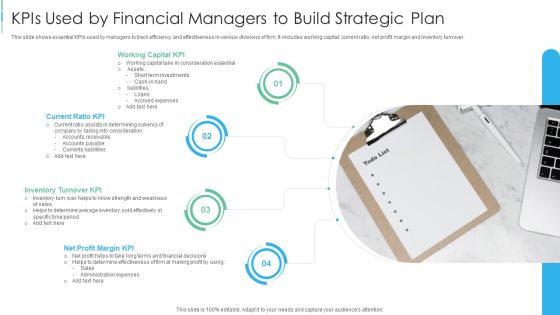
Kpis Used By Financial Managers To Build Strategic Plan Diagrams PDF
This slide shows essential KPIs used by managers to track efficiency and effectiveness in various divisions of firm. It includes working capital, current ratio, net profit margin and inventory turnover.Presenting Kpis Used By Financial Managers To Build Strategic Plan Diagrams PDF to dispense important information. This template comprises four stages. It also presents valuable insights into the topics including Working Capital KPI, Current Ratio KPI, Inventory Turnover KPI. This is a completely customizable PowerPoint theme that can be put to use immediately. So, download it and address the topic impactfully.

Loyalty Program Performance Ppt PowerPoint Presentation Tips
This is a loyalty program performance ppt powerpoint presentation tips. This is a four stage process. The stages in this process are enrollments, reward outstanding, loyalty revenue, gift sales.

Loyalty Program Performance Ppt PowerPoint Presentation Portfolio
This is a loyalty program performance ppt powerpoint presentation portfolio. This is a four stage process. The stages in this process are enrollments, reward outstanding, loyalty revenue, gift sales.

Key Management Ppt PowerPoint Presentation Pictures Tips
This is a key management ppt powerpoint presentation pictures tips. This is a three stage process. The stages in this process are john carter, peter clark, elisabeth smith.
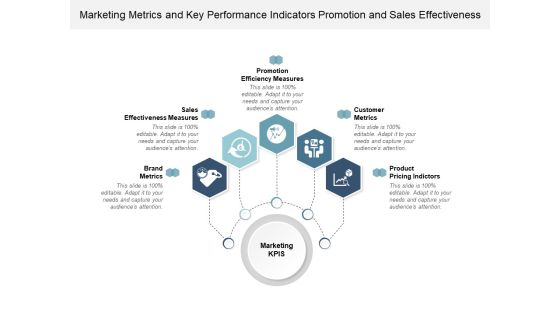
Marketing Metrics And Key Performance Indicators Promotion And Sales Effectiveness Ppt Powerpoint Presentation Infographics Graphics Example
This is a marketing metrics and key performance indicators promotion and sales effectiveness ppt powerpoint presentation infographics graphics example. This is a five stage process. The stages in this process are dashboard, kpi, metrics.

Profitability Key Performance Indicators Financial Activities Cash Flow Ppt Powerpoint Presentation Portfolio Clipart Images
This is a profitability key performance indicators financial activities cash flow ppt powerpoint presentation portfolio clipart images. This is a five stage process. The stages in this process are dashboard, kpi, metrics.

Key Financial Ratios Ppt PowerPoint Presentation Guidelines
This is a key financial ratios ppt powerpoint presentation guidelines. This is a four stage process. The stages in this process are current ratio, debt to equity ratio, ratio, return, return on assets.
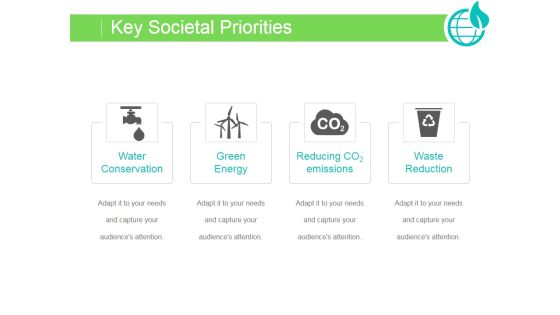
Key Societal Priorities Ppt PowerPoint Presentation Graphics
This is a key societal priorities ppt powerpoint presentation graphics. This is a four stage process. The stages in this process are water conservation, green energy, reducing co emissions, waste reduction.
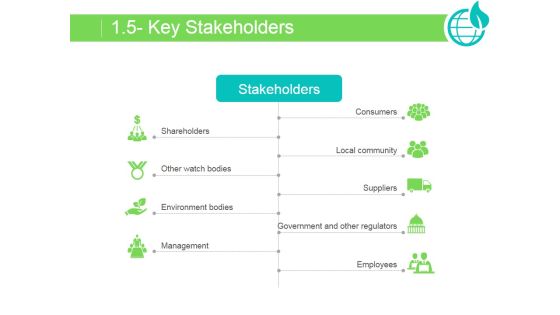
Key Stakeholders Ppt PowerPoint Presentation Example 2015
This is a key stakeholders ppt powerpoint presentation example 2015. This is a nine stage process. The stages in this process are shareholders, other watch bodies, environment bodies, management, consumers, local community, suppliers, government and other regulators, employees.

Key Highlights Ppt PowerPoint Presentation Gallery Deck
This is a key highlights ppt powerpoint presentation gallery deck. This is a eight stage process. The stages in this process are indias top telecom company, leader in automobile components in india, only indian company provider having a xyz certification, amongst worlds top 10 automobile companies, number of certified welders.

Financial Charts And Graphs For Statistical Analysis Ppt Powerpoint Presentation Show Layout
This is a financial charts and graphs for statistical analysis ppt powerpoint presentation show layout. This is a four stage process. The stages in this process are business metrics, business kpi, business dashboard.

Customer Satisfaction Template Ppt PowerPoint Presentation Show Introduction
This is a customer satisfaction template ppt powerpoint presentation show introduction. This is a three stage process. The stages in this process are overall satisfaction with service, satisfaction with value for money, overall satisfaction with relationship.

Status Or Performance Dashboard Ppt PowerPoint Presentation Clipart
This is a status or performance dashboard ppt powerpoint presentation clipart. This is a three stage process. The stages in this process are low, medium, high.
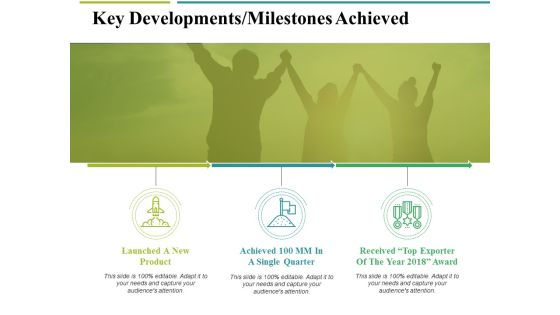
Key Developments Milestones Achieved Ppt PowerPoint Presentation Ideas Styles
This is a key developments milestones achieved ppt powerpoint presentation ideas styles. This is a three stage process. The stages in this process are launched a new product, single quarter, key developments, business, marketing.
Key Attributes Of Fixed Price Model Ppt PowerPoint Presentation Icon
This is a key attributes of fixed price model ppt powerpoint presentation icon. This is a six stage process. The stages in this process are fixed price model.
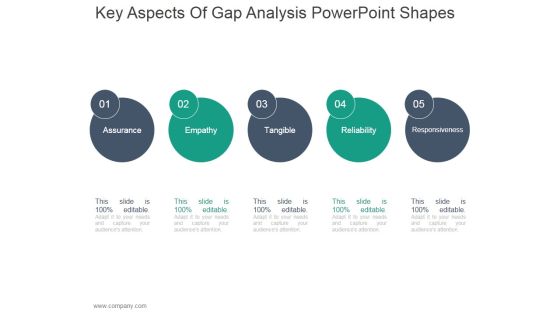
Key Aspects Of Gap Analysis Ppt PowerPoint Presentation Guide
This is a key aspects of gap analysis ppt powerpoint presentation guide. This is a five stage process. The stages in this process are assurance, empathy, tangible, reliability, responsiveness.
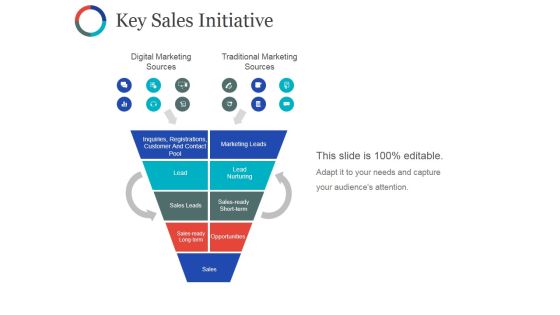
Key Sales Initiative Ppt PowerPoint Presentation Infographics Show
This is a key sales initiative ppt powerpoint presentation infographics show. This is a five stage process. The stages in this process are digital marketing sources, traditional marketing sources, lead, lead nurturing, sales leads.

Key Management Ppt PowerPoint Presentation Pictures Visual Aids
This is a key management ppt powerpoint presentation pictures visual aids. This is a three stage process. The stages in this process are jack albert, mack disouza, anny parker.
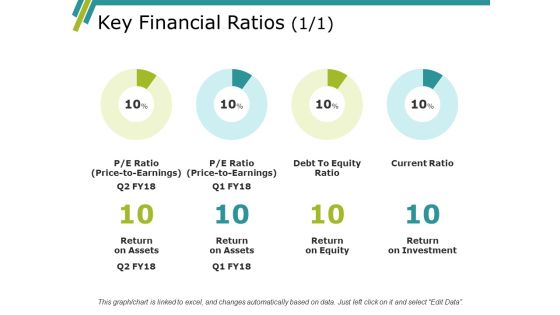
Key Financial Ratios Ppt PowerPoint Presentation Model Elements
This is a key financial ratios ppt powerpoint presentation model elements. This is a four stage process. The stages in this process are return on assets, return on equity, return on investment.
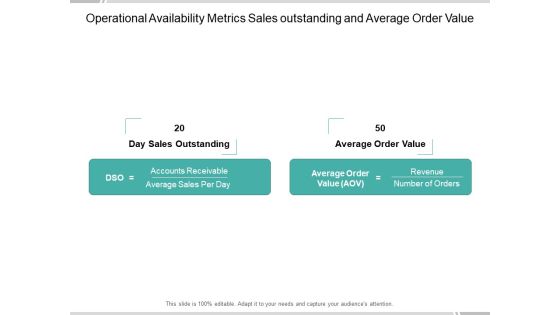
Operational Availability Metrics Sales Outstanding And Average Order Value Ppt Powerpoint Presentation Infographic Template Introduction
This is a operational availability metrics sales outstanding and average order value ppt powerpoint presentation infographic template introduction. This is a two stage process. The stages in this process are availability kpi, availability dashboard, availability metrics.

Kpis For Measuring Brand Marketing Communication Potential Share Ppt Powerpoint Presentation Layouts Infographics
This is a kpis for measuring brand marketing communication potential share ppt powerpoint presentation layouts infographics. This is a six stage process. The stages in this process are dashboard, kpi, metrics.

6 Key Success Factors In Business Plan Ppt PowerPoint Presentation Microsoft
This is a 6 key success factors in business plan ppt powerpoint presentation microsoft. This is a six stage process. The stages in this process are key success factors, factor.
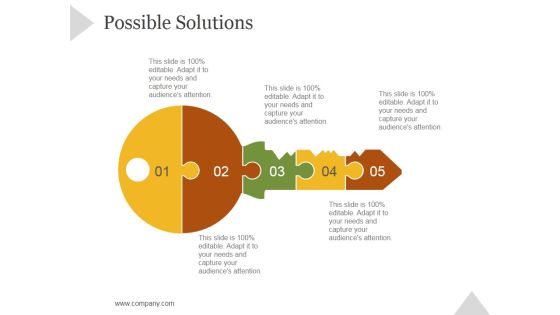
Possible Solutions Ppt PowerPoint Presentation Portfolio
This is a possible solutions ppt powerpoint presentation portfolio. This is a five stage process. The stages in this process are business, strategy, marketing, success, puzzle, key lock.

Business Performance Measures Powerpoint Slide
This is a business performance measures powerpoint slide designs. This is a three stage process. The stages in this process are business, marketing, performance, presentation, management.
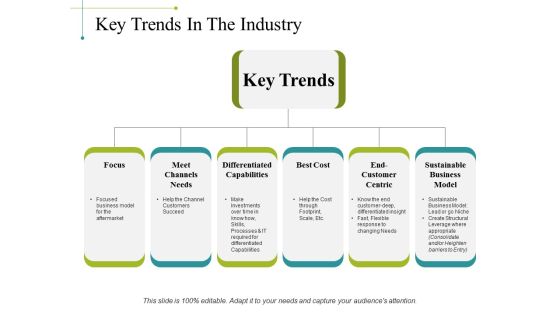
Key Trends In The Industry Ppt PowerPoint Presentation Portfolio Design Inspiration
This is a key trends in the industry ppt powerpoint presentation portfolio design inspiration. This is a six stage process. The stages in this process are focus, meet channels needs, differentiated capabilities, best cost, sustainable business model.

Identifying Key Business And It Drivers Ppt PowerPoint Presentation Ideas Files
This is a identifying key business and it drivers ppt powerpoint presentation ideas files. This is a three stage process. The stages in this process are increase sales and shares, improve profit, manage risks, business, management.

Calculator With Business Reports For Operational Efficiency Ppt Powerpoint Presentation Ideas Infographic Template
This is a calculator with business reports for operational efficiency ppt powerpoint presentation ideas infographic template. This is a four stage process. The stages in this process are business metrics, business kpi, business dashboard.
Performance Indicators Of Business Icons Ppt Powerpoint Presentation Infographics Graphics Template
This is a performance indicators of business icons ppt powerpoint presentation infographics graphics template. This is a four stage process. The stages in this process are dashboard, kpi, metrics.

6 Point Goal For Company Management Ppt PowerPoint Presentation Slide
This is a 6 point goal for company management ppt powerpoint presentation slide. This is a six stage process. The stages in this process are agenda, business, strategy, icons, hexagon, marketing.
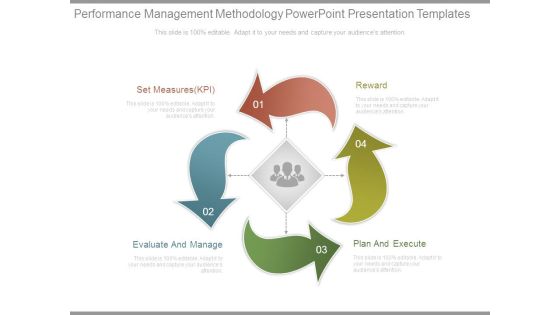
Performance Management Methodology Powerpoint Presentation Templates
This is a performance management methodology powerpoint presentation templates. This is a four stage process. The stages in this process are set measures kpi, evaluate and manage, reward, plan and execute.

Business Strategic Performance Report Ppt Powerpoint Presentation Show Background Image
This is a business strategic performance report ppt powerpoint presentation show background image. This is a four stage process. The stages in this process are business metrics, business kpi, business dashboard.

4 Steps Agenda To Achieve Company Goals Ppt PowerPoint Presentation Inspiration
This is a 4 steps agenda to achieve company goals ppt powerpoint presentation inspiration. This is a four stage process. The stages in this process are business, agenda, strategy, analysis, success.

Customer Service Kpis Satisfied Customers And Churn Rate Ppt Powerpoint Presentation Pictures Template
This is a customer service kpis satisfied customers and churn rate ppt powerpoint presentation pictures template. This is a four stage process. The stages in this process are dashboard, kpi, metrics.
Measure Performance And Set Targets Ppt Powerpoint Presentation Gallery Guidelines
This is a measure performance and set targets ppt powerpoint presentation gallery guidelines. This is a three stage process. The stages in this process are business metrics, business kpi, business dashboard.
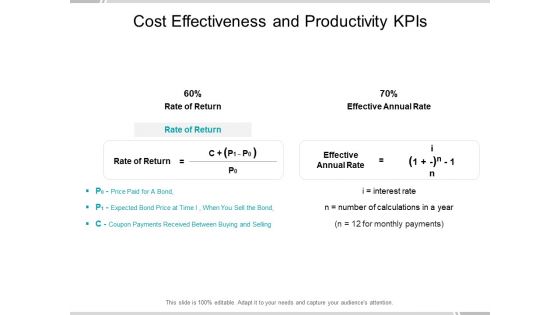
Cost Effectiveness And Productivity Kpis Ppt Powerpoint Presentation Portfolio Demonstration
This is a cost effectiveness and productivity kpis ppt powerpoint presentation portfolio demonstration. This is a two stage process. The stages in this process are availability kpi, availability dashboard, availability metrics.

Business Analysis Data Charts And Reports Ppt Powerpoint Presentation Ideas Portrait
This is a business analysis data charts and reports ppt powerpoint presentation ideas portrait. This is a three stage process. The stages in this process are business metrics, business kpi, business dashboard.

Computer Screen With Business Data Charts Ppt Powerpoint Presentation Show Vector
This is a computer screen with business data charts ppt powerpoint presentation show vector. This is a four stage process. The stages in this process are business metrics, business kpi, business dashboard.

Essentials Of Statistics For Business And Economics Ppt Powerpoint Presentation Pictures Styles
This is a essentials of statistics for business and economics ppt powerpoint presentation pictures styles. This is a three stage process. The stages in this process are business metrics, business kpi, business dashboard.
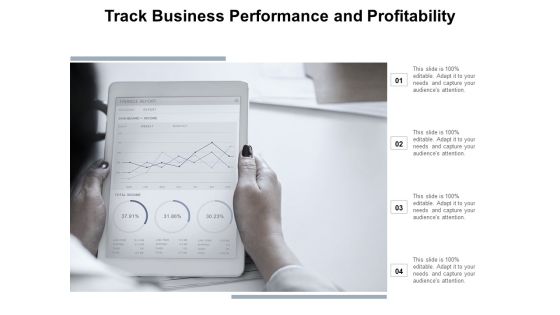
Track Business Performance And Profitability Ppt Powerpoint Presentation File Master Slide
This is a track business performance and profitability ppt powerpoint presentation file master slide. This is a four stage process. The stages in this process are business metrics, business kpi, business dashboard.

Market Segmentation Funnel Example Of Ppt Presentation
This is a market segmentation funnel example of ppt presentation. This is a three stage process. The stages in this process are funnel, business, filter, marketing, arrow.

Bar Chart With Magnifying Glass For Financial Analysis Ppt Powerpoint Presentation Infographics Designs Download
This is a bar chart with magnifying glass for financial analysis ppt powerpoint presentation infographics designs download. This is a three stage process. The stages in this process are business metrics, business kpi, business dashboard.

Key Financial Ratios Ppt PowerPoint Presentation Outline Slide
This is a key financial ratios ppt powerpoint presentation outline slide. This is a eight stage process. The stages in this process are return on assets, return on equity, return on investment, current ratio, debt equity ratio.
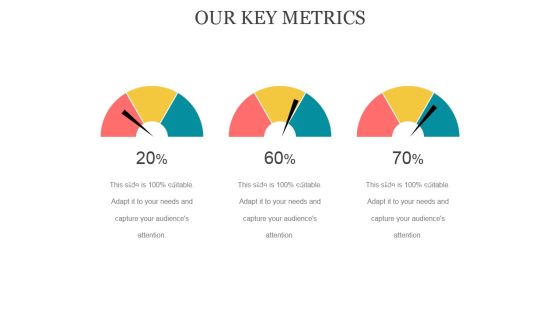
Our Key Metrics Ppt PowerPoint Presentation Styles
This is a our key metrics ppt powerpoint presentation styles. This is a three stage process. The stages in this process are business, marketing, dashboard, planning, analysis.

Media Mix Strategy Ppt PowerPoint Presentation Pictures Background Designs
This is a media mix strategy ppt powerpoint presentation pictures background designs. This is a four stage process. The stages in this process are intelligence, content venue, promotional , platforms, kpi, strategy.

Actual Versus Target Revenue Setting Strategic Goals Ppt PowerPoint Presentation Visual Aids Diagrams
This is a actual versus target revenue setting strategic goals ppt powerpoint presentation visual aids diagrams. This is a six stage process. The stages in this process are actual vs target value, actual, target, kpi, series.
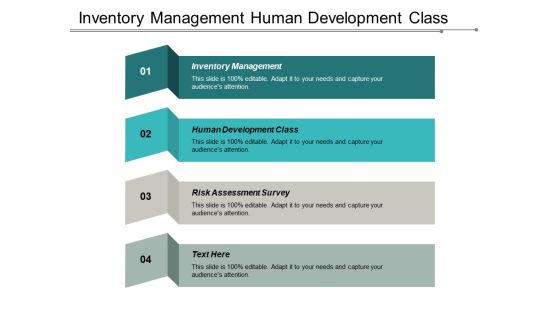
Inventory Management Human Development Class Risk Assessment Survey Ppt PowerPoint Presentation Show Designs
This is a inventory management human development class risk assessment survey ppt powerpoint presentation show designs. This is a four stage process. The stages in this process are inventory management kpi, marketing strategy research, stress management.

Customer Retention Kpis Lifetime Value And Acquisition Cost Ppt Powerpoint Presentation Model Samples
This is a customer retention kpis lifetime value and acquisition cost ppt powerpoint presentation model samples. This is a five stage process. The stages in this process are dashboard, kpi, metrics.
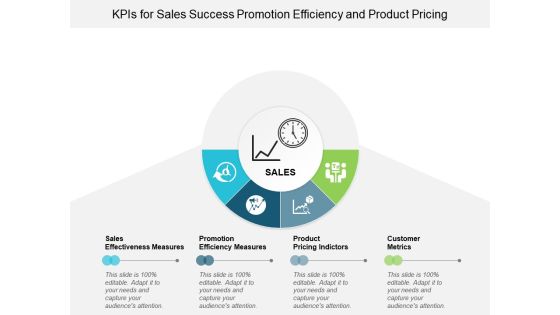
Kpis For Sales Success Promotion Efficiency And Product Pricing Ppt Powerpoint Presentation Infographics Background Images
This is a kpis for sales success promotion efficiency and product pricing ppt powerpoint presentation infographics background images. This is a four stage process. The stages in this process are dashboard, kpi, metrics.
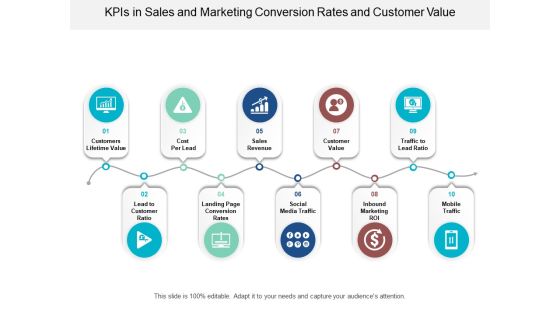
Kpis In Sales And Marketing Conversion Rates And Customer Value Ppt Powerpoint Presentation File Information
This is a kpis in sales and marketing conversion rates and customer value ppt powerpoint presentation file information. This is a ten stage process. The stages in this process are dashboard, kpi, metrics.

Customer Satisfaction Levels High Medium Low Indicator Dashboard Ppt PowerPoint Presentation Icon Show
This is a customer satisfaction levels high medium low indicator dashboard ppt powerpoint presentation icon show. This is a six stage process. The stages in this process are performance dashboard, performance meter, performance kpi.

Dashboard Vector With Pointer And Text Holders Ppt PowerPoint Presentation Portfolio Format Ideas
This is a dashboard vector with pointer and text holders ppt powerpoint presentation portfolio format ideas. This is a four stage process. The stages in this process are performance dashboard, performance meter, performance kpi.

Dashboards For Performance Mapping And Management Ppt PowerPoint Presentation Ideas File Formats
This is a dashboards for performance mapping and management ppt powerpoint presentation ideas file formats. This is a four stage process. The stages in this process are performance dashboard, performance meter, performance kpi.
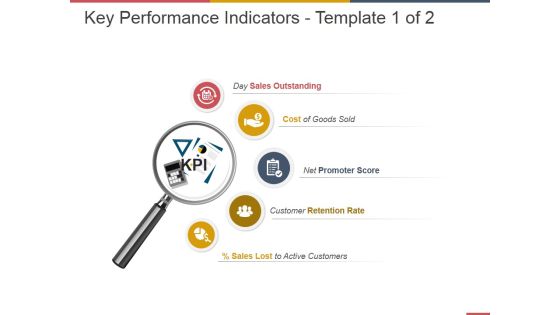
Key Performance Indicators Template 1 Ppt PowerPoint Presentation Portfolio
This is a key performance indicators template 1 ppt powerpoint presentation portfolio. This is a five stage process. The stages in this process are sales outstanding, cost of goods sold, promoter score, retention rate, active customers.

Customer NPS Metric Statistics Of Banking Industry Ppt Styles Microsoft PDF
This slide illustrates statistics of net promoter score NPS in banking industry. It provides information about summary, personal banking, business banking and wealth management. Pitch your topic with ease and precision using this Customer NPS Metric Statistics Of Banking Industry Ppt Styles Microsoft PDF. This layout presents information on Summary, Personal Banking, Business Banking, Wealth Management. It is also available for immediate download and adjustment. So, changes can be made in the color, design, graphics or any other component to create a unique layout.

Content Marketing Freelance Metrics Dashboard With Engagement Overview Demonstration PDF
Showcasing this set of slides titled Content Marketing Freelance Metrics Dashboard With Engagement Overview Demonstration PDF. The topics addressed in these templates are Metrics Summary, Engagement Overview. All the content presented in this PPT design is completely editable. Download it and make adjustments in color, background, font etc. as per your unique business setting.
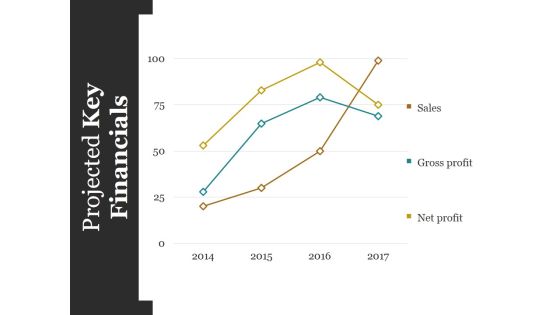
Projected Key Financials Template Ppt PowerPoint Presentation Styles Graphics Design
This is a projected key financials template ppt powerpoint presentation styles graphics design. This is a four stage process. The stages in this process are sales, gross profit, net profit.
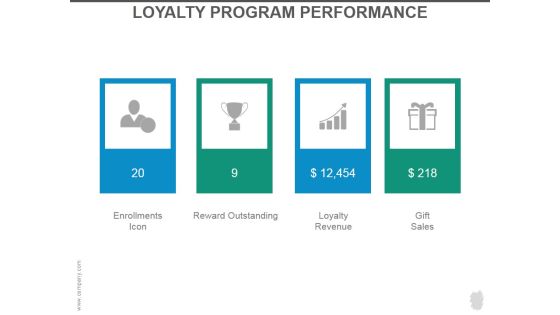
Loyalty Program Performance Ppt PowerPoint Presentation Slides
This is a loyalty program performance ppt powerpoint presentation slides. This is a four stage process. The stages in this process are enrollments icon, reward outstanding, loyalty revenue, gift sales.

Loyalty Program Performance Ppt PowerPoint Presentation Introduction
This is a loyalty program performance ppt powerpoint presentation introduction. This is a four stage process. The stages in this process are enrollments icon, reward outstanding, loyalty revenue, gift sales.
Key Financial Ratios Template 2 Ppt PowerPoint Presentation Icon Slide Download
This is a key financial ratios template 2 ppt powerpoint presentation icon slide download. This is a six stage process. The stages in this process are price to earnings, debt to equity ratio, current ratio, return on, equity, return on , assets, return on investment.

Key Trends In The Industry Ppt PowerPoint Presentation Professional Backgrounds
This is a key trends in the industry ppt powerpoint presentation professional backgrounds. This is a six stage process. The stages in this process are focus, meet channels needs, differentiated capabilities, best cost, end customer centric.

Key Solutions For Building A Successful Startup Ppt PowerPoint Presentation Infographics
This is a key solutions for building a successful startup ppt powerpoint presentation infographics. This is a six stage process. The stages in this process are key, arrows, security, business, marketing.
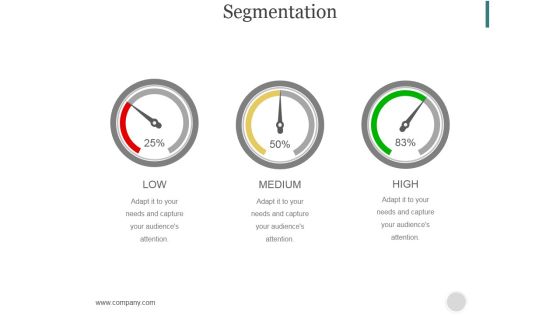
Segmentation Ppt PowerPoint Presentation Portfolio
This is a segmentation ppt powerpoint presentation portfolio. This is a three stage process. The stages in this process are low, medium, high.

4 Means To Achieve Company Goal Ppt PowerPoint Presentation Clipart
This is a 4 means to achieve company goal ppt powerpoint presentation clipart. This is a four stage process. The stages in this process are arrows, targets, success, marketing, presentation.

5 Rules To Achieve Objectives Ppt PowerPoint Presentation Slide
This is a 5 rules to achieve objectives ppt powerpoint presentation slide. This is a one stage process. The stages in this process are business, arrows, target, strategy, success.

5 Arrow Goals And Objectives For Work Management Ppt PowerPoint Presentation Example File
This is a 5 arrow goals and objectives for work management ppt powerpoint presentation example file. This is a five stage process. The stages in this process are programmer for strategic objectives, systems and solutions, operation of solution, business plan, business marketing.

Cause And Effect Relationship In Behavior With Pointers Ppt PowerPoint Presentation Shapes
This is a cause and effect relationship in behavior with pointers ppt powerpoint presentation shapes. This is a six stage process. The stages in this process are root cause materials, root cause methods, effects resultant problem, root cause people, root cause equipment.

Account Payable Metrics With Total Invoices Ppt PowerPoint Presentation Ideas Layouts PDF
Presenting this set of slides with name account payable metrics with total invoices ppt powerpoint presentation ideas layouts pdf. The topics discussed in these slides are creditors days, age wise due summary, top vendor purchases, vendors by amount due, total invoices vs paid invoices. This is a completely editable PowerPoint presentation and is available for immediate download. Download now and impress your audience.

Steps Of Yearly Operations Planning Process Ppt PowerPoint Presentation Gallery Template PDF
The following slide showcases various steps of annual operations planning process. It includes key steps like gather diversified team, analyze precious years, set realistic goals, determine KPI, prepare monthly budgets, plan for future and revisit regularly. Pitch your topic with ease and precision using this Steps Of Yearly Operations Planning Process Ppt PowerPoint Presentation Gallery Template PDF. This layout presents information on Analyze Previous Years, Set Realistic Objectives, Determine KPI. It is also available for immediate download and adjustment. So, changes can be made in the color, design, graphics or any other component to create a unique layout.

Online Enterprise Customer Activity Overview Dashboard Download PDF
The following slide highlights the key performance indicators of online customer activity to create better user experience. It includes KPAs such as website traffic, device breakdown summary, average time spent etc. Pitch your topic with ease and precision using this Online Enterprise Customer Activity Overview Dashboard Download PDF. This layout presents information on Device, Analysis, Summary. It is also available for immediate download and adjustment. So, changes can be made in the color, design, graphics or any other component to create a unique layout.

Strategy Execution Process With Track Performance Ppt PowerPoint Presentation File Slideshow
Presenting this set of slides with name strategy execution process with track performance ppt powerpoint presentation file slideshow. This is a five stage process. The stages in this process are execute strategy, deploy goals, align kpi, track performance, develop leadership. This is a completely editable PowerPoint presentation and is available for immediate download. Download now and impress your audience.
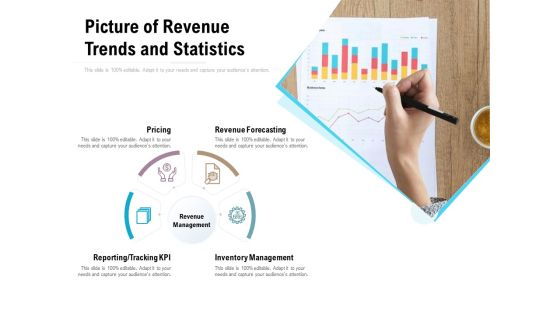
Picture Of Revenue Trends And Statistics Ppt PowerPoint Presentation Ideas Backgrounds
Presenting this set of slides with name picture of revenue trends and statistics ppt powerpoint presentation ideas backgrounds. This is a four stage process. The stages in this process are pricing, revenue forecasting, inventory management, reporting, tracking kpi, revenue management. This is a completely editable PowerPoint presentation and is available for immediate download. Download now and impress your audience.

Recruitment Strategy And Human Resource Employee Skill Assessment Scorecard Background PDF
The following slide showcases HR scorecard and strategy map. It includes employee growth, financial and process, KPI, current score and target. This is a Recruitment Strategy And Human Resource Employee Skill Assessment Scorecard Background PDF template with various stages. Focus and dispense information on two stages using this creative set, that comes with editable features. It contains large content boxes to add your information on topics like Recruitment Strategy Management, HR Scorecard, KPI, Strategy. You can also showcase facts, figures, and other relevant content using this PPT layout. Grab it now.

Availability Key Performance Indicator Inventory Turnover Ratio Ppt PowerPoint Presentation Icon Themes
Presenting this set of slides with name availability key performance indicator inventory turnover ratio ppt powerpoint presentation icon themes. The topics discussed in these slides are availability kpi, availability dashboard, availability metrics. This is a completely editable PowerPoint presentation and is available for immediate download. Download now and impress your audience.

Essential Factors To Develop Sales Remuneration Strategy Ppt Gallery Graphics PDF
The following slide highlights the essential factors to develop sales commission scheme. It illustrates company goals, roles in team, budget and industry, on target earnings, sales team kpi, company culture and payout. Persuade your audience using this Essential Factors To Develop Sales Remuneration Strategy Ppt Gallery Graphics PDF. This PPT design covers seven stages, thus making it a great tool to use. It also caters to a variety of topics including Company Goals, Budget And Industry, On Target Earnings, Sales Team KPI. Download this PPT design now to present a convincing pitch that not only emphasizes the topic but also showcases your presentation skills.

Multiple Steps To Create Corporate Advertising Strategy Designs PDF
This slide contains the steps involved to create an effective marketing strategy which helps business to promote and advertise their products to increase sales. Major tasks include executive summary, metrics, buyers persona, market research etc. Persuade your audience using this Multiple Steps To Create Corporate Advertising Strategy Designs PDF. This PPT design covers six stages, thus making it a great tool to use. It also caters to a variety of topics including Evaluate, Track, Improve, Executive Summary, Goal Determination. Download this PPT design now to present a convincing pitch that not only emphasizes the topic but also showcases your presentation skills.
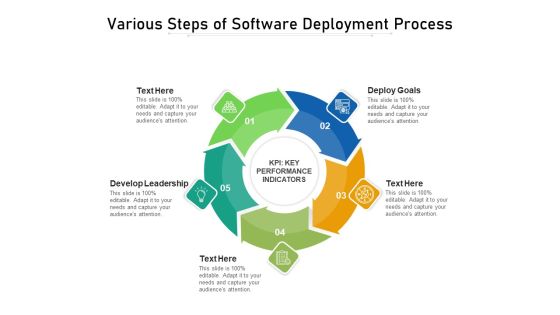
Various Steps Of Software Deployment Process Ppt PowerPoint Presentation Slides Design Ideas PDF
Presenting various steps of software deployment process ppt powerpoint presentation slides design ideas pdf to dispense important information. This template comprises five stages. It also presents valuable insights into the topics including deploy goals, develop leadership, kpi, key performance indicators. This is a completely customizable PowerPoint theme that can be put to use immediately. So, download it and address the topic impactfully.
Inventory Metrics Carrying Cost Order Inventory Delivered Unit Costs Ppt PowerPoint Presentation Icon Example
Presenting this set of slides with name inventory metrics carrying cost order inventory delivered unit costs ppt powerpoint presentation icon example. The topics discussed in these slides are availability kpi, availability dashboard, availability metrics. This is a completely editable PowerPoint presentation and is available for immediate download. Download now and impress your audience.
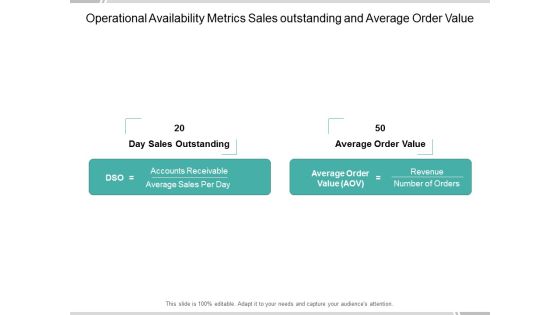
Operational Availability Metrics Sales Outstanding And Average Order Value Ppt PowerPoint Presentation Ideas Tips
Presenting this set of slides with name operational availability metrics sales outstanding and average order value ppt powerpoint presentation ideas tips. The topics discussed in these slides are availability kpi, availability dashboard, availability metrics. This is a completely editable PowerPoint presentation and is available for immediate download. Download now and impress your audience.
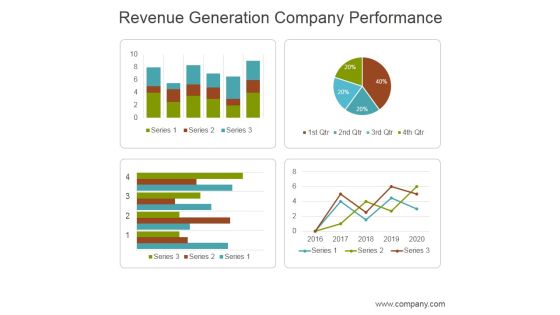
Revenue Generation Company Performance Ppt PowerPoint Presentation Layouts
This is a revenue generation company performance ppt powerpoint presentation layouts. This is a four stage process. The stages in this process are business, marketing, management, revenue, performance.
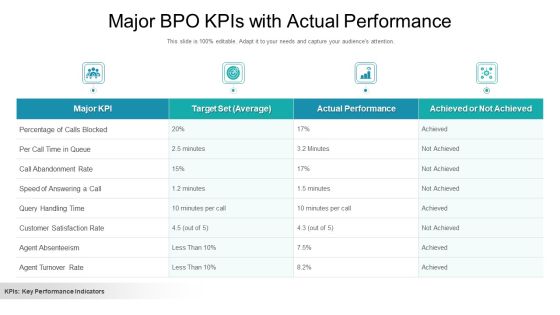
Major BPO Kpis With Actual Performance Ppt Inspiration Infographic Template PDF
Showcasing this set of slides titled major bpo kpis with actual performance ppt inspiration infographic template pdf. The topics addressed in these templates are target, actual performance, major kpi. All the content presented in this PPT design is completely editable. Download it and make adjustments in color, background, font etc. as per your unique business setting.

Cascade Framework With Focus Areas Ppt PowerPoint Presentation File Example Topics PDF
Showcasing this set of slides titled cascade framework with focus areas ppt powerpoint presentation file example topics pdf. The topics addressed in these templates are vision, value, focus area, objective, project, kpi. All the content presented in this PPT design is completely editable. Download it and make adjustments in color, background, font etc. as per your unique business setting.

KPIs Associated With IT Simplification Projects Ppt PowerPoint Presentation Sample
Presenting this set of slides with name kpis associated with it simplification projects ppt powerpoint presentation sample. The topics discussed in these slides are kpi, before simplification initiative, after simplification initiative, improvement. This is a completely editable PowerPoint presentation and is available for immediate download. Download now and impress your audience.
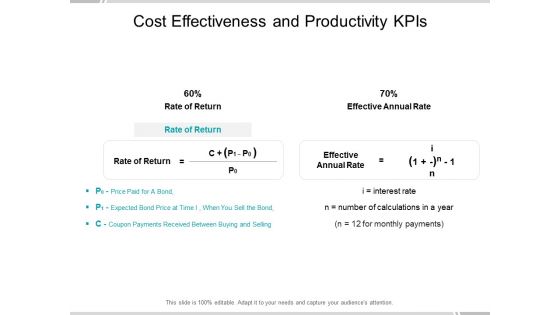
Cost Effectiveness And Productivity Kpis Ppt PowerPoint Presentationmodel Brochure
Presenting this set of slides with name cost effectiveness and productivity kpis ppt powerpoint presentationmodel brochure. The topics discussed in these slides are availability kpi, availability dashboard, availability metrics. This is a completely editable PowerPoint presentation and is available for immediate download. Download now and impress your audience.
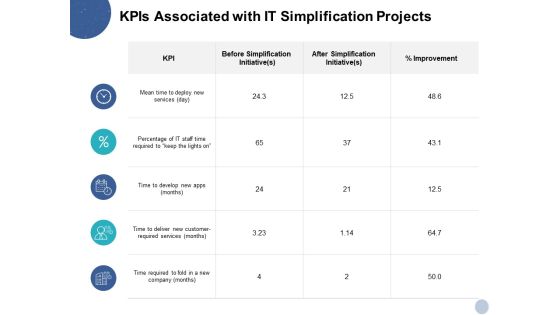
Kpis Associated With IT Simplification Projects Ppt PowerPoint Presentation Model Skills
Presenting this set of slides with name kpis associated with it simplification projects ppt powerpoint presentation model skills. The topics discussed in these slides are kpi, before simplification initiative, after simplification initiative, improvement. This is a completely editable PowerPoint presentation and is available for immediate download. Download now and impress your audience.

Revenue Planning Framework With Inventory Management Ppt PowerPoint Presentation Show Smartart
Presenting this set of slides with name revenue planning framework with inventory management ppt powerpoint presentation show smartart. This is a four stage process. The stages in this process are revenue forecasting, pricing, inventory management, reporting, tracking kpi. This is a completely editable PowerPoint presentation and is available for immediate download. Download now and impress your audience.

Operational Business Strategy With Review And Feedback Mechanism Ppt PowerPoint Presentation File Files PDF
Presenting this set of slides with name operational business strategy with review and feedback mechanism ppt powerpoint presentation file files pdf. This is a four stage process. The stages in this process are business needs and kpi, define operating mechanism, review and feedback mechanism. This is a completely editable PowerPoint presentation and is available for immediate download. Download now and impress your audience.

Three Stages Of Operating Plan Ppt PowerPoint Presentation Ideas Smartart PDF
Presenting this set of slides with name three stages of operating plan ppt powerpoint presentation ideas smartart pdf. This is a three stage process. The stages in this process are business needs and kpi, define operating mechanism, review and feedback mechanism. This is a completely editable PowerPoint presentation and is available for immediate download. Download now and impress your audience.
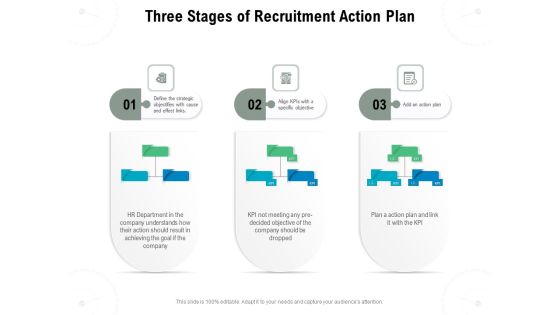
Three Stages Of Recruitment Action Plan Ppt PowerPoint Presentation Model Slides PDF
Presenting this set of slides with name three stages of recruitment action plan ppt powerpoint presentation model slides pdf. This is a three stage process. The stages in this process are hr department, kpi, objective, plan action plan. This is a completely editable PowerPoint presentation and is available for immediate download. Download now and impress your audience.

Kaizen Process Report With Improvement Metrics Ppt PowerPoint Presentation File Icons PDF
This slide focuses on the kaizen event report which covers process owner, key performance indicators, summary, problem description, improvement metrics, goals, daily milestones, team members and other considerations, etc. Pitch your topic with ease and precision using this Kaizen Process Report With Improvement Metrics Ppt PowerPoint Presentation File Icons PDF. This layout presents information on Key Performance Indoctrinator, Improvement Goal, Improvement Metric. It is also available for immediate download and adjustment. So, changes can be made in the color, design, graphics or any other component to create a unique layout.
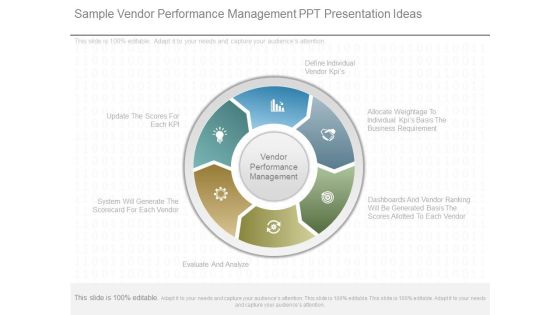
Sample Vendor Performance Management Ppt Presentation Ideas
This is a sample vendor performance management ppt presentation ideas. This is a six stage process. The stages in this process are update the scores for each kpi, system will generate the scorecard for each vendor, dashboards and vendor ranking will be generated basis the scores allotted to each vendor, allocate weightage to individual kpis basis the business requirement, define individual vendor kpis.
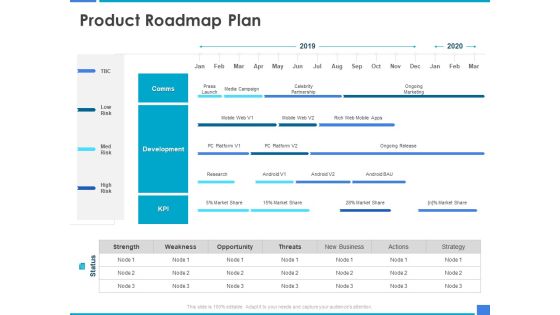
Product Strategy And Product Management Implementation Product Roadmap Plan Ppt Model Graphics Design PDF
Presenting this set of slides with name product strategy and product management implementation product roadmap plan ppt model graphics design pdf. The topics discussed in these slides are comms, development, kpi, strength, weakness, opportunity, threats, new business, actions, strategy. This is a completely editable PowerPoint presentation and is available for immediate download. Download now and impress your audience.

Account Payable Metrics With Overdue Suppliers Ppt PowerPoint Presentation Ideas Graphics Download PDF
Presenting this set of slides with name account payable metrics with overdue suppliers ppt powerpoint presentation ideas graphics download pdf. The topics discussed in these slides are overdue suppliers, bank balance vs amount due, total amount due, current bank balance, quarter, period, age summary, sales vs due and overdue creditors, top 5 creditors. This is a completely editable PowerPoint presentation and is available for immediate download. Download now and impress your audience.

Balance Sheet Metrics With Equity And Debt Ratio Ppt PowerPoint Presentation Infographics Background Image PDF
Presenting this set of slides with name balance sheet metrics with equity and debt ratio ppt powerpoint presentation infographics background image pdf. The topics discussed in these slides are total accounts receivable, total accounts payable, equity ratio, debt equity, current ratio, profit and loss summary, total accounts receivable and payable aging. This is a completely editable PowerPoint presentation and is available for immediate download. Download now and impress your audience.

Eight Stages Operational Business Strategy With Review And Feedback Mechanism Ppt PowerPoint Presentation Outline Deck PDF
Presenting this set of slides with name eight stages operational business strategy with review and feedback mechanism ppt powerpoint presentation outline deck pdf. This is a eight stage process. The stages in this process are business needs and kpi, define operating mechanism, review and feedback mechanism. This is a completely editable PowerPoint presentation and is available for immediate download. Download now and impress your audience.

Business Framework Key Performance Indicators Of A Company PowerPoint Presentation
Our above diagram provides framework of key performance indicators for a company. This slide contains human hand drawing some objects for terms like innovation strategy, research, solution, management and leadership. Download this diagram to make professional presentations.
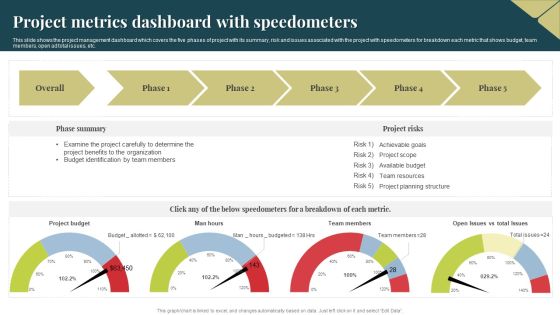
Project Metrics Dashboard With Speedometers Themes PDF
This slide shows the project management dashboard which covers the five phases of project with its summary, risk and issues associated with the project with speedometers for breakdown each metric that shows budget, team members, open ad total issues, etc. Showcasing this set of slides titled Project Metrics Dashboard With Speedometers Themes PDF. The topics addressed in these templates are Budget, Project Benefits, Organization. All the content presented in this PPT design is completely editable. Download it and make adjustments in color, background, font etc. as per your unique business setting.
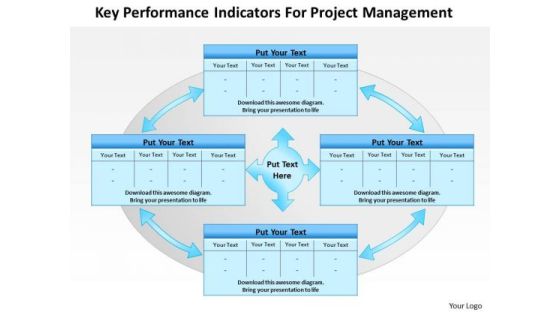
Business Framework Key Performance Indicators For Project Management PowerPoint Presentation
Our above diagram provides framework of key performance indicators for project management. It contains four interconnected text boxes. Download this diagram to make professional presentations on project management. This diagram enables the users to create their own display of the required processes in an easy way.
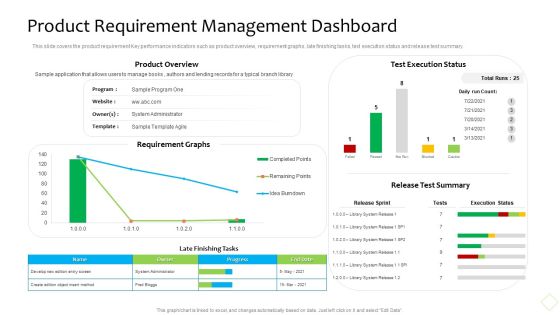
Product Demand Administration Product Requirement Management Dashboard Themes PDF
This slide covers the product requirement Key performance indicators such as product overview, requirement graphs, late finishing tasks, text execution status and release test summary. Deliver and pitch your topic in the best possible manner with this product demand administration product requirement management dashboard themes pdf. Use them to share invaluable insights on develop, progress, system and impress your audience. This template can be altered and modified as per your expectations. So, grab it now.
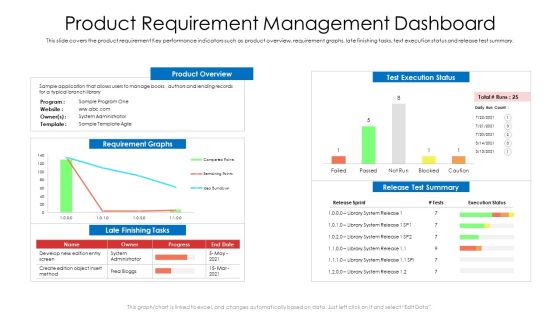
Product Requirement Management Dashboard Ppt Portfolio Clipart PDF
This slide covers the product requirement Key performance indicators such as product overview, requirement graphs, late finishing tasks, text execution status and release test summary. Deliver an awe-inspiring pitch with this creative product requirement management dashboard ppt portfolio clipart pdf bundle. Topics like product overview, requirement graphs, develop can be discussed with this completely editable template. It is available for immediate download depending on the needs and requirements of the user.

Product Requirement Management Dashboard Graphics PDF
This slide covers the product requirement Key performance indicators such as product overview, requirement graphs, late finishing tasks, text execution status and release test summary. Deliver and pitch your topic in the best possible manner with this product requirement management dashboard graphics pdf. Use them to share invaluable insights on product requirement management dashboard and impress your audience. This template can be altered and modified as per your expectations. So, grab it now.
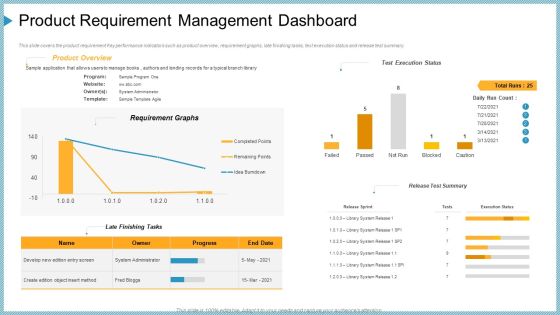
Product Requirement Management Dashboard Ppt File Slide PDF
This slide covers the product requirement Key performance indicators such as product overview, requirement graphs, late finishing tasks, text execution status and release test summary. Deliver an awe-inspiring pitch with this creative product requirement management dashboard ppt file slide pdf bundle. Topics like product requirement management dashboard can be discussed with this completely editable template. It is available for immediate download depending on the needs and requirements of the user.
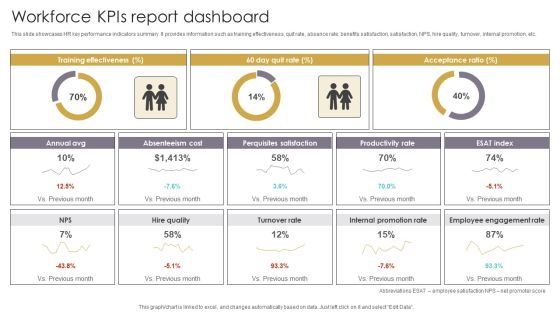
Workforce Kpis Report Dashboard Slides PDF
This slide showcases HR key performance indicators summary. It provides information such as training effectiveness, quit rate, absence rate, benefits satisfaction, satisfaction, NPS, hire quality, turnover, internal promotion, etc. Pitch your topic with ease and precision using this Workforce Kpis Report Dashboard Slides PDF. This layout presents information on Acceptance Ratio, Absenteeism Cost, Perquisites Satisfaction. It is also available for immediate download and adjustment. So, changes can be made in the color, design, graphics or any other component to create a unique layout.

Measuring Effectiveness Of Social Marketing Strategy Diagrams PDF
This slide represents the effectiveness of social marketing strategy illustrating customer journey, objectives, social media strategy, social activity, social KPI, and business impact.Pitch your topic with ease and precision using this Measuring Effectiveness Of Social Marketing Strategy Diagrams PDF This layout presents information on Customer Journey, Consideration, Inspire Evangelism It is also available for immediate download and adjustment. So, changes can be made in the color, design, graphics or any other component to create a unique layout.

Sales Quarterly Performance Review System Service Support Department Infographics PDF
This slide shows sales customer service division quarterly business review QBR. It provides information about quality, accuracy, absenteeism, attrition, call flow, employee tenure, etc. Pitch your topic with ease and precision using this Sales Quarterly Performance Review System Service Support Department Infographics PDF. This layout presents information on KPI, Goal, Quality Accuracy. It is also available for immediate download and adjustment. So, changes can be made in the color, design, graphics or any other component to create a unique layout.
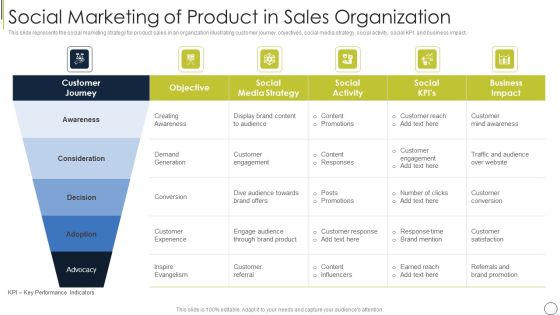
Social Marketing Of Product In Sales Organization Introduction PDF
This slide represents the social marketing strategy for product sales in an organization illustrating customer journey, objectives, social media strategy, social activity, social KPI, and business impact. Showcasing this set of slides titled social marketing of product in sales organization introduction pdf. The topics addressed in these templates are awareness, customer experience, social. All the content presented in this PPT design is completely editable. Download it and make adjustments in color, background, font etc. as per your unique business setting.
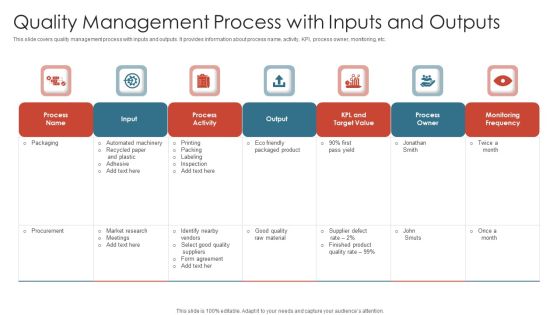
Quality Management Process With Inputs And Outputs Topics PDF
This slide covers quality management process with inputs and outputs. It provides information about process name, activity, KPI, process owner, monitoring, etc. Showcasing this set of slides titled quality management process with inputs and outputs topics pdf. The topics addressed in these templates are output, process owner, monitoring frequency. All the content presented in this PPT design is completely editable. Download it and make adjustments in color, background, font etc. as per your unique business setting.
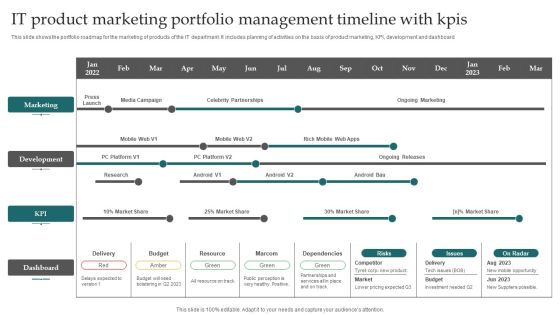
IT Product Marketing Portfolio Management Timeline With Kpis Elements PDF
This slide shows the portfolio roadmap for the marketing of products of the IT department. It includes planning of activities on the basis of product marketing, KPI, development and dashboard. Showcasing this set of slides titled IT Product Marketing Portfolio Management Timeline With Kpis Elements PDF. The topics addressed in these templates are Marketing, Development, Budget. All the content presented in this PPT design is completely editable. Download it and make adjustments in color, background, font etc. as per your unique business setting.
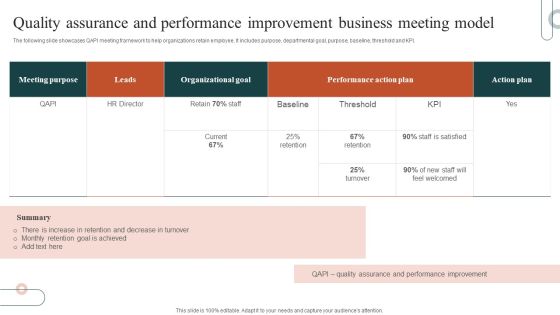
Quality Assurance And Performance Improvement Business Meeting Model Background PDF
The following slide showcases QAPI meeting framework to help organizations retain employee. It includes purpose, departmental goal, purpose, baseline, threshold and KPI. Showcasing this set of slides titled Quality Assurance And Performance Improvement Business Meeting Model Background PDF. The topics addressed in these templates are Organizational Goal, Performance Action Plan, Action Plan. All the content presented in this PPT design is completely editable. Download it and make adjustments in color, background, font etc. as per your unique business setting.
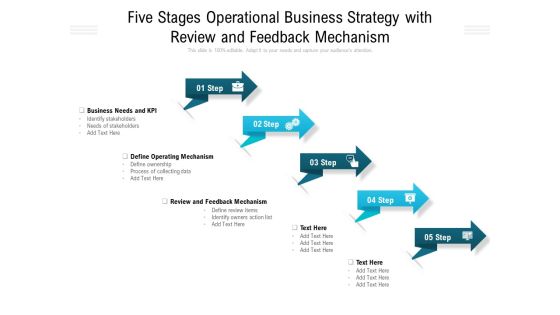
Five Stages Operational Business Strategy With Review And Feedback Mechanism Ppt PowerPoint Presentation Slides Example PDF
Presenting this set of slides with name five stages operational business strategy with review and feedback mechanism ppt powerpoint presentation slides example pdf. This is a five stage process. The stages in this process are business needs and kpi, define operating mechanism, review and feedback mechanism. This is a completely editable PowerPoint presentation and is available for immediate download. Download now and impress your audience.

Business Framework How To Measure Key Performance Indicator PowerPoint Presentation
This Power Point diagram slide has been crafted with graphic of flower petal diagram. This PPT slide contains the concept of measuring the key performance and indicate it. Use this PPT slide for your management related presentation.

Seven Stages Operational Business Strategy With Review And Feedback Mechanism Ppt PowerPoint Presentation Visual Aids Gallery PDF
Presenting this set of slides with name seven stages operational business strategy with review and feedback mechanism ppt powerpoint presentation visual aids gallery pdf. This is a seven stage process. The stages in this process are business needs and kpi, define operating mechanism, review and feedback mechanism. This is a completely editable PowerPoint presentation and is available for immediate download. Download now and impress your audience.
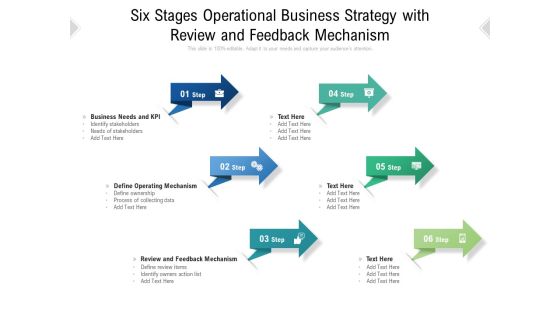
Six Stages Operational Business Strategy With Review And Feedback Mechanism Ppt PowerPoint Presentation File Slide Portrait PDF
Presenting this set of slides with name six stages operational business strategy with review and feedback mechanism ppt powerpoint presentation file slide portrait pdf. This is a six stage process. The stages in this process are business needs and kpi, define operating mechanism, review and feedback mechanism. This is a completely editable PowerPoint presentation and is available for immediate download. Download now and impress your audience.

Impact Of Feedback Received From Detractors On Customer NPS Metric Ppt Inspiration Visuals PDF
This slide illustrates statistics of net promoter score NPS in banking industry. It provides information about summary, personal banking, business banking and wealth management. Pitch your topic with ease and precision using this Impact Of Feedback Received From Detractors On Customer NPS Metric Ppt Inspiration Visuals PDF. This layout presents information on Business Environment, Feedback, Revenue. It is also available for immediate download and adjustment. So, changes can be made in the color, design, graphics or any other component to create a unique layout.
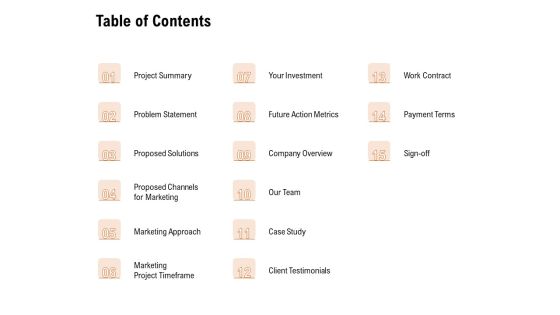
For Launching Company Site Table Of Contents Ppt PowerPoint Presentation Infographic Template Example File
Deliver an awe-inspiring pitch with this creative for launching company site table of contents ppt powerpoint presentation infographic template example file bundle. Topics like project summary, problem statement, proposed solutions, marketing approach, marketing project timeframe, case study, our team, future action metrics can be discussed with this completely editable template. It is available for immediate download depending on the needs and requirements of the user.
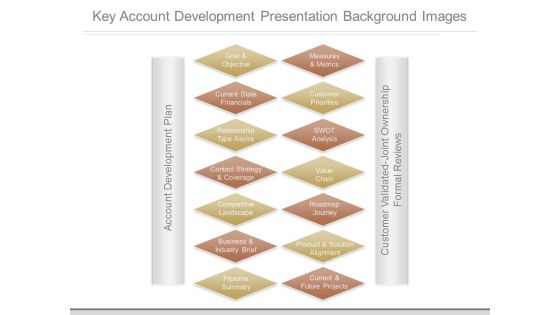
Key Account Development Presentation Background Images
This is a key account development presentation background images. This is a fourteen stage process. The stages in this process are goal and objective, current state financials, relationship type aspire, contact strategy and coverage, competitive landscape, business and industry brief, pipeline summary, measures and metrics, customer priorities, swot analysis, value chain, roadmap journey, product and solution alignment, current and future projects, account development plan, customer validated joint ownership formal reviews.

Product Development Status Icon With Bulb Ideas PDF
The following slide showcases dashboard that helps to track key performance indicators of product development. Key metrics covered overall progress, planning, design, development, testing, risks, summary, average handle time, overdue tasks, upcoming deadlines and projected launch date. Showcasing this set of slides titled Product Development Status Icon With Bulb Ideas PDF. The topics addressed in these templates are Design, Development, Planning. All the content presented in this PPT design is completely editable. Download it and make adjustments in color, background, font etc. as per your unique business setting.

Organisational Level Employee Key Performance Indicators Performance Indicators Rules PDF
The following slide highlights the organisational level staff key performance Indicators illustrating key headings KPI, description, benchmark and value. It also depicts revenue per employee, profit per FTE, human capital ROI, absenteeism rate and overtime per employee Showcasing this set of slides titled Organisational Level Employee Key Performance Indicators Performance Indicators Rules PDF The topics addressed in these templates are Revenue Compensation, Overtime Employee, Benchmark All the content presented in this PPT design is completely editable. Download it and make adjustments in color, background, font etc. as per your unique business setting.

Inventory Stock Out And Decline Of Sales Analysis Dashboard Inspiration PDF
Following slide presents a key performance indicating dashboard that can be used by businesses to track Inventory stock out and lost sales. Major key performance indicators are percentage stockouts, amount of sales, lost sales accountability, etc. Pitch your topic with ease and precision using this Inventory Stock Out And Decline Of Sales Analysis Dashboard Inspiration PDF. This layout presents information on Lost Sales Summary, Stock Out Details It is also available for immediate download and adjustment. So, changes can be made in the color, design, graphics or any other component to create a unique layout.

Various Stages For Business Process Transformation Ppt PowerPoint Presentation Model Slideshow PDF
Persuade your audience using this various stages for business process transformation ppt powerpoint presentation model slideshow pdf. This PPT design covers four stages, thus making it a great tool to use. It also caters to a variety of topics including identity and communicating the need for change, create team of experts, find the inefficient processes and define key performance indicators kpi, reengineer the processes and compare kpis. Download this PPT design now to present a convincing pitch that not only emphasizes the topic but also showcases your presentation skills.
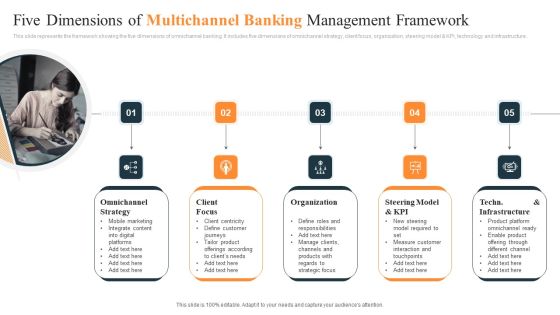
Five Dimensions Of Multichannel Banking Management Framework Ppt Outline Files PDF
This slide represents the framework showing the five dimensions of omnichannel banking. It includes five dimensions of omnichannel strategy, client focus, organization, steering model and KPI, technology and infrastructure. Persuade your audience using this Five Dimensions Of Multichannel Banking Management Framework Ppt Outline Files PDF. This PPT design covers five stages, thus making it a great tool to use. It also caters to a variety of topics including Omnichannel Strategy, Client Focus, Organization. Download this PPT design now to present a convincing pitch that not only emphasizes the topic but also showcases your presentation skills.
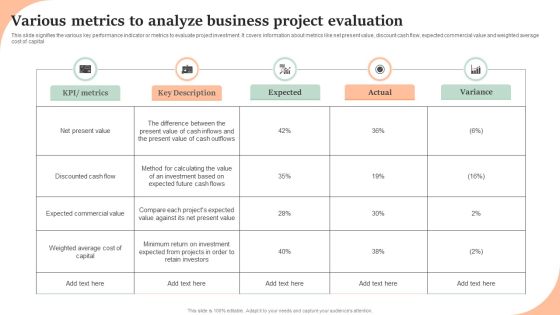
Various Metrics To Analyze Business Project Evaluation Inspiration PDF
This slide signifies the various key performance indicator or metrics to evaluate project investment. It covers information about metrics like net present value, discount cash flow, expected commercial value and weighted average cost of capital. Pitch your topic with ease and precision using this Various Metrics To Analyze Business Project Evaluation Inspiration PDF. This layout presents information on KPI, Metrics, Key Description, Expected, Actual, Variance. It is also available for immediate download and adjustment. So, changes can be made in the color, design, graphics or any other component to create a unique layout.

Key Performance Indicator Metrics Of Marketing Research Guidelines PDF
Following template showcases various key performance indicators which can be used by business organizations to track the effectiveness of their brand performance by conducting market research. The key performance indicators are response rate, net promoter score among many others. Showcasing this set of slides titled Key Performance Indicator Metrics Of Marketing Research Guidelines PDF. The topics addressed in these templates are Response Rate, Net Promoter Score, Customer Satisfaction Score . All the content presented in this PPT design is completely editable. Download it and make adjustments in color, background, font etc. as per your unique business setting.
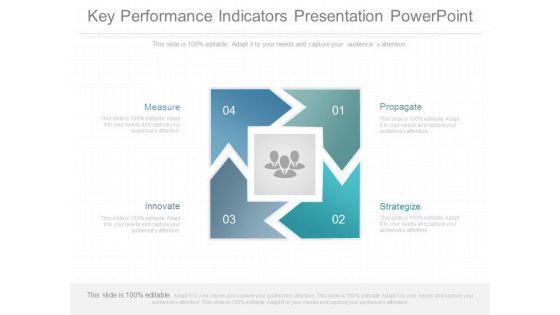
Key Performance Indicators Presentation Powerpoint
This is a key performance indicators presentation powerpoint. This is a four stage process. The stages in this process are measure, innovate, propagate, strategize.

It Operation Management Sheet With Status Icons PDF
This slide covers IT operations monitoring report. The purpose of this is to give an overview of information technology operations performance tracking. It includes elements such as status, tasks, KPI, target value, actual value and difference Showcasing this set of slides titled It Operation Management Sheet With Status Icons PDF. The topics addressed in these templates are Target Value, Actual Value, Difference. All the content presented in this PPT design is completely editable. Download it and make adjustments in color, background, font etc. as per your unique business setting.
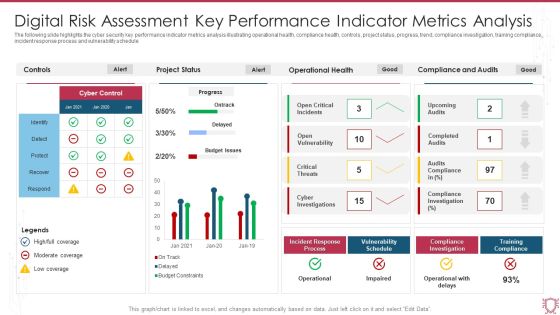
Digital Risk Assessment Key Performance Indicator Metrics Analysis Infographics PDF
The following slide highlights the cyber security key performance indicator metrics analysis illustrating operational health, compliance health, controls, project status, progress, trend, compliance investigation, training compliance, incident response process and vulnerability schedule. Showcasing this set of slides titled Digital Risk Assessment Key Performance Indicator Metrics Analysis Infographics PDF. The topics addressed in these templates are Project Status, Operational Health, Compliance And Audits. All the content presented in this PPT design is completely editable. Download it and make adjustments in color, background, font etc. as per your unique business setting.

Cyber Security Key Performance Indicators Metrics Dashboard Mockup PDF
This slide covers cyber security health status dashboard . It also includes audit and compliance, controls health, project status, incident response process, vulnerability patching schedule, investigation process and training compliance. Pitch your topic with ease and precision using this Cyber Security Key Performance Indicators Metrics Dashboard Mockup PDF. This layout presents information on Cyber Security, Vulnerability Patching Schedule, Compliance Investigation Process. It is also available for immediate download and adjustment. So, changes can be made in the color, design, graphics or any other component to create a unique layout.

Kpis To Measure Supply Chain Stock Management System Effectiveness Introduction PDF
This slide presents various metrics to analyze effectiveness of supply chain inventory control system. It includes key components such as KPI, actual performance, benchmark performance and strategies to improve. Showcasing this set of slides titled Kpis To Measure Supply Chain Stock Management System Effectiveness Introduction PDF. The topics addressed in these templates are Actual, Benchmark, Strategies To Improve. All the content presented in this PPT design is completely editable. Download it and make adjustments in color, background, font etc. as per your unique business setting.
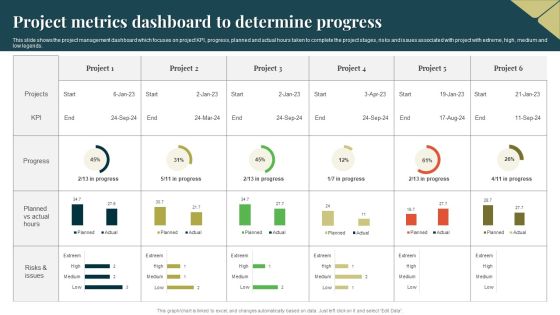
Project Metrics Dashboard To Determine Progress Guidelines PDF
This slide shows the project management dashboard which focuses on project KPI, progress, planned and actual hours taken to complete the project stages, risks and issues associated with project with extreme, high, medium and low legends. Showcasing this set of slides titled Project Metrics Dashboard To Determine Progress Guidelines PDF. The topics addressed in these templates are Project Metrics Dashboard, Determine Progress. All the content presented in this PPT design is completely editable. Download it and make adjustments in color, background, font etc. as per your unique business setting.
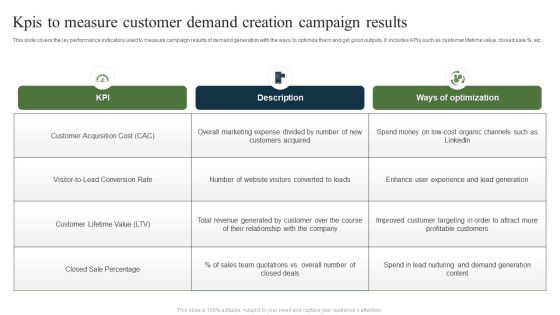
Kpis To Measure Customer Demand Creation Campaign Results Ppt Ideas Portrait PDF
This slide covers the ley performance indicators used to measure campaign results of demand generation with the ways to optimize them and get good outputs. It includes KPIs such as customer lifetime value, closed sale percent, etc. Pitch your topic with ease and precision using this Kpis To Measure Customer Demand Creation Campaign Results Ppt Ideas Portrait PDF. This layout presents information on KPI, Description, Ways Optimization, Customer Acquisition Cost. It is also available for immediate download and adjustment. So, changes can be made in the color, design, graphics or any other component to create a unique layout.
 Home
Home