Kpi Excel

Non Rural Water Resource Administration Water Management KPI Dashboard Showing Water Quality Test Results Clipart PDF
Deliver and pitch your topic in the best possible manner with this non rural water resource administration water management kpi dashboard showing water quality test results clipart pdf. Use them to share invaluable insights on water management kpi dashboard showing water quality test results and impress your audience. This template can be altered and modified as per your expectations. So, grab it now.
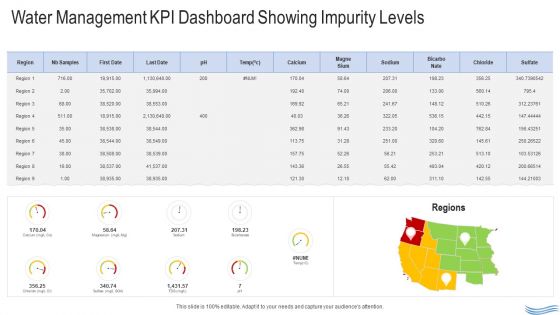
Water Quality Management Water Management KPI Dashboard Showing Impurity Levels Download PDF
Deliver an awe inspiring pitch with this creative water quality management water management kpi dashboard showing impurity levels download pdf bundle. Topics like water management kpi dashboard showing impurity levels can be discussed with this completely editable template. It is available for immediate download depending on the needs and requirements of the user.
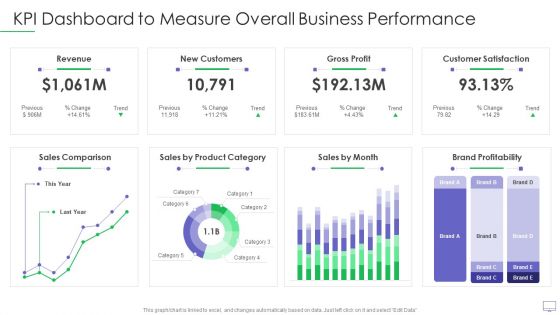
Guide For Software Developers KPI Dashboard To Measure Overall Business Performance Elements PDF
This graph or chart is linked to excel, and changes automatically based on data. Just left click on it and select Edit Data. Deliver an awe inspiring pitch with this creative guide for software developers kpi dashboard to measure overall business performance elements pdf bundle. Topics like revenue new customers, gross profit, customer satisfaction, sales comparison, brand profitability can be discussed with this completely editable template. It is available for immediate download depending on the needs and requirements of the user.

Software Developer Playbook Kpi Dashboard To Measure Overall Business Performance Topics PDF
This graph or chart is linked to excel, and changes automatically based on data. Just left click on it and select Edit Data. Deliver and pitch your topic in the best possible manner with this software developer playbook kpi dashboard to measure overall business performance topics pdf. Use them to share invaluable insights on revenue new customers, gross profit, customer satisfaction, sales comparison and impress your audience. This template can be altered and modified as per your expectations. So, grab it now.

Firm KPI Dashboard With Program Progress Report Ppt Pictures Deck PDF
This graph or chart is linked to excel, and changes automatically based on data. Just left click on it and select Edit Data. Showcasing this set of slides titled Firm KPI Dashboard With Program Progress Report Ppt Pictures Deck PDF. The topics addressed in these templates are Budget By Employee, Total Budget, 3 Overdue Tasks, Workload. All the content presented in this PPT design is completely editable. Download it and make adjustments in color, background, font etc. as per your unique business setting.

Firm Management KPI Dashboard With Marketing Program Report Ppt Styles Introduction PDF
This graph or chart is linked to excel, and changes automatically based on data. Just left click on it and select Edit Data. Showcasing this set of slides titled Firm Management KPI Dashboard With Marketing Program Report Ppt Styles Introduction PDF. The topics addressed in these templates are Google Rankings, Google Change, Warnings, Visitors. All the content presented in this PPT design is completely editable. Download it and make adjustments in color, background, font etc. as per your unique business setting.

Help Desk Call Centre Service Level Agreement KPI Dashboard Pictures PDF
This graph or chart is linked to excel, and changes automatically based on data. Just left click on it and select Edit Data. Showcasing this set of slides titled Help Desk Call Centre Service Level Agreement KPI Dashboard Pictures PDF. The topics addressed in these templates are Call Type Today, Occupancy Today, Call Summary Today. All the content presented in this PPT design is completely editable. Download it and make adjustments in color, background, font etc. as per your unique business setting.

Service Level Agreement KPI Dashboard With Breached Summary Assessment Professional PDF
This graph or chart is linked to excel, and changes automatically based on data. Just left click on it and select Edit Data. Pitch your topic with ease and precision using this Service Level Agreement KPI Dashboard With Breached Summary Assessment Professional PDF. This layout presents information on Resolution Statistics, Service Desk Demo, Breached Summary. It is also available for immediate download and adjustment. So, changes can be made in the color, design, graphics or any other component to create a unique layout.

Service Level Agreement KPI Dashboard With Closed And Resolved Tickets Statistics Inspiration PDF
This graph or chart is linked to excel, and changes automatically based on data. Just left click on it and select Edit Data. Showcasing this set of slides titled Service Level Agreement KPI Dashboard With Closed And Resolved Tickets Statistics Inspiration PDF. The topics addressed in these templates are Tickets Priority, Tickets Source, Resolved Tickets. All the content presented in this PPT design is completely editable. Download it and make adjustments in color, background, font etc. as per your unique business setting.
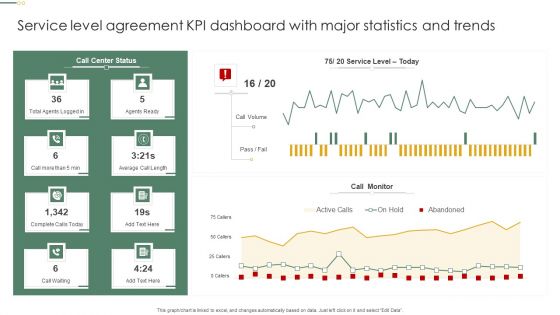
Service Level Agreement KPI Dashboard With Major Statistics And Trends Pictures PDF
This graph or chart is linked to excel, and changes automatically based on data. Just left click on it and select Edit Data. Pitch your topic with ease and precision using this Service Level Agreement KPI Dashboard With Major Statistics And Trends Pictures PDF. This layout presents information on Call Monitor, Call Volume, Agents Ready. It is also available for immediate download and adjustment. So, changes can be made in the color, design, graphics or any other component to create a unique layout.
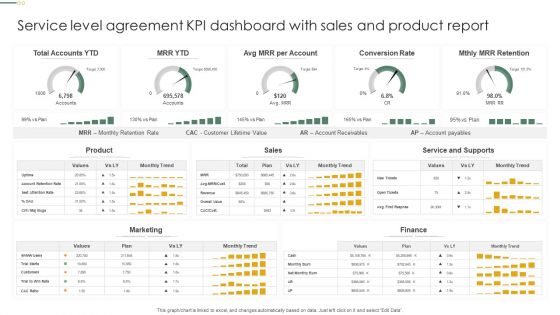
Service Level Agreement KPI Dashboard With Sales And Product Report Clipart PDF
This graph or chart is linked to excel, and changes automatically based on data. Just left click on it and select Edit Data. Showcasing this set of slides titled Service Level Agreement KPI Dashboard With Sales And Product Report Clipart PDF. The topics addressed in these templates are Total Accounts YTD, Conversion Rate, Mthly MRR Retention. All the content presented in this PPT design is completely editable. Download it and make adjustments in color, background, font etc. as per your unique business setting.
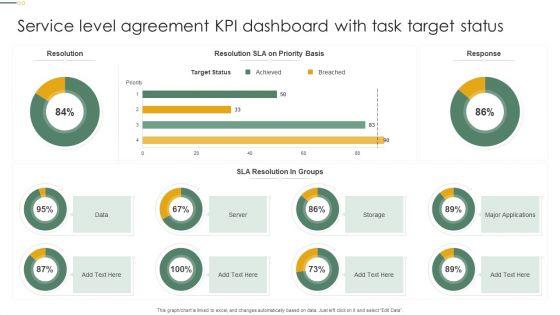
Service Level Agreement KPI Dashboard With Task Target Status Microsoft PDF
This graph or chart is linked to excel, and changes automatically based on data. Just left click on it and select Edit Data. Pitch your topic with ease and precision using this Service Level Agreement KPI Dashboard With Task Target Status Microsoft PDF. This layout presents information on Target Status, Sla Resolution, Groups, Server. It is also available for immediate download and adjustment. So, changes can be made in the color, design, graphics or any other component to create a unique layout.
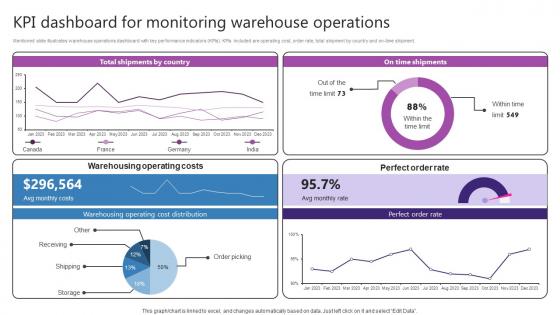
KPI Dashboard For Monitoring Warehouse Operations Strategic Plan For Enhancing Inspiration Pdf
Mentioned slide illustrates warehouse operations dashboard with key performance indicators KPIs. KPIs included are operating cost, order rate, total shipment by country and on-time shipment. Retrieve professionally designed KPI Dashboard For Monitoring Warehouse Operations Strategic Plan For Enhancing Inspiration Pdf to effectively convey your message and captivate your listeners. Save time by selecting pre-made slideshows that are appropriate for various topics, from business to educational purposes. These themes come in many different styles, from creative to corporate, and all of them are easily adjustable and can be edited quickly. Access them as PowerPoint templates or as Google Slides themes. You do not have to go on a hunt for the perfect presentation because Slidegeeks got you covered from everywhere.

Manufacturing KPI Dashboard For Process Manufacturing Strategy Driving Industry 4 0
The following slide highlights manufacturing and production key performance indicators to track and manage processes. It includes elements such as downtime causes, production volume by machinery, number of returned items, missing parts, service, poor quality etc. Boost your pitch with our creative Manufacturing KPI Dashboard For Process Manufacturing Strategy Driving Industry 4 0. Deliver an awe-inspiring pitch that will mesmerize everyone. Using these presentation templates you will surely catch everyones attention. You can browse the ppts collection on our website. We have researchers who are experts at creating the right content for the templates. So you do not have to invest time in any additional work. Just grab the template now and use them.
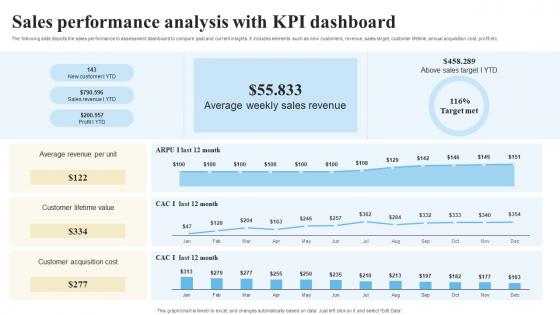
Sales Performance Analysis With KPI Objectives And Key Result Methodology For Business
The following slide depicts the sales performance to assessment dashboard to compare past and current insights. It includes elements such as new customers, revenue, sales target, customer lifetime, annual acquisition cost, profit etc. Do you know about Slidesgeeks Sales Performance Analysis With KPI Objectives And Key Result Methodology For Business These are perfect for delivering any kind od presentation. Using it, create PowerPoint presentations that communicate your ideas and engage audiences. Save time and effort by using our pre-designed presentation templates that are perfect for a wide range of topic. Our vast selection of designs covers a range of styles, from creative to business, and are all highly customizable and easy to edit. Download as a PowerPoint template or use them as Google Slides themes.

Sales Order Summary KPI Dashboard How To Improve Company PPT Sample Strategy SS V
The following slide showcases monthly and half-yearly order summary. It includes elements such as revenue days, refund, transaction status, paid, unpaid, subscriptions, current and previous details, etc. Do you know about Slidesgeeks Sales Order Summary KPI Dashboard How To Improve Company PPT Sample Strategy SS V These are perfect for delivering any kind od presentation. Using it, create PowerPoint presentations that communicate your ideas and engage audiences. Save time and effort by using our pre-designed presentation templates that are perfect for a wide range of topic. Our vast selection of designs covers a range of styles, from creative to business, and are all highly customizable and easy to edit. Download as a PowerPoint template or use them as Google Slides themes.
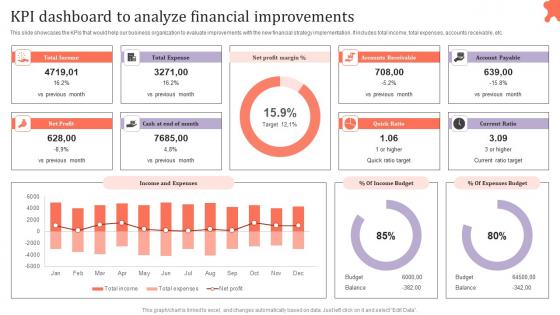
KPI Dashboard To Analyze Financial Assessing Corporate Financial Techniques Clipart Pdf
This slide showcases the KPIs that would help our business organization to evaluate improvements with the new financial strategy implementation. It includes total income, total expenses, accounts receivable, etc. Retrieve professionally designed KPI Dashboard To Analyze Financial Assessing Corporate Financial Techniques Clipart Pdf to effectively convey your message and captivate your listeners. Save time by selecting pre made slideshows that are appropriate for various topics, from business to educational purposes. These themes come in many different styles, from creative to corporate, and all of them are easily adjustable and can be edited quickly. Access them as PowerPoint templates or as Google Slides themes. You do not have to go on a hunt for the perfect presentation because Slidegeeks got you covered from everywhere.
Strategic Financial Planning And Administration KPI Dashboard Analyze Financial Improvements Icons PDF
This slide showcases the KPIs that would help our business organization to evaluate improvements with the new financial strategy implementation. It includes total income, total expenses, accounts receivable, etc. Retrieve professionally designed Strategic Financial Planning And Administration KPI Dashboard Analyze Financial Improvements Icons PDF to effectively convey your message and captivate your listeners. Save time by selecting pre-made slideshows that are appropriate for various topics, from business to educational purposes. These themes come in many different styles, from creative to corporate, and all of them are easily adjustable and can be edited quickly. Access them as PowerPoint templates or as Google Slides themes. You do not have to go on a hunt for the perfect presentation because Slidegeeks got you covered from everywhere.
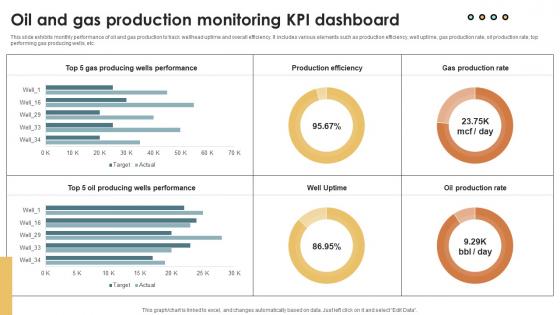
IoT Solutions For Oil Oil And Gas Production Monitoring KPI Dashboard IoT SS V
This slide exhibits monthly performance of oil and gas production to track wellhead uptime and overall efficiency. It includes various elements such as production efficiency, well uptime, gas production rate, oil production rate, top performing gas producing wells, etc. Take your projects to the next level with our ultimate collection of IoT Solutions For Oil Oil And Gas Production Monitoring KPI Dashboard IoT SS V. Slidegeeks has designed a range of layouts that are perfect for representing task or activity duration, keeping track of all your deadlines at a glance. Tailor these designs to your exact needs and give them a truly corporate look with your own brand colors they will make your projects stand out from the rest
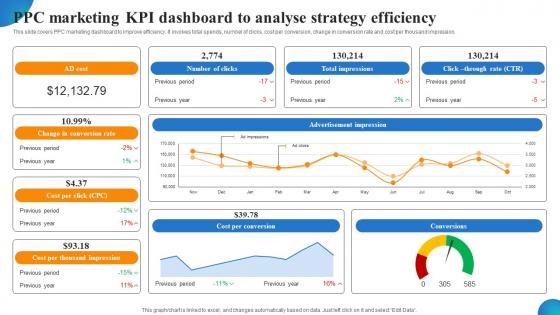
PPC Marketing KPI Dashboard To Analyse Strategy Efficiency MDSS For Enhanced Slides Pdf
This slide covers PPC marketing dashboard to improve efficiency. It involves total spends, number of clicks, cost per conversion, change in conversion rate and cost per thousand impression. Retrieve professionally designed PPC Marketing KPI Dashboard To Analyse Strategy Efficiency MDSS For Enhanced Slides Pdf to effectively convey your message and captivate your listeners. Save time by selecting pre-made slideshows that are appropriate for various topics, from business to educational purposes. These themes come in many different styles, from creative to corporate, and all of them are easily adjustable and can be edited quickly. Access them as PowerPoint templates or as Google Slides themes. You do not have to go on a hunt for the perfect presentation because Slidegeeks got you covered from everywhere.

SMS Marketing Result Assessment With KPI Evaluating Strengths And Weaknesses Formats Pdf
The following slide depicts the key outcomes of SMS promotion strategy to track its effectiveness. It includes elements such as sales graph, metrics, order, marketing subscribers, average order value, SMS sent, revenue per click, conversion rate, return on investment etc. Take your projects to the next level with our ultimate collection of SMS Marketing Result Assessment With KPI Evaluating Strengths And Weaknesses Formats Pdf. Slidegeeks has designed a range of layouts that are perfect for representing task or activity duration, keeping track of all your deadlines at a glance. Tailor these designs to your exact needs and give them a truly corporate look with your own brand colors they all make your projects stand out from the rest.
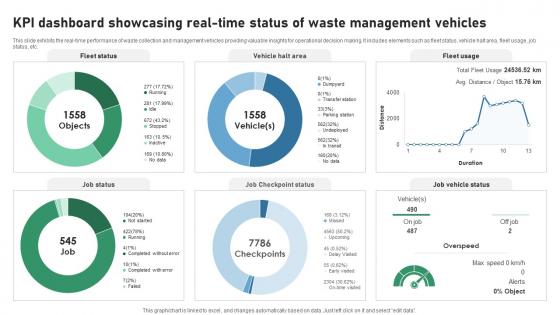
KPI Dashboard Showcasing Real Time Status Of Waste IOT Applications In Smart Waste IoT SS V
This slide exhibits the real-time performance of waste collection and management vehicles providing valuable insights for operational decision making. It includes elements such as fleet status, vehicle halt area, fleet usage, job status, etc. Take your projects to the next level with our ultimate collection of KPI Dashboard Showcasing Real Time Status Of Waste IOT Applications In Smart Waste IoT SS V. Slidegeeks has designed a range of layouts that are perfect for representing task or activity duration, keeping track of all your deadlines at a glance. Tailor these designs to your exact needs and give them a truly corporate look with your own brand colors they will make your projects stand out from the rest
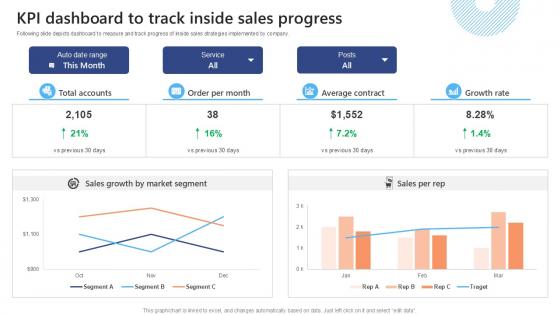
KPI Dashboard To Track Inside Effective Strategies To Succeed At Virtual Ppt PowerPoint SA SS V
Following slide depicts dashboard to measure and track progress of inside sales strategies implemented by company. Retrieve professionally designed KPI Dashboard To Track Inside Effective Strategies To Succeed At Virtual Ppt PowerPoint SA SS V to effectively convey your message and captivate your listeners. Save time by selecting pre-made slideshows that are appropriate for various topics, from business to educational purposes. These themes come in many different styles, from creative to corporate, and all of them are easily adjustable and can be edited quickly. Access them as PowerPoint templates or as Google Slides themes. You do not have to go on a hunt for the perfect presentation because Slidegeeks got you covered from everywhere.
Vector Showing Data Quality Measurement With KPI Metrics Ppt PowerPoint Presentation Model Gridlines PDF
Persuade your audience using this vector showing data quality measurement with kpi metrics ppt powerpoint presentation model gridlines pdf. This PPT design covers four stages, thus making it a great tool to use. It also caters to a variety of topics including vector showing data quality measurement with kpi metrics. Download this PPT design now to present a convincing pitch that not only emphasizes the topic but also showcases your presentation skills.
Water Quality Management Water Management KPI Metrics Showing Domestic Water Consumption Icons PDF
This is a water quality management water management kpi metrics showing domestic water consumption icons pdf template with various stages. Focus and dispense information on three stages using this creative set, that comes with editable features. It contains large content boxes to add your information on topics like water management kpi metrics showing domestic water consumption. You can also showcase facts, figures, and other relevant content using this PPT layout. Grab it now.

Quality Monitoring Kpi Dashboard For Building And Construction Sector Portrait PDF
This slide covers quality monitoring KPI dashboard for construction industry. It involves data such as non conformance report, standard operating procedures, site inspection and quality training. Showcasing this set of slides titled Quality Monitoring Kpi Dashboard For Building And Construction Sector Portrait PDF. The topics addressed in these templates are Non Conformance Report, Standard Operating, Procedures. All the content presented in this PPT design is completely editable. Download it and make adjustments in color, background, font etc. as per your unique business setting.
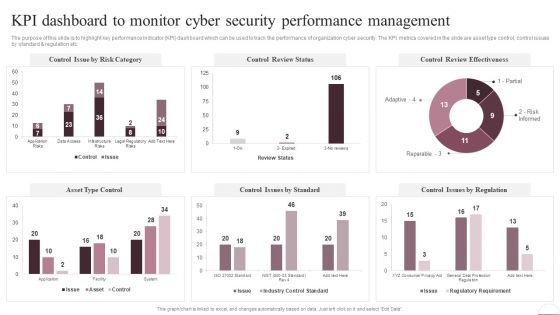
Prevention Of Information KPI Dashboard To Monitor Cyber Security Performance Information PDF
The purpose of this slide is to highlight key performance indicator KPI dashboard which can be used to track the performance of organization cyber security. The KPI metrics covered in the slide are asset type control, control issues by standard AND regulation etc. This Prevention Of Information KPI Dashboard To Monitor Cyber Security Performance Information PDF is perfect for any presentation, be it in front of clients or colleagues. It is a versatile and stylish solution for organizing your meetings. The Prevention Of Information KPI Dashboard To Monitor Cyber Security Performance Information PDF features a modern design for your presentation meetings. The adjustable and customizable slides provide unlimited possibilities for acing up your presentation. Slidegeeks has done all the homework before launching the product for you. So, dont wait, grab the presentation templates today
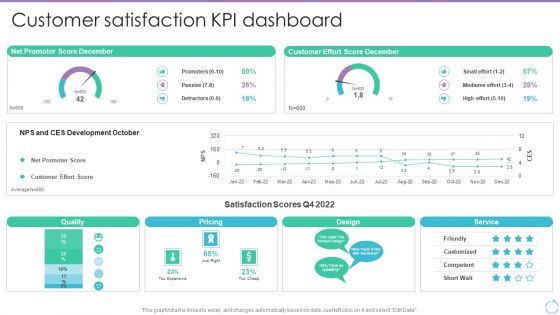
Personal Branding Plan For Executives Customer Satisfaction KPI Dashboard Graphics PDF
This graph or chart is linked to excel, and changes automatically based on data. Just left click on it and select Edit Data. Whether you have daily or monthly meetings, a brilliant presentation is necessary. Personal Branding Plan For Executives Customer Satisfaction KPI Dashboard Graphics PDF can be your best option for delivering a presentation. Represent everything in detail using Personal Branding Plan For Executives Customer Satisfaction KPI Dashboard Graphics PDF and make yourself stand out in meetings. The template is versatile and follows a structure that will cater to your requirements. All the templates prepared by Slidegeeks are easy to download and edit. Our research experts have taken care of the corporate themes as well. So, give it a try and see the results.
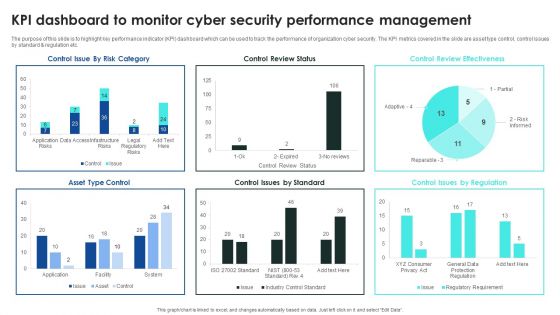
Implementing Cybersecurity Awareness Program To Prevent Attacks KPI Dashboard To Monitor Cyber Security Introduction PDF
The purpose of this slide is to highlight key performance indicator KPI dashboard which can be used to track the performance of organization cyber security. The KPI metrics covered in the slide are asset type control, control issues by standard and regulation etc. This Implementing Cybersecurity Awareness Program To Prevent Attacks KPI Dashboard To Monitor Cyber Security Introduction PDF is perfect for any presentation, be it in front of clients or colleagues. It is a versatile and stylish solution for organizing your meetings. The Implementing Cybersecurity Awareness Program To Prevent Attacks KPI Dashboard To Monitor Cyber Security Introduction PDF features a modern design for your presentation meetings. The adjustable and customizable slides provide unlimited possibilities for acing up your presentation. Slidegeeks has done all the homework before launching the product for you. So, do not wait, grab the presentation templates today
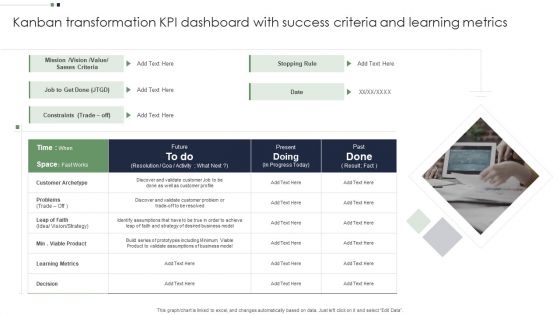
Kanban Transformation KPI Dashboard With Success Criteria And Learning Metrics Microsoft PDF
Persuade your audience using this Kanban Transformation KPI Dashboard With Success Criteria And Learning Metrics Microsoft PDF. This PPT design covers one stages, thus making it a great tool to use. It also caters to a variety of topics including Kanban Transformation KPI Dashboard, Success Criteria Learning Metrics. Download this PPT design now to present a convincing pitch that not only emphasizes the topic but also showcases your presentation skills.
KPI Dashboard With Pen Vector Icon Ppt PowerPoint Presentation Professional Infographics PDF
Persuade your audience using this kpi dashboard with pen vector icon ppt powerpoint presentation professional infographics pdf. This PPT design covers three stages, thus making it a great tool to use. It also caters to a variety of topics including kpi dashboard with pen vector icon. Download this PPT design now to present a convincing pitch that not only emphasizes the topic but also showcases your presentation skills.

Security KPI Dashboard With Various Charts And Graphs Ppt Summary Background Image PDF
Persuade your audience using this Security KPI Dashboard With Various Charts And Graphs Ppt Summary Background Image PDF. This PPT design covers three stages, thus making it a great tool to use. It also caters to a variety of topics including Various Charts, Security KPI Dashboard, Graphs. Download this PPT design now to present a convincing pitch that not only emphasizes the topic but also showcases your presentation skills.
Service Level Agreement KPI Dashboard With Graph And Analytics Icon Inspiration PDF
Persuade your audience using this Service Level Agreement KPI Dashboard With Graph And Analytics Icon Inspiration PDF. This PPT design covers three stages, thus making it a great tool to use. It also caters to a variety of topics including Service Level, Agreement KPI Dashboard, Graph And Analytics, Icon. Download this PPT design now to present a convincing pitch that not only emphasizes the topic but also showcases your presentation skills.
Vendor Performance KPI Analytical Dashboard Icon For Data Management Background PDF
Persuade your audience using this Vendor Performance KPI Analytical Dashboard Icon For Data Management Background PDF. This PPT design covers three stages, thus making it a great tool to use. It also caters to a variety of topics including Vendor Performance, KPI Analytical Dashboard, Icon Data Management. Download this PPT design now to present a convincing pitch that not only emphasizes the topic but also showcases your presentation skills.

Supplier Scorecard Supplier Scorecard KPI Dashboard With Average Delivery And Quality Score Introduction PDF
This graph or chart is linked to excel, and changes automatically based on data. Just left click on it and select Edit Data. Deliver an awe inspiring pitch with this creative supplier scorecard supplier scorecard kpi dashboard with average delivery and quality score introduction pdf bundle. Topics like dollar spend over time, otd delivery, quality trend, purchase price variance, total expenditure can be discussed with this completely editable template. It is available for immediate download depending on the needs and requirements of the user.
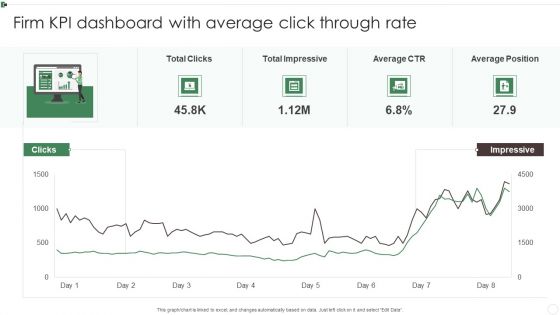
Firm KPI Dashboard With Average Click Through Rate Ppt Inspiration Sample PDF
This graph or chart is linked to excel, and changes automatically based on data. Just left click on it and select Edit Data. Pitch your topic with ease and precision using this Firm KPI Dashboard With Average Click Through Rate Ppt Inspiration Sample PDF. This layout presents information on Total Clicks, Total Impressive, Average CTR, Average Position. It is also available for immediate download and adjustment. So, changes can be made in the color, design, graphics or any other component to create a unique layout.
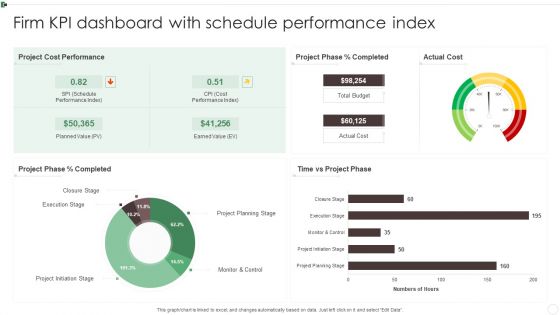
Firm KPI Dashboard With Schedule Performance Index Ppt Visual Aids PDF
This graph or chart is linked to excel, and changes automatically based on data. Just left click on it and select Edit Data. Pitch your topic with ease and precision using this Firm KPI Dashboard With Schedule Performance Index Ppt Visual Aids PDF. This layout presents information on Project Cost Performance, Project Planning Stage, Monitor And Control. It is also available for immediate download and adjustment. So, changes can be made in the color, design, graphics or any other component to create a unique layout.

Service Level Agreement KPI Dashboard Indicating Violation Count And Overdue Requests Diagrams PDF
This graph or chart is linked to excel, and changes automatically based on data. Just left click on it and select Edit Data. Showcasing this set of slides titled Service Level Agreement KPI Dashboard Indicating Violation Count And Overdue Requests Diagrams PDF. The topics addressed in these templates are Total Requests Category, Total Requests Status, Urgent Requests. All the content presented in this PPT design is completely editable. Download it and make adjustments in color, background, font etc. as per your unique business setting.

Service Level Agreement KPI Dashboard With Current Risk Statistics Topics PDF
This graph or chart is linked to excel, and changes automatically based on data. Just left click on it and select Edit Data. Pitch your topic with ease and precision using this Service Level Agreement KPI Dashboard With Current Risk Statistics Topics PDF. This layout presents information on Current Risk SLAS, Current Breached Slas, Personal Active SLA It is also available for immediate download and adjustment. So, changes can be made in the color, design, graphics or any other component to create a unique layout.
KPI Framework For Quality Assurance Management Ppt PowerPoint Presentation File Icons PDF
This slide illustrates multiple key performance indicator framework for quality assurance management such as customer complaints, scrap rate, defects and yield. Quality assurance department plays a critical role in maintaining the superior quality of products. Pitch your topic with ease and precision using this kpi framework for quality assurance management ppt powerpoint presentation file icons pdf This layout presents information on kpi framework for quality assurance management . It is also available for immediate download and adjustment. So, changes can be made in the color, design, graphics or any other component to create a unique layout.

Agile Quality Control Framework IT Quality Control KPI Dashboard Template PDF
This slide shows the quality control dashboard to monitor the effectiveness of agile quality assurance model. It includes KPIs namely test execution summary, defect severity distribution, module wise text execution and defect severity index. Deliver and pitch your topic in the best possible manner with this agile quality control framework it quality control kpi dashboard template pdf. Use them to share invaluable insights on quality control kpi dashboard and impress your audience. This template can be altered and modified as per your expectations. So, grab it now.
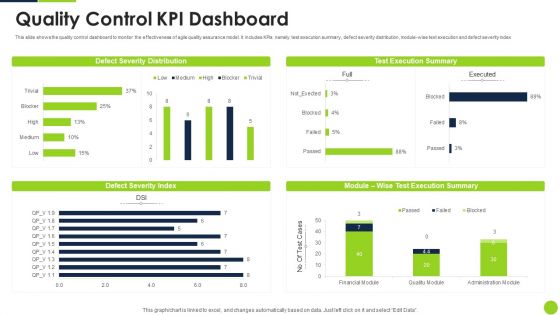
Agile Methodology Quality Control Quality Control KPI Dashboard Ppt Infographic Template Layout Ideas PDF
This slide shows the quality control dashboard to monitor the effectiveness of agile quality assurance model. It includes KPIs namely test execution summary, defect severity distribution, module-wise text execution and defect severity index Deliver an awe inspiring pitch with this creative agile methodology quality control quality control kpi dashboard ppt infographic template layout ideas pdf bundle. Topics like quality control kpi dashboard can be discussed with this completely editable template. It is available for immediate download depending on the needs and requirements of the user.
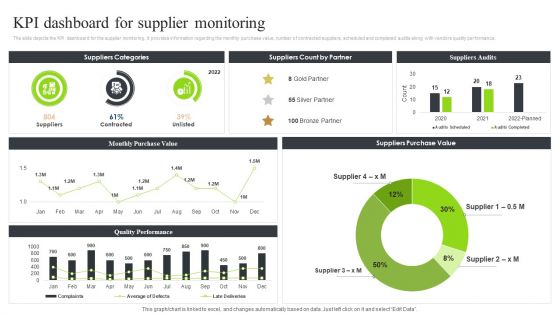
Strategic Sourcing And Supplier Quality Kpi Dashboard For Supplier Monitoring Graphics PDF
The slide depicts the KPI dashboard for the supplier monitoring. It provides information regarding the monthly purchase value, number of contracted suppliers, scheduled and completed audits along with vendors quality performance.Take your projects to the next level with our ultimate collection of Strategic Sourcing And Supplier Quality Kpi Dashboard For Supplier Monitoring Graphics PDF. Slidegeeks has designed a range of layouts that are perfect for representing task or activity duration, keeping track of all your deadlines at a glance. Tailor these designs to your exact needs and give them a truly corporate look with your own brand colors they all make your projects stand out from the rest.

Retail Outlet Opening To Enhance Product Sale Kpi Metrics Dashboard For New Retail Store Mockup PDF
The following slide showcases key performance indicator KPI dashboard for retail store. The dashboard covers major KPIs such as return resources, perfect order rate, total orders and top seller by orders. Do you have to make sure that everyone on your team knows about any specific topic I yes, then you should give Retail Outlet Opening To Enhance Product Sale Kpi Metrics Dashboard For New Retail Store Mockup PDF a try. Our experts have put a lot of knowledge and effort into creating this impeccable Retail Outlet Opening To Enhance Product Sale Kpi Metrics Dashboard For New Retail Store Mockup PDF. You can use this template for your upcoming presentations, as the slides are perfect to represent even the tiniest detail. You can download these templates from the Slidegeeks website and these are easy to edit. So grab these today.

KPI Dashboard To Track Performance Of Quality Assurance Management Topics PDF
Following slide demonstrates KPI dashboard for monitoring performance of quality management system for increase organisation performance. It includes elements such as complaints by customers, quality action by suppliers, quality actions by category, quality actions by category, etc. Showcasing this set of slides titled KPI Dashboard To Track Performance Of Quality Assurance Management Topics PDF. The topics addressed in these templates are Corrective Preventive Action, Quality Actions Supplier, Quality Actions Category. All the content presented in this PPT design is completely editable. Download it and make adjustments in color, background, font etc. as per your unique business setting.
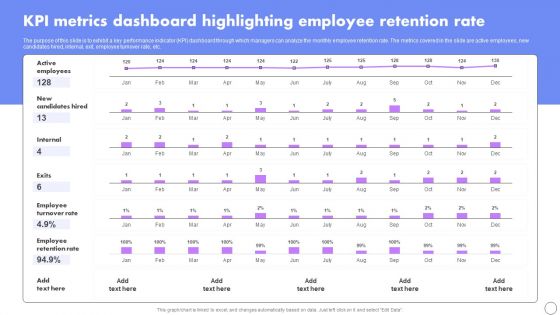
KPI Metrics Dashboard Highlighting Employee Retention Rate Developing Employee Retention Techniques Sample PDF
The purpose of this slide is to exhibit a key performance indicator KPI dashboard through which managers can analyze the monthly employee retention rate. The metrics covered in the slide are active employees, new candidates hired, internal, exit, employee turnover rate, etc.Do you have to make sure that everyone on your team knows about any specific topic I yes, then you should give KPI Metrics Dashboard Highlighting Employee Retention Rate Developing Employee Retention Techniques Sample PDF a try. Our experts have put a lot of knowledge and effort into creating this impeccable KPI Metrics Dashboard Highlighting Employee Retention Rate Developing Employee Retention Techniques Sample PDF. You can use this template for your upcoming presentations, as the slides are perfect to represent even the tiniest detail. You can download these templates from the Slidegeeks website and these are easy to edit. So grab these today.

Conflict Resolution Method KPI Metrics Dashboard Post Resolving Workplace Download PDF
The purpose of this slide is to outline key performance indicator KPI dashboard showcasing the results post resolving organizational conflicts. The metrics covered in this slide are conflicts by departments, conflicts logged by gender etc. Do you have to make sure that everyone on your team knows about any specific topic I yes, then you should give Conflict Resolution Method KPI Metrics Dashboard Post Resolving Workplace Download PDF a try. Our experts have put a lot of knowledge and effort into creating this impeccable Conflict Resolution Method KPI Metrics Dashboard Post Resolving Workplace Download PDF. You can use this template for your upcoming presentations, as the slides are perfect to represent even the tiniest detail. You can download these templates from the Slidegeeks website and these are easy to edit. So grab these today.
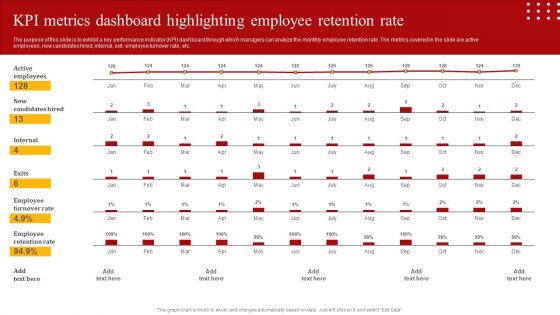
Staff Retention Techniques To Minimize Hiring Expenses KPI Metrics Dashboard Highlighting Employee Retention Template PDF
The purpose of this slide is to exhibit a key performance indicator KPI dashboard through which managers can analyze the monthly employee retention rate. The metrics covered in the slide are active employees, new candidates hired, internal, exit, employee turnover rate, etc. Do you have to make sure that everyone on your team knows about any specific topic I yes, then you should give Staff Retention Techniques To Minimize Hiring Expenses KPI Metrics Dashboard Highlighting Employee Retention Template PDF a try. Our experts have put a lot of knowledge and effort into creating this impeccable Staff Retention Techniques To Minimize Hiring Expenses KPI Metrics Dashboard Highlighting Employee Retention Template PDF. You can use this template for your upcoming presentations, as the slides are perfect to represent even the tiniest detail. You can download these templates from the Slidegeeks website and these are easy to edit. So grab these today.
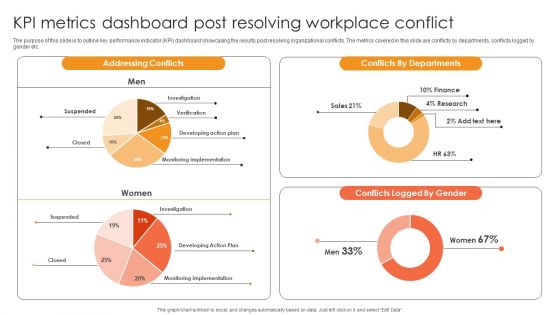
Kpi Metrics Dashboard Post Resolving Workplace Conflict Ppt Inspiration Graphics Download PDF
The purpose of this slide is to outline key performance indicator KPI dashboard showcasing the results post resolving organizational conflicts. The metrics covered in this slide are conflicts by departments, conflicts logged by gender etc. This Kpi Metrics Dashboard Post Resolving Workplace Conflict Ppt Inspiration Graphics Download PDF is perfect for any presentation, be it in front of clients or colleagues. It is a versatile and stylish solution for organizing your meetings. The Kpi Metrics Dashboard Post Resolving Workplace Conflict Ppt Inspiration Graphics Download PDF features a modern design for your presentation meetings. The adjustable and customizable slides provide unlimited possibilities for acing up your presentation. Slidegeeks has done all the homework before launching the product for you. So, do not wait, grab the presentation templates today
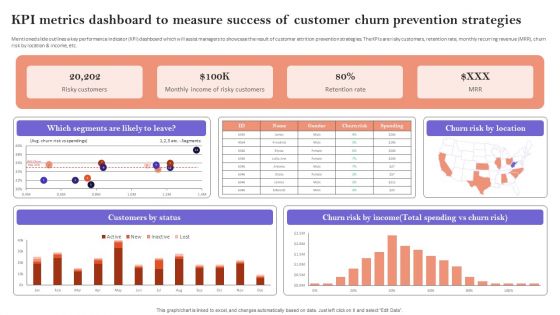
KPI Metrics Dashboard To Measure Success Of Customer Churn Prevention Strategies Diagrams PDF
Mentioned slide outlines a key performance indicator KPI dashboard which will assist managers to showcase the result of customer attrition prevention strategies. The KPIs are risky customers, retention rate, monthly recurring revenue MRR, churn risk by location and income, etc. This KPI Metrics Dashboard To Measure Success Of Customer Churn Prevention Strategies Diagrams PDF is perfect for any presentation, be it in front of clients or colleagues. It is a versatile and stylish solution for organizing your meetings. The KPI Metrics Dashboard To Measure Success Of Customer Churn Prevention Strategies Diagrams PDF features a modern design for your presentation meetings. The adjustable and customizable slides provide unlimited possibilities for acing up your presentation. Slidegeeks has done all the homework before launching the product for you. So, do not wait, grab the presentation templates today
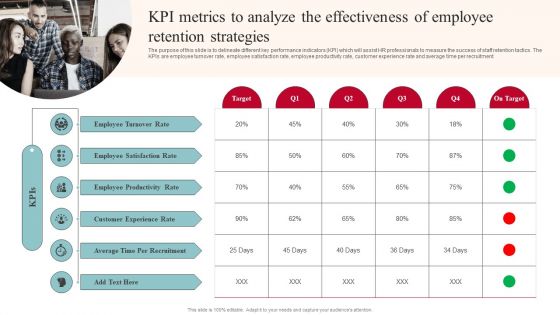
KPI Metrics To Analyze The Effectiveness Of Employee Retention Strategies Sample PDF
The purpose of this slide is to delineate different key performance indicators KPI which will assist HR professionals to measure the success of staff retention tactics. The KPIs are employee turnover rate, employee satisfaction rate, employee productivity rate, customer experience rate and average time per recruitment This KPI Metrics To Analyze The Effectiveness Of Employee Retention Strategies Sample PDF is perfect for any presentation, be it in front of clients or colleagues. It is a versatile and stylish solution for organizing your meetings. The KPI Metrics To Analyze The Effectiveness Of Employee Retention Strategies Sample PDF features a modern design for your presentation meetings. The adjustable and customizable slides provide unlimited possibilities for acing up your presentation. Slidegeeks has done all the homework before launching the product for you. So, do not wait, grab the presentation templates today

Guide To Healthcare Services Administration KPI Dashboard To Analyze Performance Healthcare Financial Demonstration PDF
The following slide showcases key performance indicator KPI dashboard which can be used to analyze the financial performance of hospital. The metrics covered in the slide are net profit margin, income and expenses, etc. Here you can discover an assortment of the finest PowerPoint and Google Slides templates. With these templates, you can create presentations for a variety of purposes while simultaneously providing your audience with an eye catching visual experience. Download Guide To Healthcare Services Administration KPI Dashboard To Analyze Performance Healthcare Financial Demonstration PDF to deliver an impeccable presentation. These templates will make your job of preparing presentations much quicker, yet still, maintain a high level of quality. Slidegeeks has experienced researchers who prepare these templates and write high quality content for you. Later on, you can personalize the content by editing the Guide To Healthcare Services Administration KPI Dashboard To Analyze Performance Healthcare Financial Demonstration PDF.
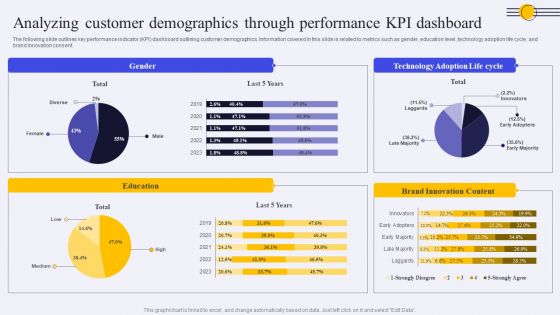
Analyzing Customer Demographics Through Performance KPI Dashboard Ppt PowerPoint Presentation File Model PDF
The following slide outlines key performance indicator KPI dashboard outlining customer demographics. Information covered in this slide is related to metrics such as gender, education level, technology adoption life cycle, and brand innovation consent. Are you searching for a Analyzing Customer Demographics Through Performance KPI Dashboard Ppt PowerPoint Presentation File Model PDF that is uncluttered, straightforward, and original Its easy to edit, and you can change the colors to suit your personal or business branding. For a presentation that expresses how much effort you have put in, this template is ideal. With all of its features, including tables, diagrams, statistics, and lists, its perfect for a business plan presentation. Make your ideas more appealing with these professional slides. Download Analyzing Customer Demographics Through Performance KPI Dashboard Ppt PowerPoint Presentation File Model PDF from Slidegeeks today.
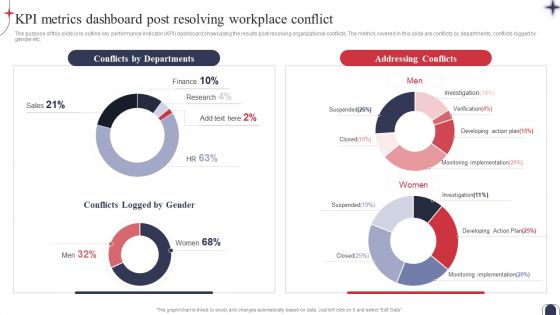
Workplace Conflict Resolution KPI Metrics Dashboard Post Resolving Workplace Designs PDF
The purpose of this slide is to outline key performance indicator KPI dashboard showcasing the results post resolving organizational conflicts. The metrics covered in this slide are conflicts by departments, conflicts logged by gender etc. The best PPT templates are a great way to save time, energy, and resources. Slidegeeks have 100 percent editable powerpoint slides making them incredibly versatile. With these quality presentation templates, you can create a captivating and memorable presentation by combining visually appealing slides and effectively communicating your message. Download Workplace Conflict Resolution KPI Metrics Dashboard Post Resolving Workplace Designs PDF from Slidegeeks and deliver a wonderful presentation.

Kpi Metrics Dashboard To Measure Online Merchandising Strategy Effectiveness Retail Merchandising Techniques Sample PDF
The following slide outlines KPI metrics dashboard which can be used to measure the effectiveness of online marketing on retail store. The metrics covered in the slide are new orders, total income, expense, new users, best selling products, etc.Are you searching for a Kpi Metrics Dashboard To Measure Online Merchandising Strategy Effectiveness Retail Merchandising Techniques Sample PDF that is uncluttered, straightforward, and original Its easy to edit, and you can change the colors to suit your personal or business branding. For a presentation that expresses how much effort you ve put in, this template is ideal With all of its features, including tables, diagrams, statistics, and lists, its perfect for a business plan presentation. Make your ideas more appealing with these professional slides. Download Kpi Metrics Dashboard To Measure Online Merchandising Strategy Effectiveness Retail Merchandising Techniques Sample PDF from Slidegeeks today.
Organizing Security Awareness KPI Metrics Dashboard To Effectively Track Cyber Threat Icons PDF
The purpose of this slide is to highlight performance KPI dashboard used to monitor the cyber threat management.. The metrics highlighted in the slide are risk score, compliance status, threat level, monitoring and operational status. This Organizing Security Awareness KPI Metrics Dashboard To Effectively Track Cyber Threat Icons PDF is perfect for any presentation, be it in front of clients or colleagues. It is a versatile and stylish solution for organizing your meetings. The Organizing Security Awareness KPI Metrics Dashboard To Effectively Track Cyber Threat Icons PDF features a modern design for your presentation meetings. The adjustable and customizable slides provide unlimited possibilities for acing up your presentation. Slidegeeks has done all the homework before launching the product for you. So, dont wait, grab the presentation templates today.

Introducing AI Tools KPI Metrics Dashboard To Measure Automation Performance Formats PDF
The following slide outlines a comprehensive KPI dashboard which can be used by the organization to measure the automation performance in customer support department. It covers KPIs such as customer retention, costs per support, customer satisfaction, etc. This Introducing AI Tools KPI Metrics Dashboard To Measure Automation Performance Formats PDF is perfect for any presentation, be it in front of clients or colleagues. It is a versatile and stylish solution for organizing your meetings. The Introducing AI Tools KPI Metrics Dashboard To Measure Automation Performance Formats PDF features a modern design for your presentation meetings. The adjustable and customizable slides provide unlimited possibilities for acing up your presentation. Slidegeeks has done all the homework before launching the product for you. So, dont wait, grab the presentation templates today.
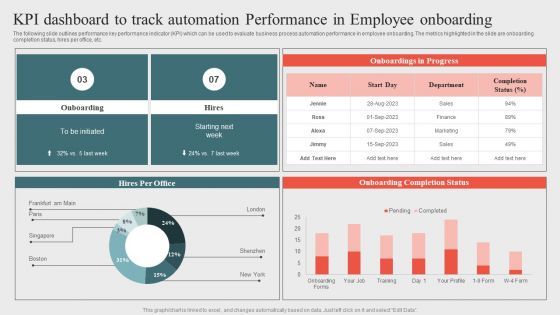
Kpi Dashboard To Track Automation Performanceoptimizing Business Processes Through Automation Summary PDF
The following slide outlines performance key performance indicator KPI which can be used to evaluate business process automation performance in employee onboarding. The metrics highlighted in the slide are onboarding completion status, hires per office, etc. Do you have to make sure that everyone on your team knows about any specific topic I yes, then you should give Kpi Dashboard To Track Automation Performanceoptimizing Business Processes Through Automation Summary PDF a try. Our experts have put a lot of knowledge and effort into creating this impeccable Kpi Dashboard To Track Automation Performanceoptimizing Business Processes Through Automation Summary PDF. You can use this template for your upcoming presentations, as the slides are perfect to represent even the tiniest detail. You can download these templates from the Slidegeeks website and these are easy to edit. So grab these today.
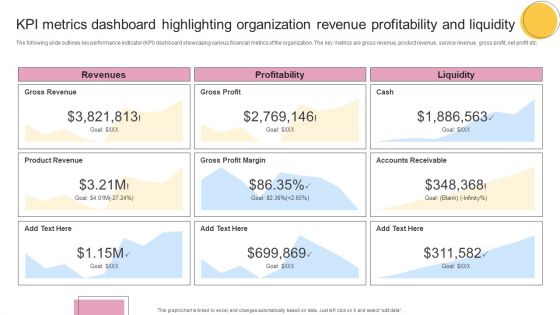
KPI Metrics Dashboard Highlighting Organization Revenue Profitability And Liquidity Formats PDF
The following slide outlines key performance indicator KPI dashboard showcasing various financial metrics of the organization. The key metrics are gross revenue, product revenue, service revenue, gross profit, net profit etc. From laying roadmaps to briefing everything in detail, our templates are perfect for you. You can set the stage with your presentation slides. All you have to do is download these easy to edit and customizable templates. KPI Metrics Dashboard Highlighting Organization Revenue Profitability And Liquidity Formats PDF will help you deliver an outstanding performance that everyone would remember and praise you for. Do download this presentation today.

Effective Financial Planning Assessment Techniques Performance Kpi Dashboard To Measure Financial Graphics PDF
The following slide outlines a comprehensive key performance indicator KPI dashboard highlighting different financial metrics. The KPIs are quick and current ratio, cash balance, days sales outstanding etc. The best PPT templates are a great way to save time, energy, and resources. Slidegeeks have 100 precent editable powerpoint slides making them incredibly versatile. With these quality presentation templates, you can create a captivating and memorable presentation by combining visually appealing slides and effectively communicating your message. Download Effective Financial Planning Assessment Techniques Performance Kpi Dashboard To Measure Financial Graphics PDF from Slidegeeks and deliver a wonderful presentation.

 Home
Home