Kpi Analysis

Ecommerce Management Ecommerce Management KPI Metrics Delivery Ppt Outline Clipart PDF
This is a ecommerce management ecommerce management kpi metrics delivery ppt outline clipart pdf template with various stages. Focus and dispense information on four stages using this creative set, that comes with editable features. It contains large content boxes to add your information on topics like average order value, gross profit margin, cart abandonment, viral coefficient. You can also showcase facts, figures, and other relevant content using this PPT layout. Grab it now.
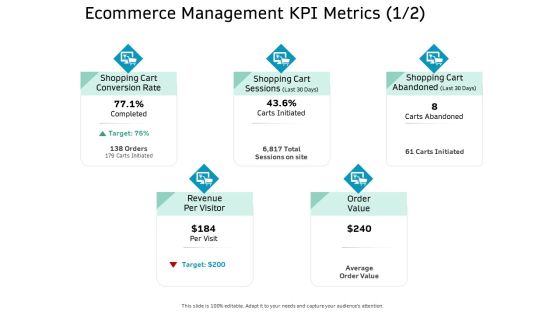
Ecommerce Solution Providers Ecommerce Management KPI Metrics Delivery Ppt Portfolio Structure PDF
Presenting ecommerce solution providers ecommerce management kpi metrics delivery ppt portfolio structure pdf to provide visual cues and insights. Share and navigate important information on five stages that need your due attention. This template can be used to pitch topics like conversion rate, revenue, value, target. In addtion, this PPT design contains high resolution images, graphics, etc, that are easily editable and available for immediate download.
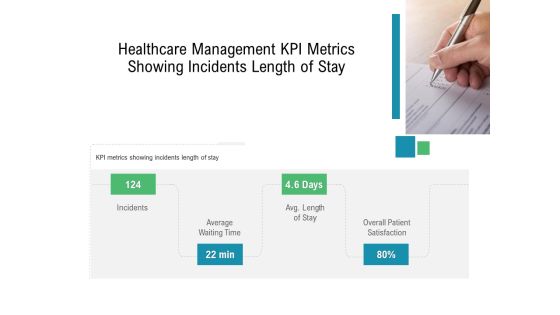
Hospital Management Healthcare Management KPI Metrics Showing Incidents Length Of Stay Ppt Pictures Graphics PDF
This is a hospital management healthcare management kpi metrics showing incidents length of stay ppt pictures graphics pdf template with various stages. Focus and dispense information on four stages using this creative set, that comes with editable features. It contains large content boxes to add your information on topics like incidents, average waiting time, avg length of stay, overall patient satisfaction. You can also showcase facts, figures, and other relevant content using this PPT layout. Grab it now.

Hospital Management Healthcare Management KPI Metrics Showing Treatment Cost And Waiting Time Ppt Inspiration PDF
Presenting hospital management healthcare management kpi metrics showing treatment cost and waiting time ppt inspiration pdf to provide visual cues and insights. Share and navigate important information on three stages that need your due attention. This template can be used to pitch topics like average treatment cost all ages, average nurse patient ratio, average time to see a doctor. In addtion, this PPT design contains high resolution images, graphics, etc, that are easily editable and available for immediate download.
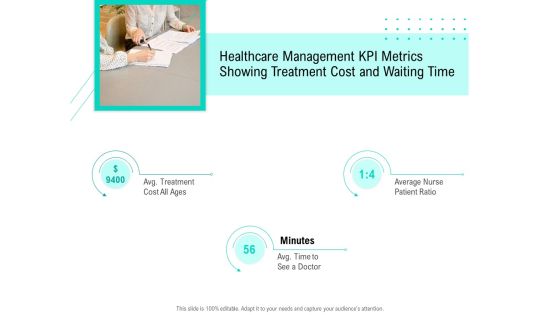
Nursing Administration Healthcare Management KPI Metrics Showing Treatment Cost And Waiting Time Ppt Gallery Slides PDF
Presenting nursing administration healthcare management kpi metrics showing treatment cost and waiting time ppt gallery slides pdf to provide visual cues and insights. Share and navigate important information on three stages that need your due attention. This template can be used to pitch topics like average treatment cost all ages, average nurse patient ratio, average time to see a doctor. In addtion, this PPT design contains high resolution images, graphics, etc, that are easily editable and available for immediate download.

E Healthcare Management System Healthcare Management KPI Metrics Showing Incidents Length Of Stay Graphics PDF
This is a e healthcare management system healthcare management kpi metrics showing incidents length of stay graphics pdf template with various stages. Focus and dispense information on four stages using this creative set, that comes with editable features. It contains large content boxes to add your information on topics like incidents, average waiting time, avg length of stay, overall patient satisfaction. You can also showcase facts, figures, and other relevant content using this PPT layout. Grab it now.
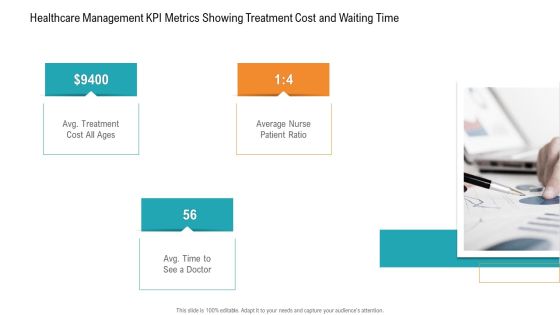
E Healthcare Management System Healthcare Management KPI Metrics Showing Treatment Cost And Waiting Time Template PDF
Presenting e healthcare management system healthcare management kpi metrics showing treatment cost and waiting time template pdf to provide visual cues and insights. Share and navigate important information on three stages that need your due attention. This template can be used to pitch topics like average treatment cost all ages, average nurse patient ratio, average time to see a doctor. In addtion, this PPT design contains high resolution images, graphics, etc, that are easily editable and available for immediate download.
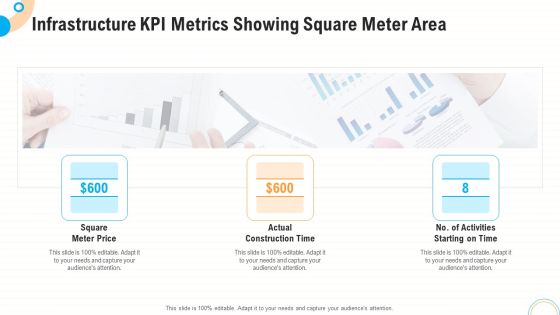
Fiscal And Operational Assessment Infrastructure KPI Metrics Showing Square Meter Area Guidelines PDF
Presenting fiscal and operational assessment infrastructure kpi metrics showing square meter area guidelines pdf to provide visual cues and insights. Share and navigate important information on three stages that need your due attention. This template can be used to pitch topics like square meter price, actual construction time, activities starting. In addtion, this PPT design contains high resolution images, graphics, etc, that are easily editable and available for immediate download.

Healthcare Management Healthcare Management KPI Metrics Showing Incidents Length Of Stay Ppt Outline Slide Portrait PDF
This is a healthcare management healthcare management kpi metrics showing incidents length of stay ppt outline slide portrait pdf template with various stages. Focus and dispense information on four stages using this creative set, that comes with editable features. It contains large content boxes to add your information on topics like incidents, average waiting time, avg length of stay, overall patient satisfaction. You can also showcase facts, figures, and other relevant content using this PPT layout. Grab it now.
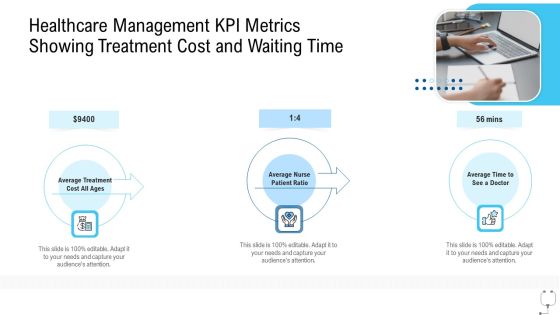
Healthcare Management Healthcare Management KPI Metrics Showing Treatment Cost And Waiting Time Ppt Infographics Example PDF
Presenting healthcare management healthcare management kpi metrics showing treatment cost and waiting time ppt infographics example pdf to provide visual cues and insights. Share and navigate important information on three stages that need your due attention. This template can be used to pitch topics like average treatment cost all ages, average nurse patient ratio, average time to see a doctor. In addtion, this PPT design contains high resolution images, graphics, etc, that are easily editable and available for immediate download.

Hospital Administration Healthcare Management KPI Metrics Showing Incidents Length Of Stay Ppt File Introduction PDF
This is a hospital administration healthcare management kpi metrics showing incidents length of stay ppt file introduction pdf template with various stages. Focus and dispense information on four stages using this creative set, that comes with editable features. It contains large content boxes to add your information on topics like incidents, average waiting time, avg length of stay, overall patient satisfaction. You can also showcase facts, figures, and other relevant content using this PPT layout. Grab it now.

Financial Functional Assessment Infrastructure KPI Metrics Showing Cost Saving Professional PDF
This is a financial functional assessment infrastructure kpi metrics showing cost saving professional pdf template with various stages. Focus and dispense information on three stages using this creative set, that comes with editable features. It contains large content boxes to add your information on topics like cost savings, net project revenue, defects. You can also showcase facts, figures, and other relevant content using this PPT layout. Grab it now.
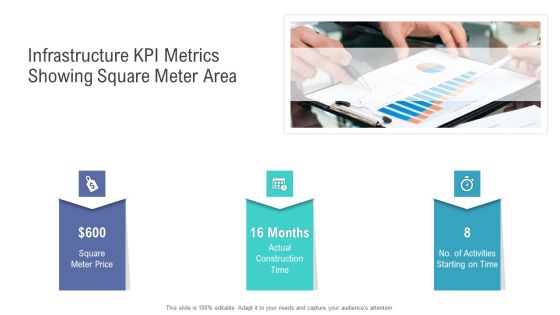
Financial Functional Assessment Infrastructure KPI Metrics Showing Square Meter Area Summary PDF
Presenting financial functional assessment infrastructure kpi metrics showing square meter area summary pdf to provide visual cues and insights. Share and navigate important information on three stages that need your due attention. This template can be used to pitch topics like square meter price, actual construction time, activities. In addition, this PPT design contains high-resolution images, graphics, etc, that are easily editable and available for immediate download.

Pharmaceutical Management Healthcare Management KPI Metrics Showing Incidents Length Of Stay Ppt Gallery Example PDF
This is a pharmaceutical management healthcare management kpi metrics showing incidents length of stay ppt gallery example pdf template with various stages. Focus and dispense information on four stages using this creative set, that comes with editable features. It contains large content boxes to add your information on topics like incidents, average waiting time, avg length of stay, overall patient satisfaction. You can also showcase facts, figures, and other relevant content using this PPT layout. Grab it now.

Pharmaceutical Management Healthcare Management KPI Metrics Showing Treatment Cost And Waiting Time Ppt Ideas Format PDF
Presenting pharmaceutical management healthcare management kpi metrics showing treatment cost and waiting time ppt ideas format pdf to provide visual cues and insights. Share and navigate important information on three stages that need your due attention. This template can be used to pitch topics like average treatment cost all ages, average nurse patient ratio, average time to see a doctor. In addtion, this PPT design contains high resolution images, graphics, etc, that are easily editable and available for immediate download.

Agenda For Sustainability Calculation With KPI Ppt PowerPoint Presentation Gallery Designs PDF
This is a agenda for sustainability calculation with kpi ppt powerpoint presentation gallery designs pdf template with various stages. Focus and dispense information on three stages using this creative set, that comes with editable features. It contains large content boxes to add your information on topics like financial profitability, employee performance, customer satisfaction. You can also showcase facts, figures, and other relevant content using this PPT layout. Grab it now.
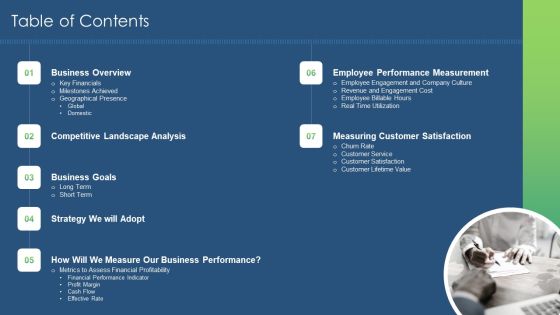
Sustainability Calculation With KPI Table Of Contents Ppt PowerPoint Presentation File Ideas PDF
This is a sustainability calculation with kpi table of contents ppt powerpoint presentation file ideas pdf template with various stages. Focus and dispense information on seven stages using this creative set, that comes with editable features. It contains large content boxes to add your information on topics like business overview, business goals, customer satisfaction, employee performance measurement. You can also showcase facts, figures, and other relevant content using this PPT layout. Grab it now.
KPI To Track Performance Of Restaurant Action Plan For Fast Food Themes PDF
Following slide presents major key performance indicators that can be used by managers in order to track the performance of restaurants. Major key performance indicators include average table occupancy, revenue per seat, online reviews, etc. Showcasing this set of slides titled KPI To Track Performance Of Restaurant Action Plan For Fast Food Themes PDF. The topics addressed in these templates are Customer Retention Rate, Social Engagement, Website Traffic. All the content presented in this PPT design is completely editable. Download it and make adjustments in color, background, font etc. as per your unique business setting.
Sustainability Calculation With KPI Long Term Goals Of The Company Ppt PowerPoint Presentation Gallery Icon PDF
This slide shows long term goals set by the firm. Goals covered are to enlist the company fortune 500, to acquire product market share in US alone and to become top FMCG company in North America. Presenting sustainability calculation with kpi long term goals of the company ppt powerpoint presentation gallery icon pdf to provide visual cues and insights. Share and navigate important information on five stages that need your due attention. This template can be used to pitch topics like long term goals of the company. In addtion, this PPT design contains high resolution images, graphics, etc, that are easily editable and available for immediate download.
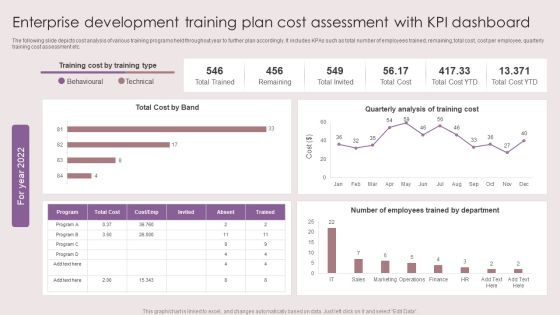
Enterprise Development Training Plan Cost Assessment With KPI Dashboard Mockup PDF
The following slide depicts cost analysis of various training programs held throughout year to further plan accordingly. It includes KPAs such as total number of employees trained, remaining, total cost, cost per employee, quarterly training cost assessment etc. Showcasing this set of slides titled Enterprise Development Training Plan Cost Assessment With KPI Dashboard Mockup PDF. The topics addressed in these templates are Total Cost Band, Quarterly Analysis, Training Cost. All the content presented in this PPT design is completely editable. Download it and make adjustments in color, background, font etc. as per your unique business setting.

Decision Making Analysis For Supporting Business Decisions Ideas PDF
Persuade your audience using this decision making analysis for supporting business decisions ideas pdf. This PPT design covers seven stages, thus making it a great tool to use. It also caters to a variety of topics including marketing kpi system, competing product analysis, market choice analysis. Download this PPT design now to present a convincing pitch that not only emphasizes the topic but also showcases your presentation skills.
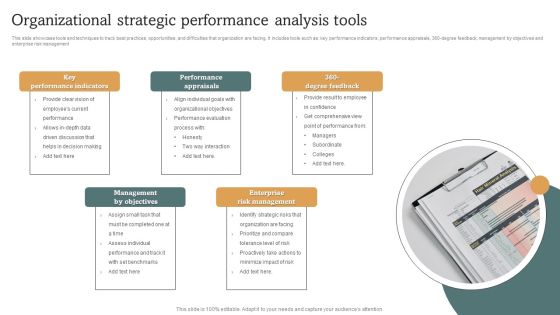
Organizational Strategic Performance Analysis Tools Structure PDF
This slide showcase tools and techniques to track best practices, opportunities, and difficulties that organization are facing. It includes tools such as key performance indicators, performance appraisals, 360 degree feedback, management by objectives and enterprise risk management. Persuade your audience using this Organizational Strategic Performance Analysis Tools Structure PDF. This PPT design covers five stages, thus making it a great tool to use. It also caters to a variety of topics including Management By Objectives, Performance Appraisals, Key Performance Indicators. Download this PPT design now to present a convincing pitch that not only emphasizes the topic but also showcases your presentation skills.
Procurement Kpi Dashboard For Tracking Supplier Action Plan Impact Graphics PDF
This slide covers procurement spend analysis dashboard for tracking new supplier strategy results. It include KPIs such as invoice count, invoices information, due dates, spend by payment terms, supplier payment terms, spend by entity, spend by category, spend by country. Showcasing this set of slides titled procurement kpi dashboard for tracking supplier action plan impact graphics pdf. The topics addressed in these templates are procurement kpi dashboard for tracking supplier action plan impact. All the content presented in this PPT design is completely editable. Download it and make adjustments in color, background, font etc. as per your unique business setting.
Google Keyword Assessment KPI Dashboard For Tracking Improvement In Website Traffic Infographics PDF
Following slide demonstrates keyword analysis dashboard which can be used by business to track website traffic performance. It includes metrics such as average keyword position, keyword ranking distribution, keyword ranking, keyword in top 3, top 10, top 20 and top 100. Showcasing this set of slides titled Google Keyword Assessment KPI Dashboard For Tracking Improvement In Website Traffic Infographics PDF. The topics addressed in these templates are Keyword Ranking, Keyword Ranking Distribution, Average Keyword Position. All the content presented in this PPT design is completely editable. Download it and make adjustments in color, background, font etc. as per your unique business setting.

Strategic Performance Analysis Tools Survey Microsoft PDF
This slide showcase survey result of 300 professional organization using strategic performance measurement tools. It includes elements such as key performance indicators, performance appraisal method, six sigma method, 360 degree feedback etc. Pitch your topic with ease and precision using this Strategic Performance Analysis Tools Survey Microsoft PDF. This layout presents information on Strategic Performance, Analysis Tools Survey. It is also available for immediate download and adjustment. So, changes can be made in the color, design, graphics or any other component to create a unique layout.
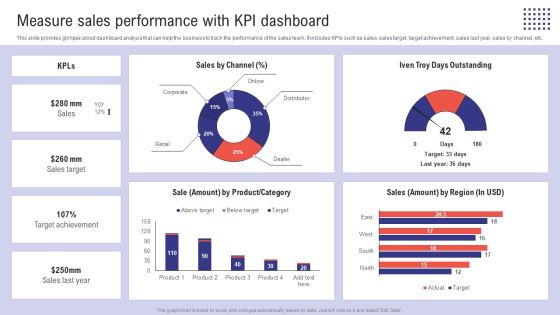
Planning Sales Campaign To Improve Measure Sales Performance With Kpi Dashboard Topics PDF
This slide provides glimpse about dashboard analysis that can help the business to track the performance of the sales team. It includes KPIs such as sales, sales target, target achievement, sales last year, sales by channel, etc. Explore a selection of the finest Planning Sales Campaign To Improve Measure Sales Performance With Kpi Dashboard Topics PDF here. With a plethora of professionally designed and pre-made slide templates, you can quickly and easily find the right one for your upcoming presentation. You can use our Planning Sales Campaign To Improve Measure Sales Performance With Kpi Dashboard Topics PDF to effectively convey your message to a wider audience. Slidegeeks has done a lot of research before preparing these presentation templates. The content can be personalized and the slides are highly editable. Grab templates today from Slidegeeks.
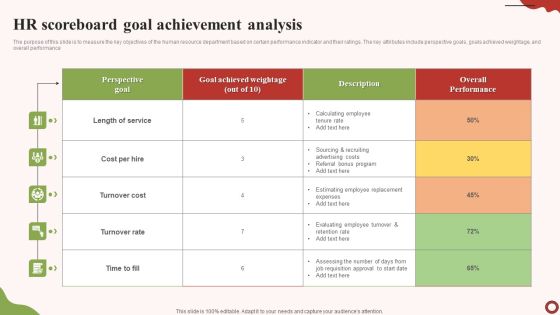
HR Scoreboard Goal Achievement Analysis Structure PDF
The purpose of this slide is to measure the key objectives of the human resource department based on certain performance indicator and their ratings. The key attributes include perspective goals, goals achieved weightage, and overall performance. Showcasing this set of slides titled HR Scoreboard Goal Achievement Analysis Structure PDF. The topics addressed in these templates are Length Service, Cost Per Hire, Turnover Cost. All the content presented in this PPT design is completely editable. Download it and make adjustments in color, background, font etc. as per your unique business setting.

Email Marketing Campaigns Performance Analysis Brochure PDF
This slide covers an email marketing activity tracking sheet for understanding how subscribers react to the campaign and improve it depending on the results. It includes evaluation metrics such as open rate, click through rate, click to open rate, unsubscribe rate, and spam rate. Get a simple yet stunning designed Email Marketing Campaigns Performance Analysis Brochure PDF. It is the best one to establish the tone in your meetings. It is an excellent way to make your presentations highly effective. So, download this PPT today from Slidegeeks and see the positive impacts. Our easy to edit Email Marketing Campaigns Performance Analysis Brochure PDF can be your go to option for all upcoming conferences and meetings. So, what are you waiting for Grab this template today.
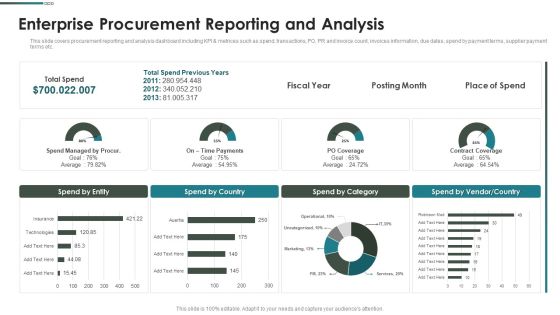
Purchase Assessment Process Enterprise Procurement Reporting And Analysis Infographics PDF
This slide covers procurement reporting and analysis dashboard including KPI metrices such as spend, transactions, PO, PR and invoice count, invoices information, due dates, spend by payment terms, supplier payment terms etc. Deliver an awe inspiring pitch with this creative Purchase Assessment Process Enterprise Procurement Reporting And Analysis Infographics PDF bundle. Topics like Spend Entity, Spend Country, Spend Category can be discussed with this completely editable template. It is available for immediate download depending on the needs and requirements of the user.

Financial Management Kpi Metrics Business Ppt Powerpoint Presentation Gallery File Formats
This is a financial management kpi metrics business ppt powerpoint presentation gallery file formats. This is a four stage process. The stages in this process are finance, marketing, management, investment, analysis.

Financial Management Kpi Metrics Process Ppt Powerpoint Presentation Slides Graphics Download
This is a financial management kpi metrics process ppt powerpoint presentation slides graphics download. This is a four stage process. The stages in this process are finance, marketing, management, investment, analysis.

Supply Chain Kpi Dashboard Ppt PowerPoint Presentation Complete Deck With Slides
This is a supply chain kpi dashboard ppt powerpoint presentation complete deck with slides. This is a one stage process. The stages in this process are business, strategy, marketing, analysis, business model.
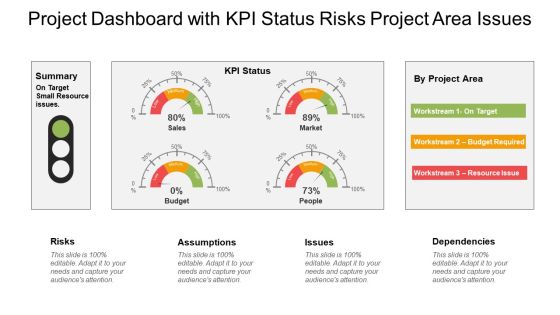
Project Summary Dashboard With Kpi Status Ppt PowerPoint Presentation Slides Show
This is a project summary dashboard with kpi status ppt powerpoint presentation slides show. This is a three stage process. The stages in this process are project analysis, project review, project performance management.
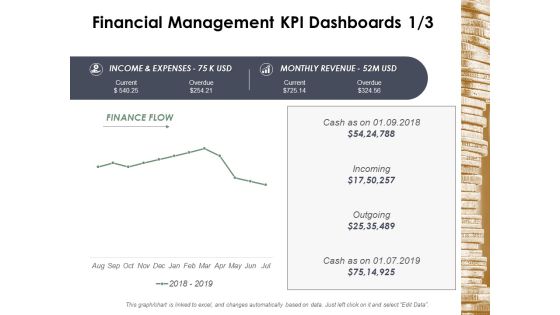
Financial Management Kpi Dashboards Business Ppt Powerpoint Presentation Infographic Template Deck
This is a financial management kpi dashboards business ppt powerpoint presentation infographic template deck. This is a four stage process. The stages in this process are finance, marketing, management, investment, analysis.

Financial Management Kpi Dashboards Strategy Ppt Powerpoint Presentation Gallery Graphics Template
This is a financial management kpi dashboards strategy ppt powerpoint presentation gallery graphics template. This is a six stage process. The stages in this process are finance, marketing, management, investment, analysis.
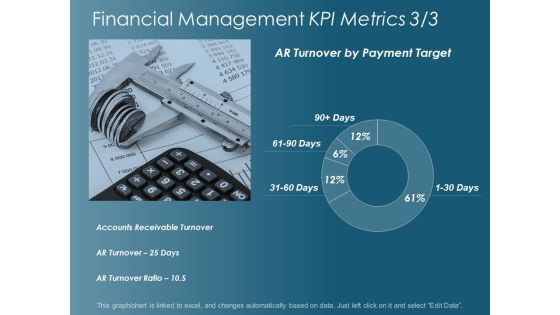
Financial Management Kpi Metrics Management Ppt Powerpoint Presentation Infographic Template Graphic Images
This is a financial management kpi metrics management ppt powerpoint presentation infographic template graphic images. This is a four stage process. The stages in this process are finance, marketing, management, investment, analysis.

Financial Management Kpi Metrics Operating Profit Margin Ppt Powerpoint Presentation Infographic Template Images
This is a financial management kpi metrics operating profit margin ppt powerpoint presentation infographic template images. This is a three stage process. The stages in this process are finance, marketing, management, investment, analysis.

Retail KPI Dashboard Showing Revenue Vs Units Sold Ppt PowerPoint Presentation Professional Smartart
This is a retail kpi dashboard showing revenue vs units sold ppt powerpoint presentation professional smartart. This is a four stage process. The stages in this process are finance, analysis, business, investment, marketing.

Retail KPI Dashboard Showing Sales Revenue Customers Ppt PowerPoint Presentation Show Background Designs
This is a retail kpi dashboard showing sales revenue customers ppt powerpoint presentation show background designs. This is a six stage process. The stages in this process are finance, analysis, business, investment, marketing.
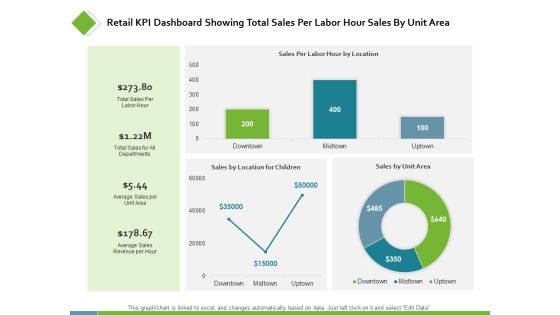
Retail KPI Dashboard Showing Total Sales Per Labor Ppt PowerPoint Presentation Styles Examples
This is a retail kpi dashboard showing total sales per labor ppt powerpoint presentation styles examples. This is a three stage process. The stages in this process are finance, analysis, business, investment, marketing.

Retail Kpi Dashboard Showing Revenue Vs Units Sold Ppt PowerPoint Presentation File Formats
This is a retail kpi dashboard showing revenue vs units sold ppt powerpoint presentation file formats. This is a three stage process. The stages in this process are finance, marketing, management, investment, analysis.

Supply Chain Management Kpi Dashboard Marketing Ppt PowerPoint Presentation File Tips
This is a supply chain management kpi dashboard marketing ppt powerpoint presentation file tips. This is a three stage process. The stages in this process are finance, marketing, management, investment, analysis.
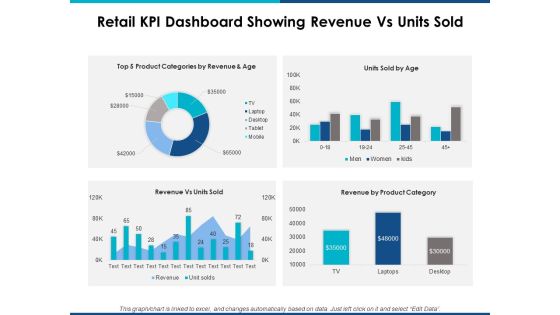
Retail Kpi Dashboard Showing Revenue Vs Units Sold Ppt Powerpoint Presentation Layouts Show
This is a retail kpi dashboard showing revenue vs units sold ppt powerpoint presentation layouts show. This is a four stage process. The stages in this process are finance, marketing, management, investment, analysis.
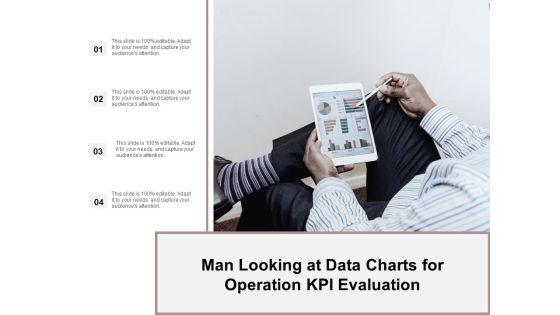
Man Looking At Data Charts For Operation Kpi Evaluation Ppt Powerpoint Presentation Ideas Demonstration
This is a man looking at data charts for operation kpi evaluation ppt powerpoint presentation ideas demonstration. This is a four stage process. The stages in this process are business metrics, business kpi, business dashboard.
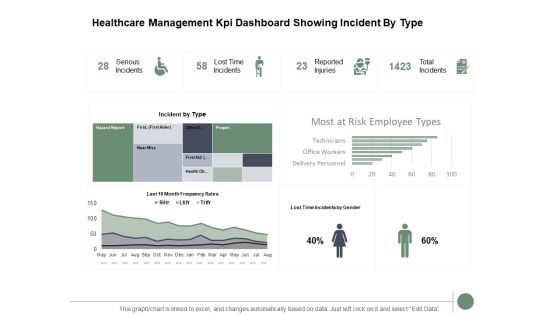
Healthcare Management Kpi Dashboard Showing Incident By Type Ppt PowerPoint Presentation Gallery Slide Download
Presenting this set of slides with name healthcare management kpi dashboard showing incident by type ppt powerpoint presentation gallery slide download. The topics discussed in these slides are bar graph, finance, marketing, analysis, investment. This is a completely editable PowerPoint presentation and is available for immediate download. Download now and impress your audience.
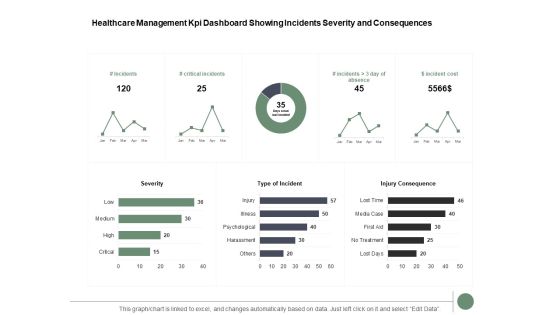
Healthcare Management Kpi Dashboard Showing Incidents Severity And Consequences Ppt PowerPoint Presentation Inspiration Summary
Presenting this set of slides with name healthcare management kpi dashboard showing incidents severity and consequences ppt powerpoint presentation inspiration summary. The topics discussed in these slides are bar graph, finance, marketing, analysis, investment. This is a completely editable PowerPoint presentation and is available for immediate download. Download now and impress your audience.

Healthcare Management KPI Dashboard For Organizations Ppt PowerPoint Presentation Summary Maker
Presenting this set of slides with name healthcare management kpi dashboard for organizations ppt powerpoint presentation summary maker. The topics discussed in these slides are finance, marketing, management, investment, analysis. This is a completely editable PowerPoint presentation and is available for immediate download. Download now and impress your audience.
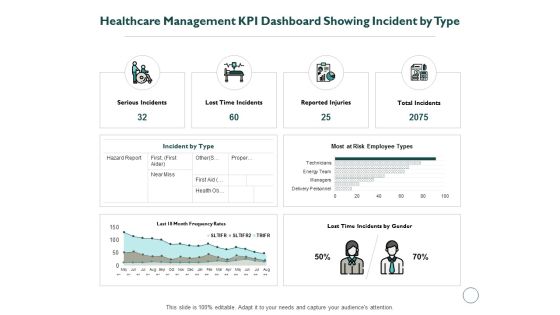
Healthcare Management KPI Dashboard Showing Incident By Type Ppt PowerPoint Presentation Inspiration Graphics Template
Presenting this set of slides with name healthcare management kpi dashboard showing incident by type ppt powerpoint presentation inspiration graphics template. The topics discussed in these slides are finance, marketing, management, investment, analysis. This is a completely editable PowerPoint presentation and is available for immediate download. Download now and impress your audience.

Healthcare Management KPI Dashboard Showing Incidents Severity And Consequences Ppt PowerPoint Presentation Inspiration Example File
Presenting this set of slides with name healthcare management kpi dashboard showing incidents severity and consequences ppt powerpoint presentation inspiration example file. The topics discussed in these slides are finance, marketing, management, investment, analysis. This is a completely editable PowerPoint presentation and is available for immediate download. Download now and impress your audience.
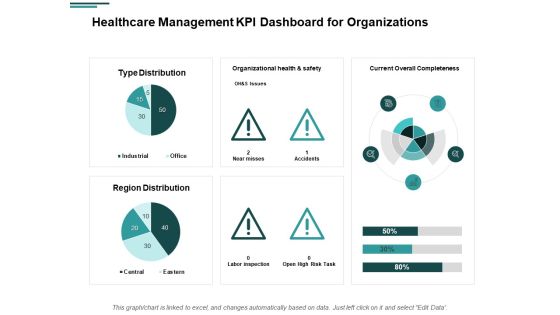
Healthcare Management KPI Dashboard For Organizations Ppt PowerPoint Presentation Portfolio Example
Presenting this set of slides with name healthcare management kpi dashboard for organizations ppt powerpoint presentation portfolio example. The topics discussed in these slides are finance, marketing, management, investment, analysis. This is a completely editable PowerPoint presentation and is available for immediate download. Download now and impress your audience.
Healthcare Management KPI Dashboard Showing Incidents Severity And Consequences Ppt PowerPoint Presentation Icon Model
Presenting this set of slides with name healthcare management kpi dashboard showing incidents severity and consequences ppt powerpoint presentation icon model. The topics discussed in these slides are finance, marketing, management, investment, analysis. This is a completely editable PowerPoint presentation and is available for immediate download. Download now and impress your audience.
IT Cost Assessment With KPI Dashboard To Gain Competitive Advantage Icons PDF
Showcasing this set of slides titled IT Cost Assessment With KPI Dashboard To Gain Competitive Advantage Icons PDF. The topics addressed in these templates are Actual Cost, Yearly Analysis, Breakdown Chart. All the content presented in this PPT design is completely editable. Download it and make adjustments in color, background, font etc. as per your unique business setting.
Interpreting Market Kinetics Influence Customer Purchasing KPI Dashboard To Monitor Icons PDF
Mentioned slide shows the KPI dashboard that can be used to track win and lost sales opportunities. It includes metrics namely won opportunities, lost opportunities, pipeline by territory, total opportunities. Deliver an awe inspiring pitch with this creative interpreting market kinetics influence customer purchasing kpi dashboard to monitor icons pdf bundle. Topics like kpi dashboard to monitor sales opportunities can be discussed with this completely editable template. It is available for immediate download depending on the needs and requirements of the user.

Market Research To Determine Business Opportunities Brand Analytics KPI Dashboard For Organization Inspiration PDF
The following slide outlines key performance indicator KPI dashboard that can assist marketers to evaluate brand performance on social media channels. The metrics covered are age group, gender, brand perception, branding themes, celebrity analysis, etc. There are so many reasons you need a Market Research To Determine Business Opportunities Brand Analytics KPI Dashboard For Organization Inspiration PDF. The first reason is you cannot spend time making everything from scratch, Thus, Slidegeeks has made presentation templates for you too. You can easily download these templates from our website easily.

Comprehensive Market Research Guide Brand Analytics Kpi Dashboard For Organization Brochure PDF
The following slide outlines key performance indicator KPI dashboard that can assist marketers to evaluate brand performance on social media channels. The metrics covered are age group, gender, brand perception, branding themes, celebrity analysis, etc. From laying roadmaps to briefing everything in detail, our templates are perfect for you. You can set the stage with your presentation slides. All you have to do is download these easy-to-edit and customizable templates. Comprehensive Market Research Guide Brand Analytics Kpi Dashboard For Organization Brochure PDF will help you deliver an outstanding performance that everyone would remember and praise you for. Do download this presentation today.

Brand Analytics KPI Dashboard For Organization Ppt PowerPoint Presentation Diagram PDF
The following slide outlines key performance indicator KPI dashboard that can assist marketers to evaluate brand performance on social media channels. The metrics covered are age group, gender, brand perception, branding themes, celebrity analysis, etc. Take your projects to the next level with our ultimate collection of Brand Analytics KPI Dashboard For Organization Ppt PowerPoint Presentation Diagram PDF. Slidegeeks has designed a range of layouts that are perfect for representing task or activity duration, keeping track of all your deadlines at a glance. Tailor these designs to your exact needs and give them a truly corporate look with your own brand colors they will make your projects stand out from the rest.
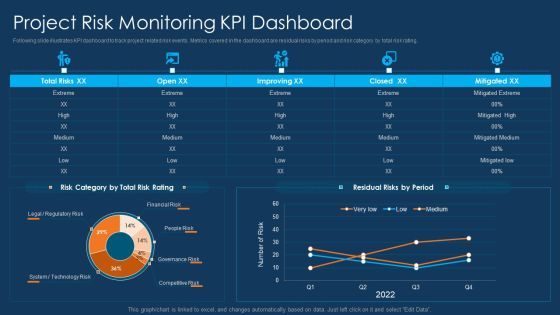
Information Technology Project Initiation Project Risk Monitoring Kpi Dashboard Background PDF
Following slide illustrates KPI dashboard to track project related risk events. Metrics covered in the dashboard are residual risks by period and risk category by total risk rating. Deliver and pitch your topic in the best possible manner with this information technology project initiation project risk monitoring kpi dashboard background pdf. Use them to share invaluable insights on project risk monitoring kpi dashboard and impress your audience. This template can be altered and modified as per your expectations. So, grab it now.
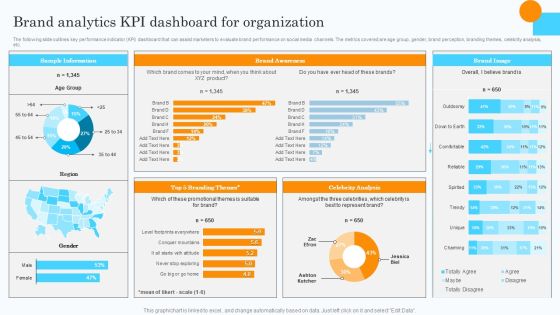
Market Research Assessment Of Target Market Requirements Brand Analytics Kpi Dashboard For Organization Clipart PDF
The following slide outlines key performance indicator KPI dashboard that can assist marketers to evaluate brand performance on social media channels. The metrics covered are age group, gender, brand perception, branding themes, celebrity analysis, etc. Do you have an important presentation coming up Are you looking for something that will make your presentation stand out from the rest Look no further than Market Research Assessment Of Target Market Requirements Brand Analytics Kpi Dashboard For Organization Clipart PDF. With our professional designs, you can trust that your presentation will pop and make delivering it a smooth process. And with Slidegeeks, you can trust that your presentation will be unique and memorable. So why wait Grab Market Research Assessment Of Target Market Requirements Brand Analytics Kpi Dashboard For Organization Clipart PDF today and make your presentation stand out from the rest.
Security KPI Dashboard To Identify The Risk Of Application Ppt Icon Show PDF
Showcasing this set of slides titled Security KPI Dashboard To Identify The Risk Of Application Ppt Icon Show PDF. The topics addressed in these templates are Risk Levels, Security KPI Dashboard, Risk Of Application. All the content presented in this PPT design is completely editable. Download it and make adjustments in color, background, font etc. as per your unique business setting.
Icon Of Open Transformation KPI Dashboard With Key Performance Indicators Microsoft PDF
Presenting Icon Of Open Transformation KPI Dashboard With Key Performance Indicators Microsoft PDF to dispense important information. This template comprises four stages. It also presents valuable insights into the topics including Icon Of Open Transformation, KPI Dashboard, Key Performance Indicators. This is a completely customizable PowerPoint theme that can be put to use immediately. So, download it and address the topic impactfully.
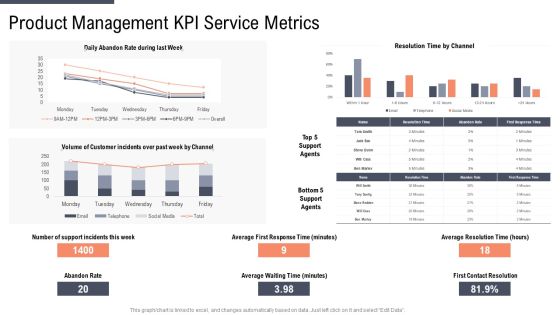
Factor Approaches For Potential Audience Targeting Product Management Kpi Service Metrics Inspiration PDF
Deliver and pitch your topic in the best possible manner with this factor approaches for potential audience targeting product management kpi service metrics inspiration pdf. Use them to share invaluable insights on product management kpi service metrics and impress your audience. This template can be altered and modified as per your expectations. So, grab it now.

Power Management System And Technology KPI Metrics And Dashboard Ppt PowerPoint Presentation Outline Designs Download PDF
Presenting this set of slides with name power management system and technology kpi metrics and dashboard ppt powerpoint presentation outline designs download pdf. This is a two stage process. The stages in this process are kpi metrics, dashboard. This is a completely editable PowerPoint presentation and is available for immediate download. Download now and impress your audience.

Key Team Members KPI Metrics And Dashboards Ppt Slides Objects PDF
Presenting this set of slides with name key team members kpi metrics and dashboards ppt slides objects pdf. This is a two stage process. The stages in this process are kpi metrics, dashboard metrics. This is a completely editable PowerPoint presentation and is available for immediate download. Download now and impress your audience.

Data Assimilation Business Intelligence KPI Dashboard Media Ppt Layouts Show PDF
Deliver an awe inspiring pitch with this creative data assimilation business intelligence kpi dashboard media ppt layouts show pdf bundle. Topics like business intelligence kpi dashboard can be discussed with this completely editable template. It is available for immediate download depending on the needs and requirements of the user.

Firm KPI Dashboard Icon With Graph And 3 Dots Ppt Professional Slide PDF
Presenting Firm KPI Dashboard Icon With Graph And 3 Dots Ppt Professional Slide PDF to dispense important information. This template comprises three stages. It also presents valuable insights into the topics including Firm KPI Dashboard, Icon With Graph, 3 Dots. This is a completely customizable PowerPoint theme that can be put to use immediately. So, download it and address the topic impactfully.
Service Level Agreement KPI Dashboard Icon With Analytics And Interfaces Download PDF
Presenting Service Level Agreement KPI Dashboard Icon With Analytics And Interfaces Download PDF to dispense important information. This template comprises three stages. It also presents valuable insights into the topics including Service Level Agreement, KPI Dashboard Icon, Analytics And Interfaces. This is a completely customizable PowerPoint theme that can be put to use immediately. So, download it and address the topic impactfully.

Creating Positioning Techniques For Market Research Brand Analytics Kpi Dashboard For Organization Slides PDF
The following slide outlines key performance indicator KPI dashboard that can assist marketers to evaluate brand performance on social media channels. The metrics covered are age group, gender, brand perception, branding themes, celebrity analysis, etc. Boost your pitch with our creative Creating Positioning Techniques For Market Research Brand Analytics Kpi Dashboard For Organization Slides PDF. Deliver an awe-inspiring pitch that will mesmerize everyone. Using these presentation templates you will surely catch everyones attention. You can browse the ppts collection on our website. We have researchers who are experts at creating the right content for the templates. So you do not have to invest time in any additional work. Just grab the template now and use them.

Steps To Effectively Conduct Market Research Brand Analytics KPI Dashboard For Organization Template PDF
The following slide outlines key performance indicator KPI dashboard that can assist marketers to evaluate brand performance on social media channels. The metrics covered are age group, gender, brand perception, branding themes, celebrity analysis, etc. Present like a pro with Steps To Effectively Conduct Market Research Brand Analytics KPI Dashboard For Organization Template PDF Create beautiful presentations together with your team, using our easy to use presentation slides. Share your ideas in real time and make changes on the fly by downloading our templates. So whether you are in the office, on the go, or in a remote location, you can stay in sync with your team and present your ideas with confidence. With Slidegeeks presentation got a whole lot easier. Grab these presentations today.

Brand Analytics Kpi Dashboard For Organization Ppt Portfolio Graphics Design PDF
The following slide outlines key performance indicator KPI dashboard that can assist marketers to evaluate brand performance on social media channels. The metrics covered are age group, gender, brand perception, branding themes, celebrity analysis, etc. Boost your pitch with our creative Brand Analytics Kpi Dashboard For Organization Ppt Portfolio Graphics Design PDF. Deliver an awe inspiring pitch that will mesmerize everyone. Using these presentation templates you will surely catch everyones attention. You can browse the ppts collection on our website. We have researchers who are experts at creating the right content for the templates. So you do not have to invest time in any additional work. Just grab the template now and use them.

KPI Dashboard To Track Mobile Search Engine Optimization Analytics Performance Introduction PDF
This slide shows the KPI dashboard to track performance of mobile search engine optimization analytics. It covers KPIs such as Google ranking, site check, sessions, etc. Showcasing this set of slides titled KPI Dashboard To Track Mobile Search Engine Optimization Analytics Performance Introduction PDF. The topics addressed in these templates are KPI Dashboard, Search Engine Optimization, Analytics Performance. All the content presented in this PPT design is completely editable. Download it and make adjustments in color, background, font etc. as per your unique business setting.

KPI Dashboard For Software Product Promotion Strategy With Various Tools Portrait PDF
Following slide depicts the KPI dashboard with numerous tools for software product marketing plan In order to locate prospects and close sales, agile lead generation and marketing techniques are needed. Pitch your topic with ease and precision using this KPI Dashboard For Software Product Promotion Strategy With Various Tools Portrait PDF. This layout presents information on KPI Dashboard, Software Product Promotion, Strategy With Various Tools. It is also available for immediate download and adjustment. So, changes can be made in the color, design, graphics or any other component to create a unique layout.

Inventory Management Kpi Marketing Strategy Research Stress Management Ppt PowerPoint Presentation Infographic Template Infographics
This is a inventory management kpi marketing strategy research stress management ppt powerpoint presentation infographic template infographics. This is a four stage process. The stages in this process are inventory management, human development class, risk assessment survey.

Utilizing Agile Methodology In Data Transformation Project IT KPI Dashboard For Monitoring Template PDF
Mentioned slide portrays KPI dashboard for monitoring project progress. KPIS covered here are planned versus actual hours, risks and issues. Deliver and pitch your topic in the best possible manner with this utilizing agile methodology in data transformation project it kpi dashboard for monitoring template pdf. Use them to share invaluable insights on risk, planned, project and impress your audience. This template can be altered and modified as per your expectations. So, grab it now.

Utilizing Agile Methodology In Data Transformation Project IT Project Risk Management KPI Infographics PDF
This slide displays project risk management dashboard with KPIS namely risks, assumptions, issues, dependencies, actions and repairs. Deliver and pitch your topic in the best possible manner with this utilizing agile methodology in data transformation project it project risk management kpi infographics pdf. Use them to share invaluable insights on project risk management kpi dashboard and impress your audience. This template can be altered and modified as per your expectations. So, grab it now.
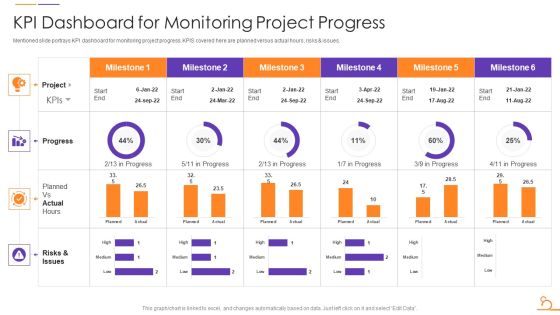
Agile Techniques For Data Migration Kpi Dashboard For Monitoring Project Progress Inspiration PDF
Mentioned slide portrays KPI dashboard for monitoring project progress. KPIS covered here are planned versus actual hours, risks and issues. Deliver an awe inspiring pitch with this creative Agile Techniques For Data Migration Kpi Dashboard For Monitoring Project Progress Inspiration PDF bundle. Topics like Project, Progress, Planned, Risks And Issues can be discussed with this completely editable template. It is available for immediate download depending on the needs and requirements of the user.
Vector Showing Data Quality Measurement With KPI Metrics Ppt PowerPoint Presentation Model Gridlines PDF
Persuade your audience using this vector showing data quality measurement with kpi metrics ppt powerpoint presentation model gridlines pdf. This PPT design covers four stages, thus making it a great tool to use. It also caters to a variety of topics including vector showing data quality measurement with kpi metrics. Download this PPT design now to present a convincing pitch that not only emphasizes the topic but also showcases your presentation skills.
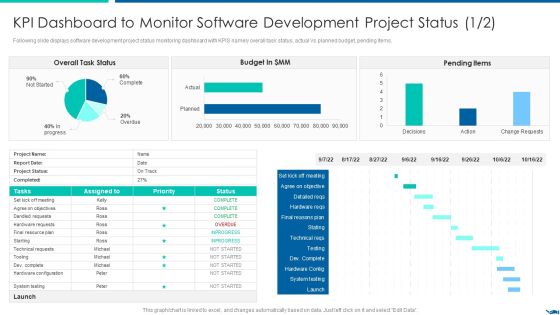
KPI Dashboard To Monitor Software Development Project QA Through Agile Methodology IT Topics PDF
Following slide displays software development project status monitoring dashboard with KPIS namely overall task status, actual Vs planned budget, pending items.Deliver and pitch your topic in the best possible manner with this KPI Dashboard To Monitor Software Development Project QA Through Agile Methodology IT Topics PDF Use them to share invaluable insights on Kpi Dashboard To Monitor Software Development Project Status and impress your audience. This template can be altered and modified as per your expectations. So, grab it now.

B2B Marketing KPI Metrics Social Media Channels Ppt Infographic Template Example Introduction PDF
This is a b2b marketing kpi metrics social media channels ppt infographic template example introduction pdf template with various stages. Focus and dispense information on four stages using this creative set, that comes with editable features. It contains large content boxes to add your information on topics like social media channels, kpi metrics. You can also showcase facts, figures, and other relevant content using this PPT layout. Grab it now.

CRM Customer Relationship Management KPI Metrics Leads Ppt File Topics PDF
Presenting crm customer relationship management kpi metrics leads ppt file topics pdf to provide visual cues and insights. Share and navigate important information on five stages that need your due attention. This template can be used to pitch topics like customer relationship management kpi metrics. In addtion, this PPT design contains high resolution images, graphics, etc, that are easily editable and available for immediate download.

Construction Engineering And Industrial Facility Management KPI Metrics And Dashboard Portrait PDF
Presenting construction engineering and industrial facility management kpi metrics and dashboard portrait pdf to provide visual cues and insights. Share and navigate important information on two stages that need your due attention. This template can be used to pitch topics like kpi metrics and dashboard. In addtion, this PPT design contains high resolution images, graphics, etc, that are easily editable and available for immediate download.
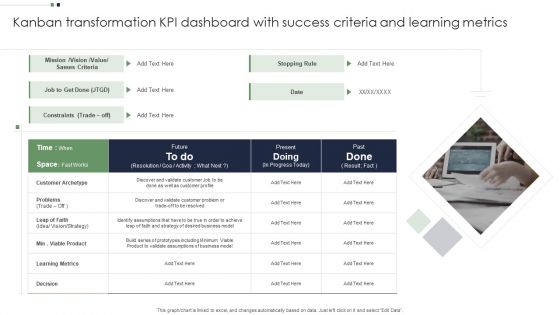
Kanban Transformation KPI Dashboard With Success Criteria And Learning Metrics Microsoft PDF
Persuade your audience using this Kanban Transformation KPI Dashboard With Success Criteria And Learning Metrics Microsoft PDF. This PPT design covers one stages, thus making it a great tool to use. It also caters to a variety of topics including Kanban Transformation KPI Dashboard, Success Criteria Learning Metrics. Download this PPT design now to present a convincing pitch that not only emphasizes the topic but also showcases your presentation skills.
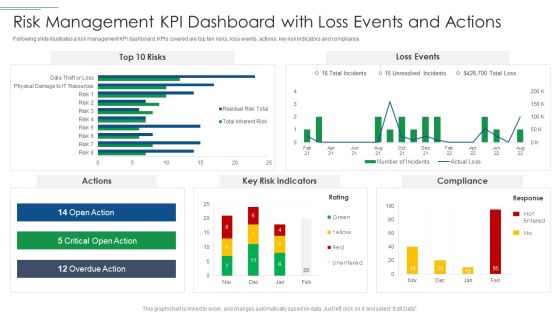
IT Security Risk Management Approach Introduction Risk Management KPI Dashboard With Loss Events Brochure PDF
Following slide illustrates a risk management KPI dashboard. KPIs covered are top ten risks, loss events, actions, key risk indicators and compliance. Deliver an awe inspiring pitch with this creative IT Security Risk Management Approach Introduction Risk Management KPI Dashboard With Loss Events Brochure PDF bundle. Topics like Key Risk Indicators, Risk Management can be discussed with this completely editable template. It is available for immediate download depending on the needs and requirements of the user.
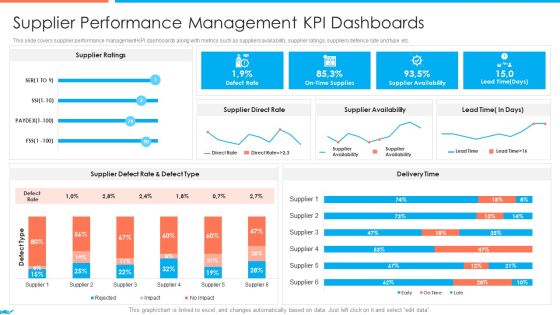
Supplier Association Management Techniques Supplier Performance Management Kpi Dashboards Guidelines PDF
This slide covers supplier performance management KPI dashboard along with metrics such as suppliers availability, supplier rating, suppliers defence rate and type etc. Deliver an awe inspiring pitch with this creative supplier association management techniques supplier performance management kpi dashboards guidelines pdf bundle. Topics like reduction in costs, increased efficiency, increase in profitability can be discussed with this completely editable template. It is available for immediate download depending on the needs and requirement of the user.

Technology Innovation Human Resource System KPI Of Human Resource Management Ppt Pictures Graphics Tutorials PDF
It shows the business metrics and KPIs for human resource management headcount by department, employee salary distribution, male and female ratio. Deliver an awe-inspiring pitch with this creative technology innovation human resource system kpi of human resource management ppt pictures graphics tutorials pdf bundle. Topics like kpi of human resource management can be discussed with this completely editable template. It is available for immediate download depending on the needs and requirements of the user.

Quality Monitoring Kpi Dashboard For Building And Construction Sector Portrait PDF
This slide covers quality monitoring KPI dashboard for construction industry. It involves data such as non conformance report, standard operating procedures, site inspection and quality training. Showcasing this set of slides titled Quality Monitoring Kpi Dashboard For Building And Construction Sector Portrait PDF. The topics addressed in these templates are Non Conformance Report, Standard Operating, Procedures. All the content presented in this PPT design is completely editable. Download it and make adjustments in color, background, font etc. as per your unique business setting.
Business Kpi And Benchmarking Competence Results Success Ppt Powerpoint Presentation Icon Graphic Images
This is a business kpi and benchmarking competence results success ppt powerpoint presentation icon graphic images. This is a four stage process. The stages in this process are best practice, best technique, best procedure.
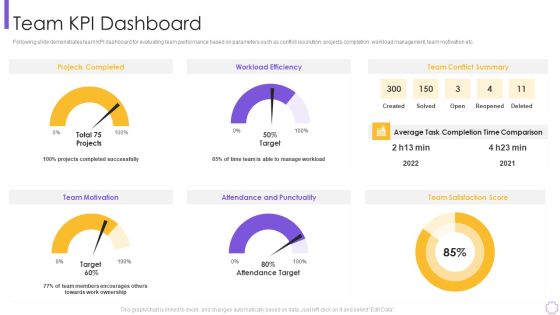
Process Optimization Through Product Life Process Management Techniques Team KPI Dashboard Mockup PDF
Following slide demonstrates team KPI dashboard for evaluating team performance based on parameters such as conflict resolution, projects completion, workload management, team motivation etc. Deliver and pitch your topic in the best possible manner with this process optimization through product life process management techniques team kpi dashboard mockup pdf Use them to share invaluable insights on projects completed, workload efficiency, team conflict summary and impress your audience. This template can be altered and modified as per your expectations. So, grab it now.

Data Loss Prevention KPI Ppt PowerPoint Presentation Styles Portfolio Cpb Pdf
Presenting this set of slides with name data loss prevention kpi ppt powerpoint presentation styles portfolio cpb pdf. This is an editable Powerpoint six stages graphic that deals with topics like data loss prevention kpi to help convey your message better graphically. This product is a premium product available for immediate download and is 100 percent editable in Powerpoint. Download this now and use it in your presentations to impress your audience.
KPI Dashboard For Tracking Hospitality And Tourism Management Plan Performance Infographics PDF
This slide shows the KPI dashboard for monitoring the performance of strategy implemented. It covers KPIs such as bookings, location, housekeeping, etc. Pitch your topic with ease and precision using this KPI Dashboard For Tracking Hospitality And Tourism Management Plan Performance Infographics PDF. This layout presents information on Booking Type, Housekeeping, Check In Guest. It is also available for immediate download and adjustment. So, changes can be made in the color, design, graphics or any other component to create a unique layout.

SLA KPL Dashboard Indicating Compliance Priority With KPI Ppt File Format PDF
This graph or chart is linked to excel, and changes automatically based on data. Just left click on it and select Edit Data. Showcasing this set of slides titled SLA KPL Dashboard Indicating Compliance Priority With KPI Ppt File Format PDF. The topics addressed in these templates are KPI Graph, Insights Here, SLA Compliance Priority. All the content presented in this PPT design is completely editable. Download it and make adjustments in color, background, font etc. as per your unique business setting.

KPI Metrics Dashboard Highlighting Employee Retention Rate Developing Employee Retention Techniques Sample PDF
The purpose of this slide is to exhibit a key performance indicator KPI dashboard through which managers can analyze the monthly employee retention rate. The metrics covered in the slide are active employees, new candidates hired, internal, exit, employee turnover rate, etc.Do you have to make sure that everyone on your team knows about any specific topic I yes, then you should give KPI Metrics Dashboard Highlighting Employee Retention Rate Developing Employee Retention Techniques Sample PDF a try. Our experts have put a lot of knowledge and effort into creating this impeccable KPI Metrics Dashboard Highlighting Employee Retention Rate Developing Employee Retention Techniques Sample PDF. You can use this template for your upcoming presentations, as the slides are perfect to represent even the tiniest detail. You can download these templates from the Slidegeeks website and these are easy to edit. So grab these today.
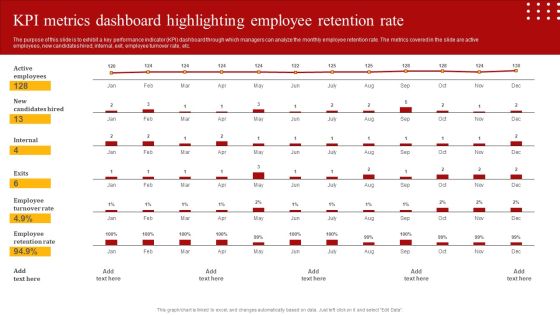
Staff Retention Techniques To Minimize Hiring Expenses KPI Metrics Dashboard Highlighting Employee Retention Template PDF
The purpose of this slide is to exhibit a key performance indicator KPI dashboard through which managers can analyze the monthly employee retention rate. The metrics covered in the slide are active employees, new candidates hired, internal, exit, employee turnover rate, etc. Do you have to make sure that everyone on your team knows about any specific topic I yes, then you should give Staff Retention Techniques To Minimize Hiring Expenses KPI Metrics Dashboard Highlighting Employee Retention Template PDF a try. Our experts have put a lot of knowledge and effort into creating this impeccable Staff Retention Techniques To Minimize Hiring Expenses KPI Metrics Dashboard Highlighting Employee Retention Template PDF. You can use this template for your upcoming presentations, as the slides are perfect to represent even the tiniest detail. You can download these templates from the Slidegeeks website and these are easy to edit. So grab these today.

Video Promotion Techniques KPI Dashboard To Measure Effectiveness Of Youtube Pictures PDF
The following slide outlines key performance indicator KPI dashboard which will assist the marketer to track YouTube marketing campaign performance. The key metrics covered in the slide are subscribers gained and lost, likes, dislikes, comments, shares etc. Explore a selection of the finest Video Promotion Techniques KPI Dashboard To Measure Effectiveness Of Youtube Pictures PDF here. With a plethora of professionally designed and pre-made slide templates, you can quickly and easily find the right one for your upcoming presentation. You can use our Video Promotion Techniques KPI Dashboard To Measure Effectiveness Of Youtube Pictures PDF to effectively convey your message to a wider audience. Slidegeeks has done a lot of research before preparing these presentation templates. The content can be personalized and the slides are highly editable. Grab templates today from Slidegeeks.

Kpi Metrics Dashboard To Measure Online Merchandising Strategy Effectiveness Retail Merchandising Techniques Sample PDF
The following slide outlines KPI metrics dashboard which can be used to measure the effectiveness of online marketing on retail store. The metrics covered in the slide are new orders, total income, expense, new users, best selling products, etc.Are you searching for a Kpi Metrics Dashboard To Measure Online Merchandising Strategy Effectiveness Retail Merchandising Techniques Sample PDF that is uncluttered, straightforward, and original Its easy to edit, and you can change the colors to suit your personal or business branding. For a presentation that expresses how much effort you ve put in, this template is ideal With all of its features, including tables, diagrams, statistics, and lists, its perfect for a business plan presentation. Make your ideas more appealing with these professional slides. Download Kpi Metrics Dashboard To Measure Online Merchandising Strategy Effectiveness Retail Merchandising Techniques Sample PDF from Slidegeeks today.

KPI Metrics Dashboard To Monitor Mobile Performing Mobile SEO Audit To Analyze Web Traffic Graphics PDF
The purpose of this slide is to outline key performance indicator KPI dashboard which will assist the marketer to analyze mobile search engine optimization SEO performance. The key metrics mentioned in the slide are total sessions, search engine rankings etc.Find highly impressive KPI Metrics Dashboard To Monitor Mobile Performing Mobile SEO Audit To Analyze Web Traffic Graphics PDF on Slidegeeks to deliver a meaningful presentation. You can save an ample amount of time using these presentation templates. No need to worry to prepare everything from scratch because Slidegeeks experts have already done a huge research and work for you. You need to download KPI Metrics Dashboard To Monitor Mobile Performing Mobile SEO Audit To Analyze Web Traffic Graphics PDF for your upcoming presentation. All the presentation templates are 100 precent editable and you can change the color and personalize the content accordingly. Download now.

Successful Staff Retention Techniques KPI Metrics Dashboard Highlighting Employee Retention Rate Pictures PDF
The purpose of this slide is to exhibit a key performance indicator KPI dashboard through which managers can analyze the monthly employee retention rate. The metrics covered in the slide are active employees, new candidates hired, internal, exit, employee turnover rate, etc. Make sure to capture your audiences attention in your business displays with our gratis customizable Successful Staff Retention Techniques KPI Metrics Dashboard Highlighting Employee Retention Rate Pictures PDF. These are great for business strategies, office conferences, capital raising or task suggestions. If you desire to acquire more customers for your tech business and ensure they stay satisfied, create your own sales presentation with these plain slides.

Effective Strategies For Retaining Healthcare Staff KPI Metrics To Analyze The Effectiveness Of Employee Inspiration PDF
The purpose of this slide is to delineate different key performance indicators KPI which will assist HR professionals to measure the success of staff retention tactics. The KPIs are employee turnover rate, employee satisfaction rate, employee productivity rate, customer experience rate and average time per recruitment . Explore a selection of the finest Effective Strategies For Retaining Healthcare Staff KPI Metrics To Analyze The Effectiveness Of Employee Inspiration PDF here. With a plethora of professionally designed and pre made slide templates, you can quickly and easily find the right one for your upcoming presentation. You can use our Effective Strategies For Retaining Healthcare Staff KPI Metrics To Analyze The Effectiveness Of Employee Inspiration PDF to effectively convey your message to a wider audience. Slidegeeks has done a lot of research before preparing these presentation templates. The content can be personalized and the slides are highly editable. Grab templates today from Slidegeeks.

Video Promotion Techniques Performance KPI Dashboard To Analyze Instagram Marketing Portrait PDF
The following slide outlines KPI metrics dashboard of Instagram video marketing. The KPIs covered in the slide are followers, engagement, likes, comments, impressions, reach, video views and saves. Here you can discover an assortment of the finest PowerPoint and Google Slides templates. With these templates, you can create presentations for a variety of purposes while simultaneously providing your audience with an eye-catching visual experience. Download Video Promotion Techniques Performance KPI Dashboard To Analyze Instagram Marketing Portrait PDF to deliver an impeccable presentation. These templates will make your job of preparing presentations much quicker, yet still, maintain a high level of quality. Slidegeeks has experienced researchers who prepare these templates and write high-quality content for you. Later on, you can personalize the content by editing the Video Promotion Techniques Performance KPI Dashboard To Analyze Instagram Marketing Portrait PDF.
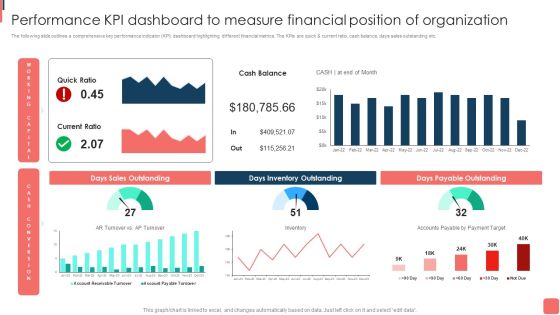
Effective Financial Planning Assessment Techniques Performance Kpi Dashboard To Measure Financial Graphics PDF
The following slide outlines a comprehensive key performance indicator KPI dashboard highlighting different financial metrics. The KPIs are quick and current ratio, cash balance, days sales outstanding etc. The best PPT templates are a great way to save time, energy, and resources. Slidegeeks have 100 precent editable powerpoint slides making them incredibly versatile. With these quality presentation templates, you can create a captivating and memorable presentation by combining visually appealing slides and effectively communicating your message. Download Effective Financial Planning Assessment Techniques Performance Kpi Dashboard To Measure Financial Graphics PDF from Slidegeeks and deliver a wonderful presentation.

Analyzing Customer Demographics Through Performance KPI Dashboard Ppt PowerPoint Presentation File Model PDF
The following slide outlines key performance indicator KPI dashboard outlining customer demographics. Information covered in this slide is related to metrics such as gender, education level, technology adoption life cycle, and brand innovation consent. Are you searching for a Analyzing Customer Demographics Through Performance KPI Dashboard Ppt PowerPoint Presentation File Model PDF that is uncluttered, straightforward, and original Its easy to edit, and you can change the colors to suit your personal or business branding. For a presentation that expresses how much effort you have put in, this template is ideal. With all of its features, including tables, diagrams, statistics, and lists, its perfect for a business plan presentation. Make your ideas more appealing with these professional slides. Download Analyzing Customer Demographics Through Performance KPI Dashboard Ppt PowerPoint Presentation File Model PDF from Slidegeeks today.

Deploying B2B Advertising Techniques For Lead Generation Email Marketing Kpi Dashboard To Monitor Progress Designs PDF
This slide covers email marketing KPI dashboard to monitor progress from email campaign. It involves details such as monthly growth of email list, list performance and daily web performance. Formulating a presentation can take up a lot of effort and time, so the content and message should always be the primary focus. The visuals of the PowerPoint can enhance the presenters message, so our Deploying B2B Advertising Techniques For Lead Generation Email Marketing Kpi Dashboard To Monitor Progress Designs PDF was created to help save time. Instead of worrying about the design, the presenter can concentrate on the message while our designers work on creating the ideal templates for whatever situation is needed. Slidegeeks has experts for everything from amazing designs to valuable content, we have put everything into Deploying B2B Advertising Techniques For Lead Generation Email Marketing Kpi Dashboard To Monitor Progress Designs PDF
IT Security Risk Management Approach Introduction Kpi Dashboard To Track Security Risk Events Icons PDF
This slide displays KPI dashboard that company will use to track multiple risk events. Metrics covered in the dashboard are residual risks by period and risk category by total risk rating. Deliver and pitch your topic in the best possible manner with this IT Security Risk Management Approach Introduction Kpi Dashboard To Track Security Risk Events Icons PDF. Use them to share invaluable insights on System Technology Risk, Governance Risk, Security Risk Events and impress your audience. This template can be altered and modified as per your expectations. So, grab it now.
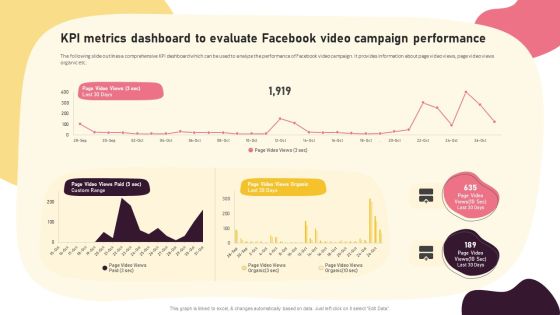
Video Promotion Techniques KPI Metrics Dashboard To Evaluate Facebook Video Introduction PDF
The following slide outlines a comprehensive KPI dashboard which can be used to analyze the performance of Facebook video campaign. It provides information about page video views, page video views organic etc. The best PPT templates are a great way to save time, energy, and resources. Slidegeeks have 100 percent editable powerpoint slides making them incredibly versatile. With these quality presentation templates, you can create a captivating and memorable presentation by combining visually appealing slides and effectively communicating your message. Download Video Promotion Techniques KPI Metrics Dashboard To Evaluate Facebook Video Introduction PDF from Slidegeeks and deliver a wonderful presentation.

Objective Goals Strategies And Measures Framework With Strategies And Kpi Measures Information PDF
This slide showcases OGSM framework that can help to define the organizational short term goals and formulate strategies to achieve them. It also showcases KPI to determine the success of action plan. Persuade your audience using this Objective Goals Strategies And Measures Framework With Strategies And Kpi Measures Information PDF. This PPT design covers three stages, thus making it a great tool to use. It also caters to a variety of topics including Goals, Strategies. Download this PPT design now to present a convincing pitch that not only emphasizes the topic but also showcases your presentation skills.

Brand Awareness Measuring Kpi Dashboard Brand And Equity Evaluation Techniques Ideas PDF
Mentioned slide showcases KPI dashboard that can be used to check the financial performance of a brand. Metrics covered in the dashboard are return on assets, working capital ratio, return on equity etc.From laying roadmaps to briefing everything in detail, our templates are perfect for you. You can set the stage with your presentation slides. All you have to do is download these easy-to-edit and customizable templates. Brand Awareness Measuring Kpi Dashboard Brand And Equity Evaluation Techniques Ideas PDF will help you deliver an outstanding performance that everyone would remember and praise you for. Do download this presentation today.
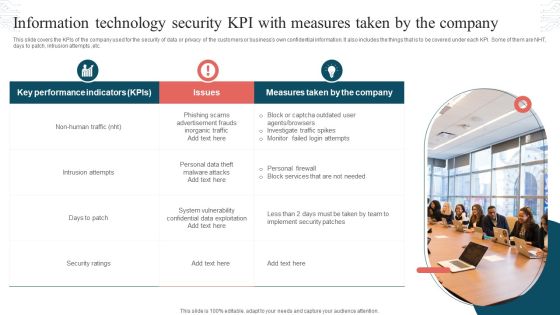
Information Technology Security KPI With Measures Taken By The Company Formats PDF
This slide covers the KPIs of the company used for the security of data or privacy of the customers or businesss own confidential information. It also includes the things that is to be covered under each KPI. Some of them are NHT, days to patch, intrusion attempts ,etc. Presenting Information Technology Security KPI With Measures Taken By The Company Formats PDF to dispense important information. This template comprises three stages. It also presents valuable insights into the topics including Key Performance Indicators, Measures Taken, Intrusion Attempts. This is a completely customizable PowerPoint theme that can be put to use immediately. So, download it and address the topic impactfully.
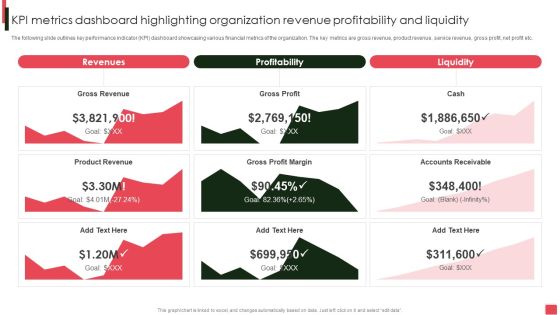
Overview Of Organizational Kpi Metrics Dashboard Highlighting Organization Revenue Brochure PDF
The following slide outlines key performance indicator KPI dashboard showcasing various financial metrics of the organization. The key metrics are gross revenue, product revenue, service revenue, gross profit, net profit etc. If your project calls for a presentation, then Slidegeeks is your go-to partner because we have professionally designed, easy-to-edit templates that are perfect for any presentation. After downloading, you can easily edit Overview Of Organizational Kpi Metrics Dashboard Highlighting Organization Revenue Brochure PDF and make the changes accordingly. You can rearrange slides or fill them with different images. Check out all the handy templates.
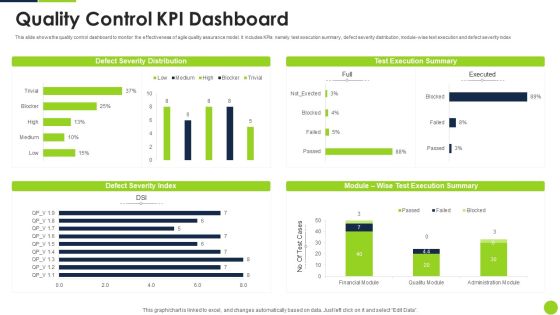
Agile Methodology Quality Control Quality Control KPI Dashboard Ppt Infographic Template Layout Ideas PDF
This slide shows the quality control dashboard to monitor the effectiveness of agile quality assurance model. It includes KPIs namely test execution summary, defect severity distribution, module-wise text execution and defect severity index Deliver an awe inspiring pitch with this creative agile methodology quality control quality control kpi dashboard ppt infographic template layout ideas pdf bundle. Topics like quality control kpi dashboard can be discussed with this completely editable template. It is available for immediate download depending on the needs and requirements of the user.

KPI Dashboard To Analyze Results Of Paid Social Media Advertising Rules PDF
This slide covers a comprehensive dashboard that can be used to examine the success rate of the paid social media plan. The metrics mentioned in the dashboard are impressions, cost, clicks, cost per click, conversions, cost per conversion, etc. Presenting this PowerPoint presentation, titled KPI Dashboard To Analyze Results Of Paid Social Media Advertising Rules PDF, with topics curated by our researchers after extensive research. This editable presentation is available for immediate download and provides attractive features when used. Download now and captivate your audience. Presenting this KPI Dashboard To Analyze Results Of Paid Social Media Advertising Rules PDF. Our researchers have carefully researched and created these slides with all aspects taken into consideration. This is a completely customizable KPI Dashboard To Analyze Results Of Paid Social Media Advertising Rules PDF that is available for immediate downloading. Download now and make an impact on your audience. Highlight the attractive features available with our PPTs.

Go To Market Approach For New Product KPI Dashboard To Monitor Sales Performance Clipart PDF
This slide shows sales performance monitoring dashboard. Metrics included in the dashboard are sales revenue, sales growth, average revenue per unit, customer lifetime value and customer acquisition cost.Deliver and pitch your topic in the best possible manner with this Go To Market Approach For New Product KPI Dashboard To Monitor Sales Performance Clipart PDF Use them to share invaluable insights on Kpi Dashboard To Monitor Sales Performance and impress your audience. This template can be altered and modified as per your expectations. So, grab it now.

Social Media Kpi Analytics Measurement Business Social Strategy Guide Infographics PDF
This template covers key performance indicator KPI to determine the performance against the company objectives. These Social media KPIs would be focusing on social engagements, content reach, purchase leads and conversions. If you are looking for a format to display your unique thoughts, then the professionally designed Social Media Kpi Analytics Measurement Business Social Strategy Guide Infographics PDF is the one for you. You can use it as a Google Slides template or a PowerPoint template. Incorporate impressive visuals, symbols, images, and other charts. Modify or reorganize the text boxes as you desire. Experiment with shade schemes and font pairings. Alter, share or cooperate with other people on your work. Download Social Media Kpi Analytics Measurement Business Social Strategy Guide Infographics PDF and find out how to give a successful presentation. Present a perfect display to your team and make your presentation unforgettable.

Executing Risk Mitigation KPI Dashboard To Track Effectiveness Of Real Estate Rules PDF
The following slide exhibits key performance indicator KPI dashboard which can be used to measure the financial performance of the real estate company. It covers various KPIs such as sales vs target per agent, top 10 projects, top 5 agencies etc. Find highly impressive Executing Risk Mitigation KPI Dashboard To Track Effectiveness Of Real Estate Rules PDF on Slidegeeks to deliver a meaningful presentation. You can save an ample amount of time using these presentation templates. No need to worry to prepare everything from scratch because Slidegeeks experts have already done a huge research and work for you. You need to download Executing Risk Mitigation Kpi Dashboard To Track Effectiveness Of Real Estate Rules PDF for your upcoming presentation. All the presentation templates are 100 percent editable and you can change the color and personalize the content accordingly. Download now.
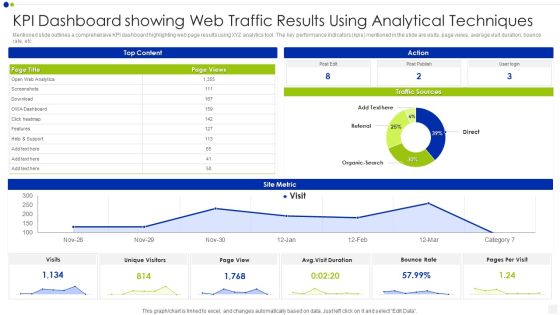
KPI Dashboard Showing Web Traffic Results Using Analytical Techniques Inspiration PDF
Mentioned slide outlines a comprehensive KPI dashboard highlighting web page results using XYZ analytics tool. The key performance indicators kpis mentioned in the slide are visits, page views, average visit duration, bounce rate, etc. Pitch your topic with ease and precision using this kpi dashboard showing web traffic results using analytical techniques inspiration pdf. This layout presents information on bounce rate, traffic sources, analytics. It is also available for immediate download and adjustment. So, changes can be made in the color, design, graphics or any other component to create a unique layout.
KPI Framework For Quality Assurance Management Ppt PowerPoint Presentation File Icons PDF
This slide illustrates multiple key performance indicator framework for quality assurance management such as customer complaints, scrap rate, defects and yield. Quality assurance department plays a critical role in maintaining the superior quality of products. Pitch your topic with ease and precision using this kpi framework for quality assurance management ppt powerpoint presentation file icons pdf This layout presents information on kpi framework for quality assurance management . It is also available for immediate download and adjustment. So, changes can be made in the color, design, graphics or any other component to create a unique layout.

Implementing Brand Leadership Kpi Dashboard To Track Brand Performance Themes PDF
Mentioned slide showcases KPI dashboard that can be used to check the financial performance of a brand. Metrics covered in the dashboard are return on assets, working capital ratio, return on equity etc. This Implementing Brand Leadership Kpi Dashboard To Track Brand Performance Themes PDF is perfect for any presentation, be it in front of clients or colleagues. It is a versatile and stylish solution for organizing your meetings. The Implementing Brand Leadership Kpi Dashboard To Track Brand Performance Themes PDF features a modern design for your presentation meetings. The adjustable and customizable slides provide unlimited possibilities for acing up your presentation. Slidegeeks has done all the homework before launching the product for you. So, dont wait, grab the presentation templates today.

Brand Management Strategy To Increase Awareness KPI Dashboard To Track Brand Performance Slides PDF
Mentioned slide showcases KPI dashboard that can be used to check the financial performance of a brand. Metrics covered in the dashboard are return on assets, working capital ratio, return on equity etc. This Brand Management Strategy To Increase Awareness KPI Dashboard To Track Brand Performance Slides PDF is perfect for any presentation, be it in front of clients or colleagues. It is a versatile and stylish solution for organizing your meetings. The Brand Management Strategy To Increase Awareness KPI Dashboard To Track Brand Performance Slides PDF features a modern design for your presentation meetings. The adjustable and customizable slides provide unlimited possibilities for acing up your presentation. Slidegeeks has done all the homework before launching the product for you. So, dont wait, grab the presentation templates today

Building Brand Leadership Strategy To Dominate The Market KPI Dashboard To Track Brand Performance Formats PDF
Mentioned slide showcases KPI dashboard that can be used to check the financial performance of a brand. Metrics covered in the dashboard are return on assets, working capital ratio, return on equity etc.This Building Brand Leadership Strategy To Dominate The Market KPI Dashboard To Track Brand Performance Formats PDF is perfect for any presentation, be it in front of clients or colleagues. It is a versatile and stylish solution for organizing your meetings. The Building Brand Leadership Strategy To Dominate The Market KPI Dashboard To Track Brand Performance Formats PDF features a modern design for your presentation meetings. The adjustable and customizable slides provide unlimited possibilities for acing up your presentation. Slidegeeks has done all the homework before launching the product for you. So, dont wait, grab the presentation templates today

Data Safety Initiatives KPI Dashboard To Track Security Risk Events Portrait PDF
This slide displays KPI dashboard that company will use to track multiple risk events. Metrics covered in the dashboard are residual risks by period and risk category by total risk rating. Deliver and pitch your topic in the best possible manner with this data safety initiatives kpi dashboard to track security risk events portrait pdf. Use them to share invaluable insights on risk category, total risk rating, residual risk by period, technology risk and impress your audience. This template can be altered and modified as per your expectations. So, grab it now.

KPI Dashboard To Assess Facebook Business Marketing Approach Performance Portrait PDF
This slide covers KPI dashboard to assess Facebook marketing strategy performance. It involves details such as audience engagement, page engagement, page likes and post shares. Pitch your topic with ease and precision using this KPI Dashboard To Assess Facebook Business Marketing Approach Performance Portrait PDF. This layout presents information on Audience Engagement, Page Engagement, Post Comments. It is also available for immediate download and adjustment. So, changes can be made in the color, design, graphics or any other component to create a unique layout.

Effective Product Positioning Approach Brand Awareness Measuring Kpi Dashboard Ideas PDF
Following slide illustrates KPI dashboard that can be used to track the awareness level of a specific brand. KPIs covered in the slide are traffic, attention, authority, inbound channel performance etc. Boost your pitch with our creative Effective Product Positioning Approach Brand Awareness Measuring Kpi Dashboard Ideas PDF. Deliver an awe-inspiring pitch that will mesmerize everyone. Using these presentation templates you will surely catch everyones attention. You can browse the ppts collection on our website. We have researchers who are experts at creating the right content for the templates. So you do not have to invest time in any additional work. Just grab the template now and use them.

 Home
Home