Kpi Analysis

Ecommerce Management Ecommerce Management KPI Metrics Delivery Ppt Outline Clipart PDF
This is a ecommerce management ecommerce management kpi metrics delivery ppt outline clipart pdf template with various stages. Focus and dispense information on four stages using this creative set, that comes with editable features. It contains large content boxes to add your information on topics like average order value, gross profit margin, cart abandonment, viral coefficient. You can also showcase facts, figures, and other relevant content using this PPT layout. Grab it now.
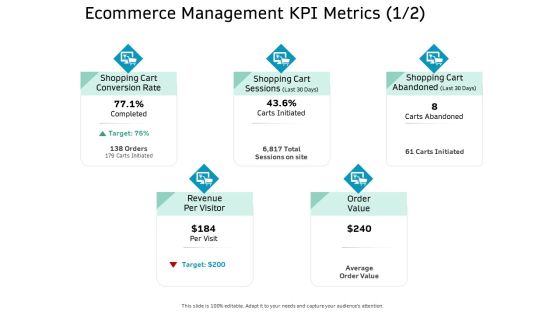
Ecommerce Solution Providers Ecommerce Management KPI Metrics Delivery Ppt Portfolio Structure PDF
Presenting ecommerce solution providers ecommerce management kpi metrics delivery ppt portfolio structure pdf to provide visual cues and insights. Share and navigate important information on five stages that need your due attention. This template can be used to pitch topics like conversion rate, revenue, value, target. In addtion, this PPT design contains high resolution images, graphics, etc, that are easily editable and available for immediate download.
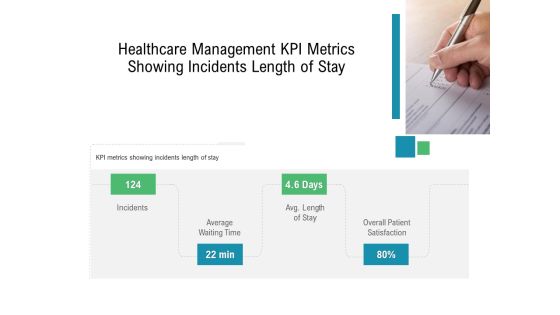
Hospital Management Healthcare Management KPI Metrics Showing Incidents Length Of Stay Ppt Pictures Graphics PDF
This is a hospital management healthcare management kpi metrics showing incidents length of stay ppt pictures graphics pdf template with various stages. Focus and dispense information on four stages using this creative set, that comes with editable features. It contains large content boxes to add your information on topics like incidents, average waiting time, avg length of stay, overall patient satisfaction. You can also showcase facts, figures, and other relevant content using this PPT layout. Grab it now.

Hospital Management Healthcare Management KPI Metrics Showing Treatment Cost And Waiting Time Ppt Inspiration PDF
Presenting hospital management healthcare management kpi metrics showing treatment cost and waiting time ppt inspiration pdf to provide visual cues and insights. Share and navigate important information on three stages that need your due attention. This template can be used to pitch topics like average treatment cost all ages, average nurse patient ratio, average time to see a doctor. In addtion, this PPT design contains high resolution images, graphics, etc, that are easily editable and available for immediate download.
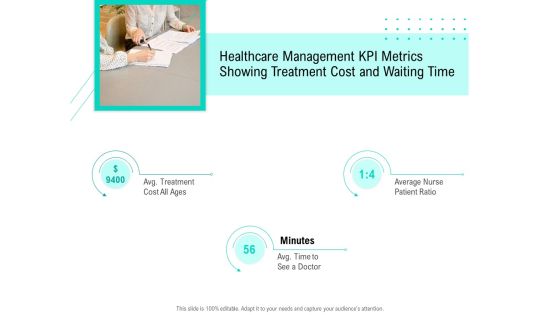
Nursing Administration Healthcare Management KPI Metrics Showing Treatment Cost And Waiting Time Ppt Gallery Slides PDF
Presenting nursing administration healthcare management kpi metrics showing treatment cost and waiting time ppt gallery slides pdf to provide visual cues and insights. Share and navigate important information on three stages that need your due attention. This template can be used to pitch topics like average treatment cost all ages, average nurse patient ratio, average time to see a doctor. In addtion, this PPT design contains high resolution images, graphics, etc, that are easily editable and available for immediate download.

E Healthcare Management System Healthcare Management KPI Metrics Showing Incidents Length Of Stay Graphics PDF
This is a e healthcare management system healthcare management kpi metrics showing incidents length of stay graphics pdf template with various stages. Focus and dispense information on four stages using this creative set, that comes with editable features. It contains large content boxes to add your information on topics like incidents, average waiting time, avg length of stay, overall patient satisfaction. You can also showcase facts, figures, and other relevant content using this PPT layout. Grab it now.
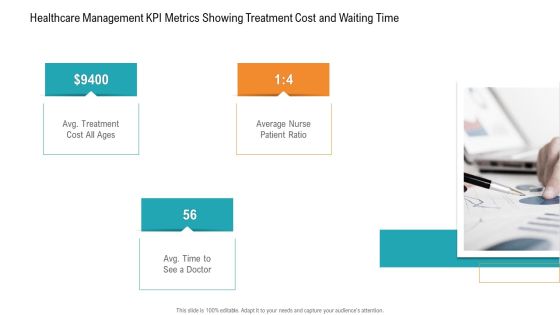
E Healthcare Management System Healthcare Management KPI Metrics Showing Treatment Cost And Waiting Time Template PDF
Presenting e healthcare management system healthcare management kpi metrics showing treatment cost and waiting time template pdf to provide visual cues and insights. Share and navigate important information on three stages that need your due attention. This template can be used to pitch topics like average treatment cost all ages, average nurse patient ratio, average time to see a doctor. In addtion, this PPT design contains high resolution images, graphics, etc, that are easily editable and available for immediate download.
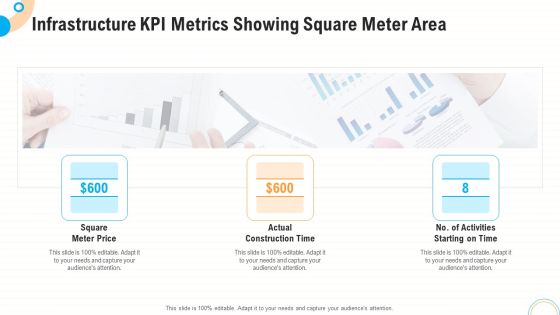
Fiscal And Operational Assessment Infrastructure KPI Metrics Showing Square Meter Area Guidelines PDF
Presenting fiscal and operational assessment infrastructure kpi metrics showing square meter area guidelines pdf to provide visual cues and insights. Share and navigate important information on three stages that need your due attention. This template can be used to pitch topics like square meter price, actual construction time, activities starting. In addtion, this PPT design contains high resolution images, graphics, etc, that are easily editable and available for immediate download.

Healthcare Management Healthcare Management KPI Metrics Showing Incidents Length Of Stay Ppt Outline Slide Portrait PDF
This is a healthcare management healthcare management kpi metrics showing incidents length of stay ppt outline slide portrait pdf template with various stages. Focus and dispense information on four stages using this creative set, that comes with editable features. It contains large content boxes to add your information on topics like incidents, average waiting time, avg length of stay, overall patient satisfaction. You can also showcase facts, figures, and other relevant content using this PPT layout. Grab it now.
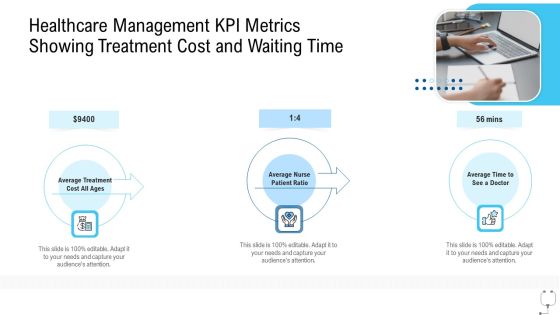
Healthcare Management Healthcare Management KPI Metrics Showing Treatment Cost And Waiting Time Ppt Infographics Example PDF
Presenting healthcare management healthcare management kpi metrics showing treatment cost and waiting time ppt infographics example pdf to provide visual cues and insights. Share and navigate important information on three stages that need your due attention. This template can be used to pitch topics like average treatment cost all ages, average nurse patient ratio, average time to see a doctor. In addtion, this PPT design contains high resolution images, graphics, etc, that are easily editable and available for immediate download.

Hospital Administration Healthcare Management KPI Metrics Showing Incidents Length Of Stay Ppt File Introduction PDF
This is a hospital administration healthcare management kpi metrics showing incidents length of stay ppt file introduction pdf template with various stages. Focus and dispense information on four stages using this creative set, that comes with editable features. It contains large content boxes to add your information on topics like incidents, average waiting time, avg length of stay, overall patient satisfaction. You can also showcase facts, figures, and other relevant content using this PPT layout. Grab it now.

Financial Functional Assessment Infrastructure KPI Metrics Showing Cost Saving Professional PDF
This is a financial functional assessment infrastructure kpi metrics showing cost saving professional pdf template with various stages. Focus and dispense information on three stages using this creative set, that comes with editable features. It contains large content boxes to add your information on topics like cost savings, net project revenue, defects. You can also showcase facts, figures, and other relevant content using this PPT layout. Grab it now.
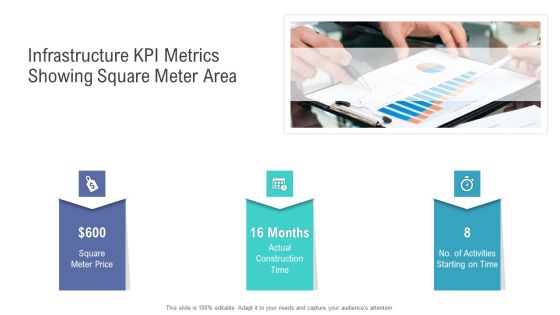
Financial Functional Assessment Infrastructure KPI Metrics Showing Square Meter Area Summary PDF
Presenting financial functional assessment infrastructure kpi metrics showing square meter area summary pdf to provide visual cues and insights. Share and navigate important information on three stages that need your due attention. This template can be used to pitch topics like square meter price, actual construction time, activities. In addition, this PPT design contains high-resolution images, graphics, etc, that are easily editable and available for immediate download.

Pharmaceutical Management Healthcare Management KPI Metrics Showing Incidents Length Of Stay Ppt Gallery Example PDF
This is a pharmaceutical management healthcare management kpi metrics showing incidents length of stay ppt gallery example pdf template with various stages. Focus and dispense information on four stages using this creative set, that comes with editable features. It contains large content boxes to add your information on topics like incidents, average waiting time, avg length of stay, overall patient satisfaction. You can also showcase facts, figures, and other relevant content using this PPT layout. Grab it now.

Pharmaceutical Management Healthcare Management KPI Metrics Showing Treatment Cost And Waiting Time Ppt Ideas Format PDF
Presenting pharmaceutical management healthcare management kpi metrics showing treatment cost and waiting time ppt ideas format pdf to provide visual cues and insights. Share and navigate important information on three stages that need your due attention. This template can be used to pitch topics like average treatment cost all ages, average nurse patient ratio, average time to see a doctor. In addtion, this PPT design contains high resolution images, graphics, etc, that are easily editable and available for immediate download.

Agenda For Sustainability Calculation With KPI Ppt PowerPoint Presentation Gallery Designs PDF
This is a agenda for sustainability calculation with kpi ppt powerpoint presentation gallery designs pdf template with various stages. Focus and dispense information on three stages using this creative set, that comes with editable features. It contains large content boxes to add your information on topics like financial profitability, employee performance, customer satisfaction. You can also showcase facts, figures, and other relevant content using this PPT layout. Grab it now.
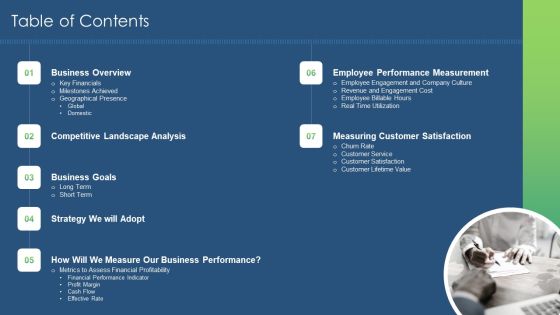
Sustainability Calculation With KPI Table Of Contents Ppt PowerPoint Presentation File Ideas PDF
This is a sustainability calculation with kpi table of contents ppt powerpoint presentation file ideas pdf template with various stages. Focus and dispense information on seven stages using this creative set, that comes with editable features. It contains large content boxes to add your information on topics like business overview, business goals, customer satisfaction, employee performance measurement. You can also showcase facts, figures, and other relevant content using this PPT layout. Grab it now.
KPI To Track Performance Of Restaurant Action Plan For Fast Food Themes PDF
Following slide presents major key performance indicators that can be used by managers in order to track the performance of restaurants. Major key performance indicators include average table occupancy, revenue per seat, online reviews, etc. Showcasing this set of slides titled KPI To Track Performance Of Restaurant Action Plan For Fast Food Themes PDF. The topics addressed in these templates are Customer Retention Rate, Social Engagement, Website Traffic. All the content presented in this PPT design is completely editable. Download it and make adjustments in color, background, font etc. as per your unique business setting.
Sustainability Calculation With KPI Long Term Goals Of The Company Ppt PowerPoint Presentation Gallery Icon PDF
This slide shows long term goals set by the firm. Goals covered are to enlist the company fortune 500, to acquire product market share in US alone and to become top FMCG company in North America. Presenting sustainability calculation with kpi long term goals of the company ppt powerpoint presentation gallery icon pdf to provide visual cues and insights. Share and navigate important information on five stages that need your due attention. This template can be used to pitch topics like long term goals of the company. In addtion, this PPT design contains high resolution images, graphics, etc, that are easily editable and available for immediate download.
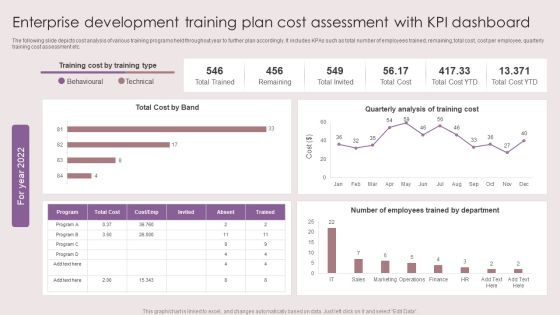
Enterprise Development Training Plan Cost Assessment With KPI Dashboard Mockup PDF
The following slide depicts cost analysis of various training programs held throughout year to further plan accordingly. It includes KPAs such as total number of employees trained, remaining, total cost, cost per employee, quarterly training cost assessment etc. Showcasing this set of slides titled Enterprise Development Training Plan Cost Assessment With KPI Dashboard Mockup PDF. The topics addressed in these templates are Total Cost Band, Quarterly Analysis, Training Cost. All the content presented in this PPT design is completely editable. Download it and make adjustments in color, background, font etc. as per your unique business setting.

Decision Making Analysis For Supporting Business Decisions Ideas PDF
Persuade your audience using this decision making analysis for supporting business decisions ideas pdf. This PPT design covers seven stages, thus making it a great tool to use. It also caters to a variety of topics including marketing kpi system, competing product analysis, market choice analysis. Download this PPT design now to present a convincing pitch that not only emphasizes the topic but also showcases your presentation skills.
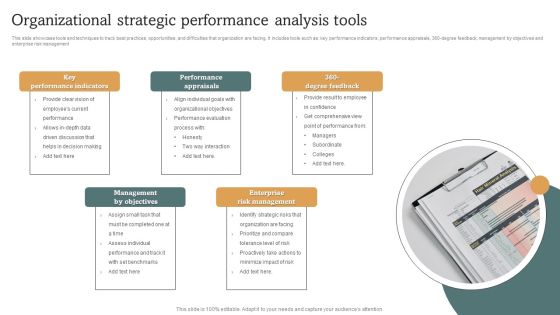
Organizational Strategic Performance Analysis Tools Structure PDF
This slide showcase tools and techniques to track best practices, opportunities, and difficulties that organization are facing. It includes tools such as key performance indicators, performance appraisals, 360 degree feedback, management by objectives and enterprise risk management. Persuade your audience using this Organizational Strategic Performance Analysis Tools Structure PDF. This PPT design covers five stages, thus making it a great tool to use. It also caters to a variety of topics including Management By Objectives, Performance Appraisals, Key Performance Indicators. Download this PPT design now to present a convincing pitch that not only emphasizes the topic but also showcases your presentation skills.
Procurement Kpi Dashboard For Tracking Supplier Action Plan Impact Graphics PDF
This slide covers procurement spend analysis dashboard for tracking new supplier strategy results. It include KPIs such as invoice count, invoices information, due dates, spend by payment terms, supplier payment terms, spend by entity, spend by category, spend by country. Showcasing this set of slides titled procurement kpi dashboard for tracking supplier action plan impact graphics pdf. The topics addressed in these templates are procurement kpi dashboard for tracking supplier action plan impact. All the content presented in this PPT design is completely editable. Download it and make adjustments in color, background, font etc. as per your unique business setting.
Google Keyword Assessment KPI Dashboard For Tracking Improvement In Website Traffic Infographics PDF
Following slide demonstrates keyword analysis dashboard which can be used by business to track website traffic performance. It includes metrics such as average keyword position, keyword ranking distribution, keyword ranking, keyword in top 3, top 10, top 20 and top 100. Showcasing this set of slides titled Google Keyword Assessment KPI Dashboard For Tracking Improvement In Website Traffic Infographics PDF. The topics addressed in these templates are Keyword Ranking, Keyword Ranking Distribution, Average Keyword Position. All the content presented in this PPT design is completely editable. Download it and make adjustments in color, background, font etc. as per your unique business setting.

Strategic Performance Analysis Tools Survey Microsoft PDF
This slide showcase survey result of 300 professional organization using strategic performance measurement tools. It includes elements such as key performance indicators, performance appraisal method, six sigma method, 360 degree feedback etc. Pitch your topic with ease and precision using this Strategic Performance Analysis Tools Survey Microsoft PDF. This layout presents information on Strategic Performance, Analysis Tools Survey. It is also available for immediate download and adjustment. So, changes can be made in the color, design, graphics or any other component to create a unique layout.
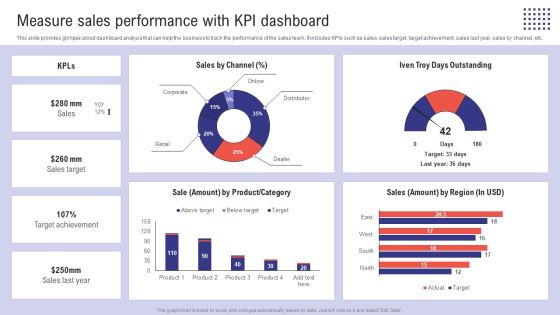
Planning Sales Campaign To Improve Measure Sales Performance With Kpi Dashboard Topics PDF
This slide provides glimpse about dashboard analysis that can help the business to track the performance of the sales team. It includes KPIs such as sales, sales target, target achievement, sales last year, sales by channel, etc. Explore a selection of the finest Planning Sales Campaign To Improve Measure Sales Performance With Kpi Dashboard Topics PDF here. With a plethora of professionally designed and pre-made slide templates, you can quickly and easily find the right one for your upcoming presentation. You can use our Planning Sales Campaign To Improve Measure Sales Performance With Kpi Dashboard Topics PDF to effectively convey your message to a wider audience. Slidegeeks has done a lot of research before preparing these presentation templates. The content can be personalized and the slides are highly editable. Grab templates today from Slidegeeks.
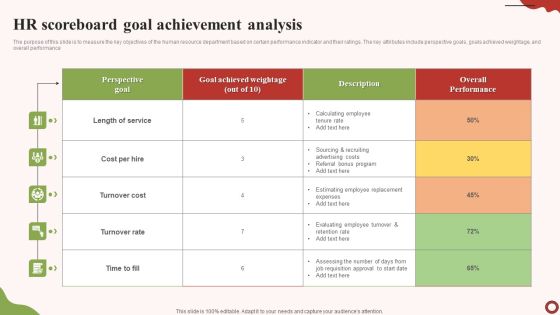
HR Scoreboard Goal Achievement Analysis Structure PDF
The purpose of this slide is to measure the key objectives of the human resource department based on certain performance indicator and their ratings. The key attributes include perspective goals, goals achieved weightage, and overall performance. Showcasing this set of slides titled HR Scoreboard Goal Achievement Analysis Structure PDF. The topics addressed in these templates are Length Service, Cost Per Hire, Turnover Cost. All the content presented in this PPT design is completely editable. Download it and make adjustments in color, background, font etc. as per your unique business setting.

Email Marketing Campaigns Performance Analysis Brochure PDF
This slide covers an email marketing activity tracking sheet for understanding how subscribers react to the campaign and improve it depending on the results. It includes evaluation metrics such as open rate, click through rate, click to open rate, unsubscribe rate, and spam rate. Get a simple yet stunning designed Email Marketing Campaigns Performance Analysis Brochure PDF. It is the best one to establish the tone in your meetings. It is an excellent way to make your presentations highly effective. So, download this PPT today from Slidegeeks and see the positive impacts. Our easy to edit Email Marketing Campaigns Performance Analysis Brochure PDF can be your go to option for all upcoming conferences and meetings. So, what are you waiting for Grab this template today.
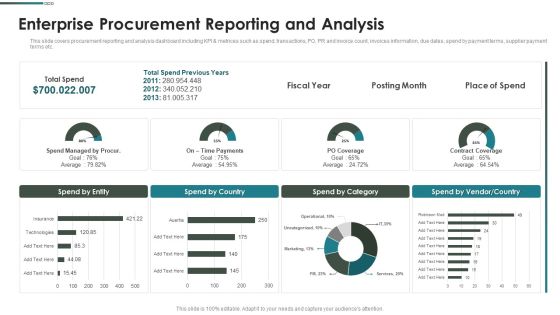
Purchase Assessment Process Enterprise Procurement Reporting And Analysis Infographics PDF
This slide covers procurement reporting and analysis dashboard including KPI metrices such as spend, transactions, PO, PR and invoice count, invoices information, due dates, spend by payment terms, supplier payment terms etc. Deliver an awe inspiring pitch with this creative Purchase Assessment Process Enterprise Procurement Reporting And Analysis Infographics PDF bundle. Topics like Spend Entity, Spend Country, Spend Category can be discussed with this completely editable template. It is available for immediate download depending on the needs and requirements of the user.

Financial Management Kpi Metrics Business Ppt Powerpoint Presentation Gallery File Formats
This is a financial management kpi metrics business ppt powerpoint presentation gallery file formats. This is a four stage process. The stages in this process are finance, marketing, management, investment, analysis.

Financial Management Kpi Metrics Process Ppt Powerpoint Presentation Slides Graphics Download
This is a financial management kpi metrics process ppt powerpoint presentation slides graphics download. This is a four stage process. The stages in this process are finance, marketing, management, investment, analysis.

Supply Chain Kpi Dashboard Ppt PowerPoint Presentation Complete Deck With Slides
This is a supply chain kpi dashboard ppt powerpoint presentation complete deck with slides. This is a one stage process. The stages in this process are business, strategy, marketing, analysis, business model.
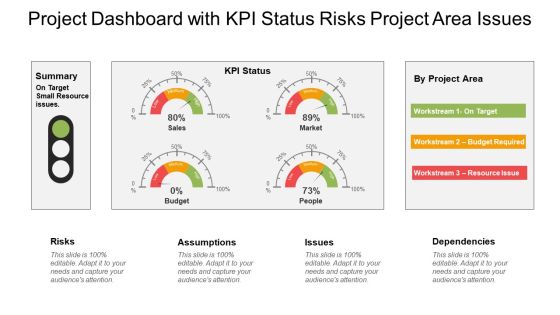
Project Summary Dashboard With Kpi Status Ppt PowerPoint Presentation Slides Show
This is a project summary dashboard with kpi status ppt powerpoint presentation slides show. This is a three stage process. The stages in this process are project analysis, project review, project performance management.
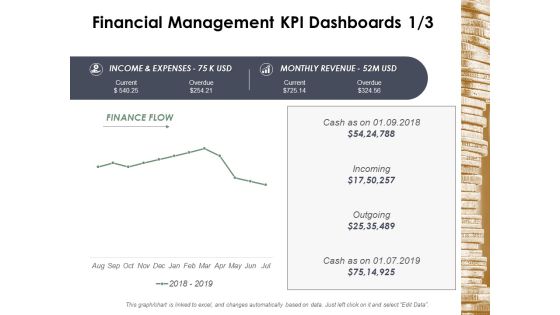
Financial Management Kpi Dashboards Business Ppt Powerpoint Presentation Infographic Template Deck
This is a financial management kpi dashboards business ppt powerpoint presentation infographic template deck. This is a four stage process. The stages in this process are finance, marketing, management, investment, analysis.

Financial Management Kpi Dashboards Strategy Ppt Powerpoint Presentation Gallery Graphics Template
This is a financial management kpi dashboards strategy ppt powerpoint presentation gallery graphics template. This is a six stage process. The stages in this process are finance, marketing, management, investment, analysis.
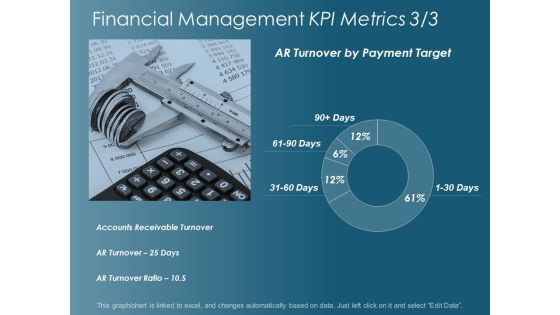
Financial Management Kpi Metrics Management Ppt Powerpoint Presentation Infographic Template Graphic Images
This is a financial management kpi metrics management ppt powerpoint presentation infographic template graphic images. This is a four stage process. The stages in this process are finance, marketing, management, investment, analysis.

Financial Management Kpi Metrics Operating Profit Margin Ppt Powerpoint Presentation Infographic Template Images
This is a financial management kpi metrics operating profit margin ppt powerpoint presentation infographic template images. This is a three stage process. The stages in this process are finance, marketing, management, investment, analysis.

Retail KPI Dashboard Showing Revenue Vs Units Sold Ppt PowerPoint Presentation Professional Smartart
This is a retail kpi dashboard showing revenue vs units sold ppt powerpoint presentation professional smartart. This is a four stage process. The stages in this process are finance, analysis, business, investment, marketing.

Retail KPI Dashboard Showing Sales Revenue Customers Ppt PowerPoint Presentation Show Background Designs
This is a retail kpi dashboard showing sales revenue customers ppt powerpoint presentation show background designs. This is a six stage process. The stages in this process are finance, analysis, business, investment, marketing.
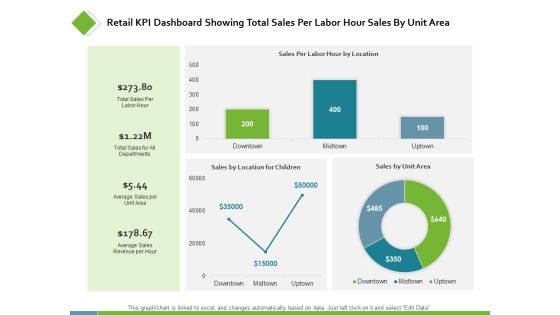
Retail KPI Dashboard Showing Total Sales Per Labor Ppt PowerPoint Presentation Styles Examples
This is a retail kpi dashboard showing total sales per labor ppt powerpoint presentation styles examples. This is a three stage process. The stages in this process are finance, analysis, business, investment, marketing.

Retail Kpi Dashboard Showing Revenue Vs Units Sold Ppt PowerPoint Presentation File Formats
This is a retail kpi dashboard showing revenue vs units sold ppt powerpoint presentation file formats. This is a three stage process. The stages in this process are finance, marketing, management, investment, analysis.

Supply Chain Management Kpi Dashboard Marketing Ppt PowerPoint Presentation File Tips
This is a supply chain management kpi dashboard marketing ppt powerpoint presentation file tips. This is a three stage process. The stages in this process are finance, marketing, management, investment, analysis.
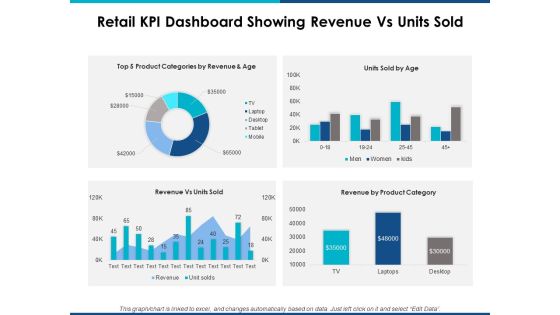
Retail Kpi Dashboard Showing Revenue Vs Units Sold Ppt Powerpoint Presentation Layouts Show
This is a retail kpi dashboard showing revenue vs units sold ppt powerpoint presentation layouts show. This is a four stage process. The stages in this process are finance, marketing, management, investment, analysis.
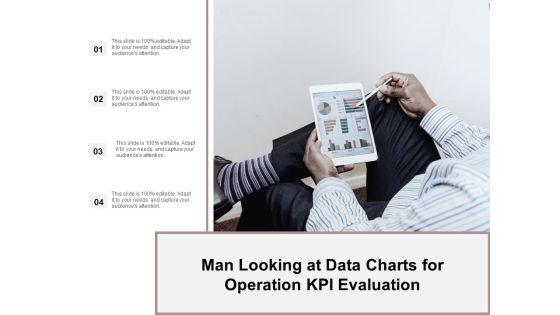
Man Looking At Data Charts For Operation Kpi Evaluation Ppt Powerpoint Presentation Ideas Demonstration
This is a man looking at data charts for operation kpi evaluation ppt powerpoint presentation ideas demonstration. This is a four stage process. The stages in this process are business metrics, business kpi, business dashboard.
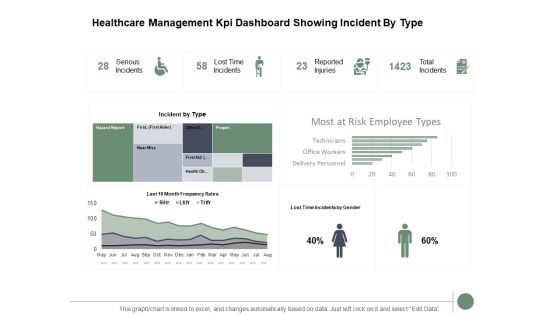
Healthcare Management Kpi Dashboard Showing Incident By Type Ppt PowerPoint Presentation Gallery Slide Download
Presenting this set of slides with name healthcare management kpi dashboard showing incident by type ppt powerpoint presentation gallery slide download. The topics discussed in these slides are bar graph, finance, marketing, analysis, investment. This is a completely editable PowerPoint presentation and is available for immediate download. Download now and impress your audience.
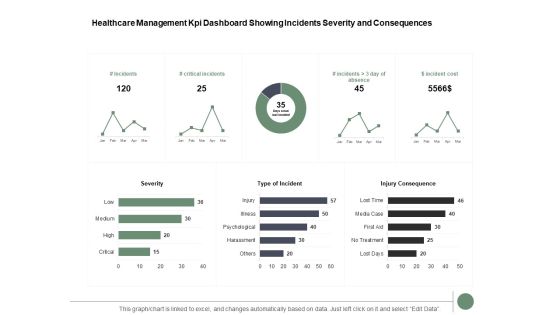
Healthcare Management Kpi Dashboard Showing Incidents Severity And Consequences Ppt PowerPoint Presentation Inspiration Summary
Presenting this set of slides with name healthcare management kpi dashboard showing incidents severity and consequences ppt powerpoint presentation inspiration summary. The topics discussed in these slides are bar graph, finance, marketing, analysis, investment. This is a completely editable PowerPoint presentation and is available for immediate download. Download now and impress your audience.

Healthcare Management KPI Dashboard For Organizations Ppt PowerPoint Presentation Summary Maker
Presenting this set of slides with name healthcare management kpi dashboard for organizations ppt powerpoint presentation summary maker. The topics discussed in these slides are finance, marketing, management, investment, analysis. This is a completely editable PowerPoint presentation and is available for immediate download. Download now and impress your audience.
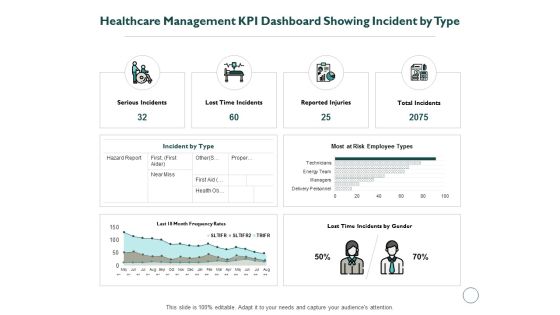
Healthcare Management KPI Dashboard Showing Incident By Type Ppt PowerPoint Presentation Inspiration Graphics Template
Presenting this set of slides with name healthcare management kpi dashboard showing incident by type ppt powerpoint presentation inspiration graphics template. The topics discussed in these slides are finance, marketing, management, investment, analysis. This is a completely editable PowerPoint presentation and is available for immediate download. Download now and impress your audience.

Healthcare Management KPI Dashboard Showing Incidents Severity And Consequences Ppt PowerPoint Presentation Inspiration Example File
Presenting this set of slides with name healthcare management kpi dashboard showing incidents severity and consequences ppt powerpoint presentation inspiration example file. The topics discussed in these slides are finance, marketing, management, investment, analysis. This is a completely editable PowerPoint presentation and is available for immediate download. Download now and impress your audience.
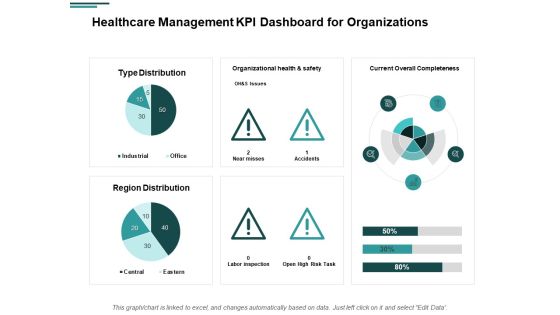
Healthcare Management KPI Dashboard For Organizations Ppt PowerPoint Presentation Portfolio Example
Presenting this set of slides with name healthcare management kpi dashboard for organizations ppt powerpoint presentation portfolio example. The topics discussed in these slides are finance, marketing, management, investment, analysis. This is a completely editable PowerPoint presentation and is available for immediate download. Download now and impress your audience.
Healthcare Management KPI Dashboard Showing Incidents Severity And Consequences Ppt PowerPoint Presentation Icon Model
Presenting this set of slides with name healthcare management kpi dashboard showing incidents severity and consequences ppt powerpoint presentation icon model. The topics discussed in these slides are finance, marketing, management, investment, analysis. This is a completely editable PowerPoint presentation and is available for immediate download. Download now and impress your audience.
IT Cost Assessment With KPI Dashboard To Gain Competitive Advantage Icons PDF
Showcasing this set of slides titled IT Cost Assessment With KPI Dashboard To Gain Competitive Advantage Icons PDF. The topics addressed in these templates are Actual Cost, Yearly Analysis, Breakdown Chart. All the content presented in this PPT design is completely editable. Download it and make adjustments in color, background, font etc. as per your unique business setting.
Interpreting Market Kinetics Influence Customer Purchasing KPI Dashboard To Monitor Icons PDF
Mentioned slide shows the KPI dashboard that can be used to track win and lost sales opportunities. It includes metrics namely won opportunities, lost opportunities, pipeline by territory, total opportunities. Deliver an awe inspiring pitch with this creative interpreting market kinetics influence customer purchasing kpi dashboard to monitor icons pdf bundle. Topics like kpi dashboard to monitor sales opportunities can be discussed with this completely editable template. It is available for immediate download depending on the needs and requirements of the user.

Market Research To Determine Business Opportunities Brand Analytics KPI Dashboard For Organization Inspiration PDF
The following slide outlines key performance indicator KPI dashboard that can assist marketers to evaluate brand performance on social media channels. The metrics covered are age group, gender, brand perception, branding themes, celebrity analysis, etc. There are so many reasons you need a Market Research To Determine Business Opportunities Brand Analytics KPI Dashboard For Organization Inspiration PDF. The first reason is you cannot spend time making everything from scratch, Thus, Slidegeeks has made presentation templates for you too. You can easily download these templates from our website easily.

Comprehensive Market Research Guide Brand Analytics Kpi Dashboard For Organization Brochure PDF
The following slide outlines key performance indicator KPI dashboard that can assist marketers to evaluate brand performance on social media channels. The metrics covered are age group, gender, brand perception, branding themes, celebrity analysis, etc. From laying roadmaps to briefing everything in detail, our templates are perfect for you. You can set the stage with your presentation slides. All you have to do is download these easy-to-edit and customizable templates. Comprehensive Market Research Guide Brand Analytics Kpi Dashboard For Organization Brochure PDF will help you deliver an outstanding performance that everyone would remember and praise you for. Do download this presentation today.

Brand Analytics KPI Dashboard For Organization Ppt PowerPoint Presentation Diagram PDF
The following slide outlines key performance indicator KPI dashboard that can assist marketers to evaluate brand performance on social media channels. The metrics covered are age group, gender, brand perception, branding themes, celebrity analysis, etc. Take your projects to the next level with our ultimate collection of Brand Analytics KPI Dashboard For Organization Ppt PowerPoint Presentation Diagram PDF. Slidegeeks has designed a range of layouts that are perfect for representing task or activity duration, keeping track of all your deadlines at a glance. Tailor these designs to your exact needs and give them a truly corporate look with your own brand colors they will make your projects stand out from the rest.
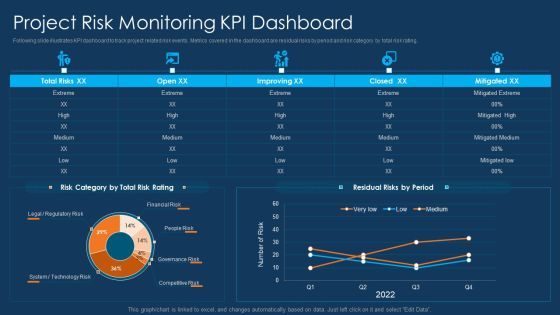
Information Technology Project Initiation Project Risk Monitoring Kpi Dashboard Background PDF
Following slide illustrates KPI dashboard to track project related risk events. Metrics covered in the dashboard are residual risks by period and risk category by total risk rating. Deliver and pitch your topic in the best possible manner with this information technology project initiation project risk monitoring kpi dashboard background pdf. Use them to share invaluable insights on project risk monitoring kpi dashboard and impress your audience. This template can be altered and modified as per your expectations. So, grab it now.
Market Research Assessment Of Target Market Requirements Brand Analytics Kpi Dashboard For Organization Clipart PDF
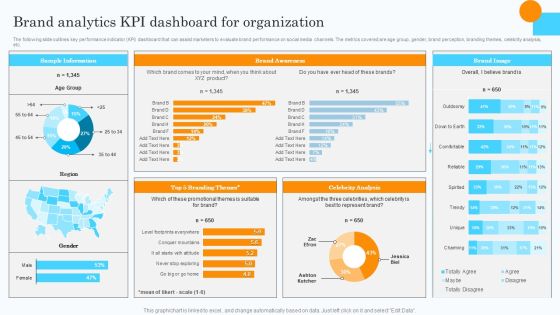
The following slide outlines key performance indicator KPI dashboard that can assist marketers to evaluate brand performance on social media channels. The metrics covered are age group, gender, brand perception, branding themes, celebrity analysis, etc. Do you have an important presentation coming up Are you looking for something that will make your presentation stand out from the rest Look no further than Market Research Assessment Of Target Market Requirements Brand Analytics Kpi Dashboard For Organization Clipart PDF. With our professional designs, you can trust that your presentation will pop and make delivering it a smooth process. And with Slidegeeks, you can trust that your presentation will be unique and memorable. So why wait Grab Market Research Assessment Of Target Market Requirements Brand Analytics Kpi Dashboard For Organization Clipart PDF today and make your presentation stand out from the rest.
Security KPI Dashboard To Identify The Risk Of Application Ppt Icon Show PDF
Showcasing this set of slides titled Security KPI Dashboard To Identify The Risk Of Application Ppt Icon Show PDF. The topics addressed in these templates are Risk Levels, Security KPI Dashboard, Risk Of Application. All the content presented in this PPT design is completely editable. Download it and make adjustments in color, background, font etc. as per your unique business setting.
Icon Of Open Transformation KPI Dashboard With Key Performance Indicators Microsoft PDF
Presenting Icon Of Open Transformation KPI Dashboard With Key Performance Indicators Microsoft PDF to dispense important information. This template comprises four stages. It also presents valuable insights into the topics including Icon Of Open Transformation, KPI Dashboard, Key Performance Indicators. This is a completely customizable PowerPoint theme that can be put to use immediately. So, download it and address the topic impactfully.

 Home
Home