Key Programs
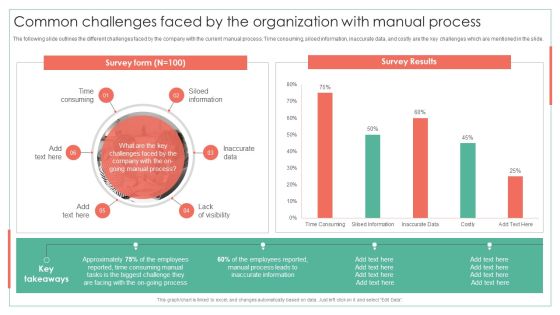
Common Challenges Faced By The Organization With Manual Process Achieving Operational Efficiency Rules PDF
The following slide outlines the different challenges faced by the company with the current manual process. Time consuming, siloed information, inaccurate data, and costly are the key challenges which are mentioned in the slide.Deliver an awe inspiring pitch with this creative Common Challenges Faced By The Organization With Manual Process Achieving Operational Efficiency Rules PDF bundle. Topics like Inaccurate Data, Siloed Information, Time Consuming can be discussed with this completely editable template. It is available for immediate download depending on the needs and requirements of the user.

KPI Dashboard To Track Automation Performance In Employee Onboarding Achieving Operational Efficiency Download PDF
The following slide outlines performance key performance indicator KPI which can be used to evaluate business process automation performance in employee onboarding. The metrics highlighted in the slide are onboarding completion status, hires per office, etc.Deliver an awe inspiring pitch with this creative KPI Dashboard To Track Automation Performance In Employee Onboarding Achieving Operational Efficiency Download PDF bundle. Topics like Onboarding Completion, Onboarding, Onboarding Completion can be discussed with this completely editable template. It is available for immediate download depending on the needs and requirements of the user.
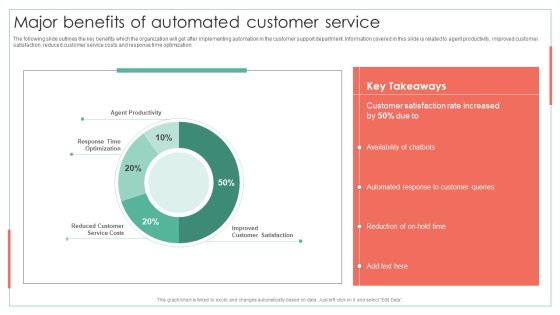
Major Benefits Of Automated Customer Service Achieving Operational Efficiency Graphics PDF
The following slide outlines the key benefits which the organization will get after implementing automation in the customer support department. Information covered in this slide is related to agent productivity, improved customer satisfaction, reduced customer service costs and response time optimization. Deliver an awe inspiring pitch with this creative Major Benefits Of Automated Customer Service Achieving Operational Efficiency Graphics PDF bundle. Topics like Customer Satisfaction, Automated Response, Customer Queries can be discussed with this completely editable template. It is available for immediate download depending on the needs and requirements of the user.
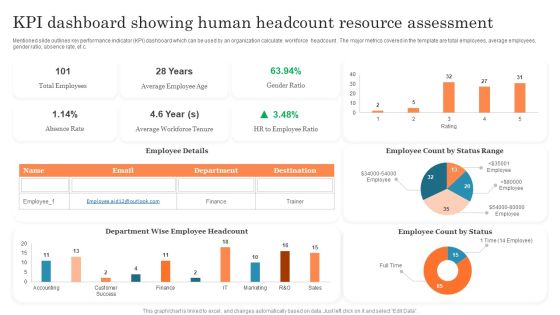
KPI Dashboard Showing Human Headcount Resource Assessment Ppt PowerPoint Presentation Outline PDF
Mentioned slide outlines key performance indicator KPI dashboard which can be used by an organization calculate workforce headcount . The major metrics covered in the template are total employees, average employees, gender ratio, absence rate, etc. Pitch your topic with ease and precision using this KPI Dashboard Showing Human Headcount Resource Assessment Ppt PowerPoint Presentation Outline PDF. This layout presents information on Total Employees, Average Employee, Employee Count. It is also available for immediate download and adjustment. So, changes can be made in the color, design, graphics or any other component to create a unique layout.
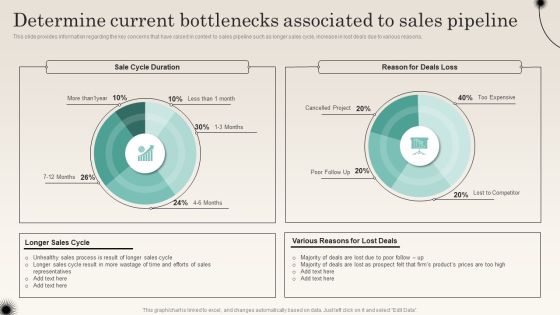
Determine Current Bottlenecks Associated To Sales Pipeline Improving Distribution Channel Graphics PDF
This slide provides information regarding the key concerns that have raised in context to sales pipeline such as longer sales cycle, increase in lost deals due to various reasons. Deliver and pitch your topic in the best possible manner with this Determine Current Bottlenecks Associated To Sales Pipeline Improving Distribution Channel Graphics PDF. Use them to share invaluable insights on Unhealthy Sales, Various Reasons, Lost Prospect and impress your audience. This template can be altered and modified as per your expectations. So, grab it now.

Risk Management KPI Dashboard Of Real Estate Company Rules PDF
The following slide exhibits a key performance indicator KPI dashboard which can be used to evaluate the risks involved in real estate business. The KPIss covered in the slide are corporate risk, control performance, open issues etc. Deliver and pitch your topic in the best possible manner with this Risk Management KPI Dashboard Of Real Estate Company Rules PDF. Use them to share invaluable insights on Risk Management KPI Dashboard, Real Estate Company and impress your audience. This template can be altered and modified as per your expectations. So, grab it now.

3 Vendor Comparison Based On Survey Results Ppt Ideas Graphic Tips PDF
The following slide showcases rank of supplier comparison on the basis of responses obtained from customers. The comparison parameters covered are responsiveness, customer service and focus, reputation, knowledge, on time delivery, service and product quality. Pitch your topic with ease and precision using this 3 Vendor Comparison Based On Survey Results Ppt Ideas Graphic Tips PDF. This layout presents information on Survey Results, Key Insights, Parameters. It is also available for immediate download and adjustment. So, changes can be made in the color, design, graphics or any other component to create a unique layout.

Building Quality Inspection Dashboard With Customer Satisfaction Ratio Icons PDF
The following slide showcases dashboard of construction company exhibiting quality KPIs regarding safety, workmanship and customer satisfaction. Key indicators covered are site inspection success level, CSR, defect count, net promoter score, promotors, passives, defectors, total rework cost, safety meetings and average time taken to fix defects. Showcasing this set of slides titled Building Quality Inspection Dashboard With Customer Satisfaction Ratio Icons PDF. The topics addressed in these templates are Construction Project, Customer Satisfaction Ratio, Promoters. All the content presented in this PPT design is completely editable. Download it and make adjustments in color, background, font etc. as per your unique business setting.
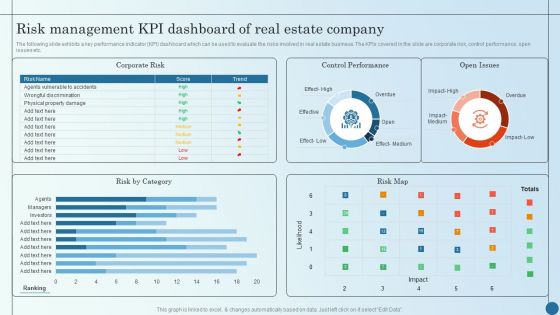
Risk Management KPI Dashboard Of Real Estate Company Managing Commercial Property Risks Elements PDF
The following slide exhibits a key performance indicator KPI dashboard which can be used to evaluate the risks involved in real estate business. The KPIs covered in the slide are corporate risk, control performance, open issues etc.Deliver an awe inspiring pitch with this creative Risk Management KPI Dashboard Of Real Estate Company Managing Commercial Property Risks Elements PDF bundle. Topics like Control Performance, Corporate Risk, Effect Medium can be discussed with this completely editable template. It is available for immediate download depending on the needs and requirements of the user.

KPI Dashboard Highlighting Results Of Multichannel Retail Marketing Rules PDF
The purpose of this slide is to highlight a comprehensive dashboard of omnichannel retail. The key metrics covered in the slide are types of marketing channels, comparison of channels for two different years, transactions by months etc. Pitch your topic with ease and precision using this KPI Dashboard Highlighting Results Of Multichannel Retail Marketing Rules PDF. This layout presents information on Comparison Of Channel Sales, Percentage Of Sales, Transactions By Month. It is also available for immediate download and adjustment. So, changes can be made in the color, design, graphics or any other component to create a unique layout.

Competitor Analysis Based On Top Performing Skus Competitor Vs Our Company Brochure PDF
This slide covers the comparison of competitors top selling categories. It also includes key insights such as consumers likeness to purchase dressier items from our company. Want to ace your presentation in front of a live audience Our Competitor Analysis Based On Top Performing Skus Competitor Vs Our Company Brochure PDF can help you do that by engaging all the users towards you.. Slidegeeks experts have put their efforts and expertise into creating these impeccable powerpoint presentations so that you can communicate your ideas clearly. Moreover, all the templates are customizable, and easy-to-edit and downloadable. Use these for both personal and commercial use.
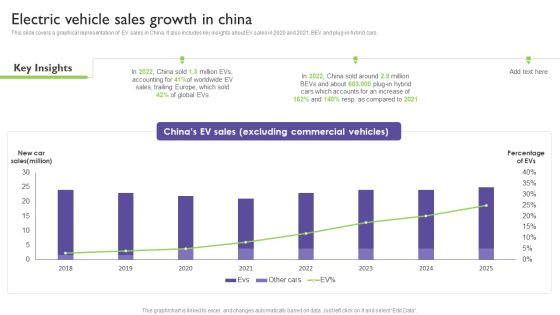
Global Automotive Industry Analysis Electric Vehicle Sales Growth In China Inspiration PDF
This slide covers a graphical representation of EV sales in China. It also includes key insights about EV sales in 2020 and 2021, BEV and plug-in hybrid cars. Make sure to capture your audiences attention in your business displays with our gratis customizable Global Automotive Industry Analysis Electric Vehicle Sales Growth In China Inspiration PDF. These are great for business strategies, office conferences, capital raising or task suggestions. If you desire to acquire more customers for your tech business and ensure they stay satisfied, create your own sales presentation with these plain slides.
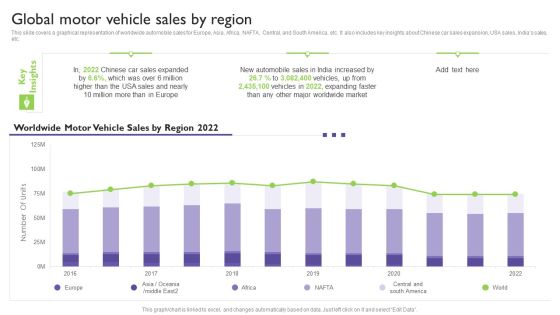
Global Automotive Industry Analysis Global Motor Vehicle Sales By Region Clipart PDF
This slide covers a graphical representation of worldwide automobile sales for Europe, Asia, Africa, NAFTA, Central, and South America, etc. It also includes key insights about Chinese car sales expansion, USA sales, Indias sales, etc. The best PPT templates are a great way to save time, energy, and resources. Slidegeeks have 100 percent editable powerpoint slides making them incredibly versatile. With these quality presentation templates, you can create a captivating and memorable presentation by combining visually appealing slides and effectively communicating your message. Download Global Automotive Industry Analysis Global Motor Vehicle Sales By Region Clipart PDF from Slidegeeks and deliver a wonderful presentation.
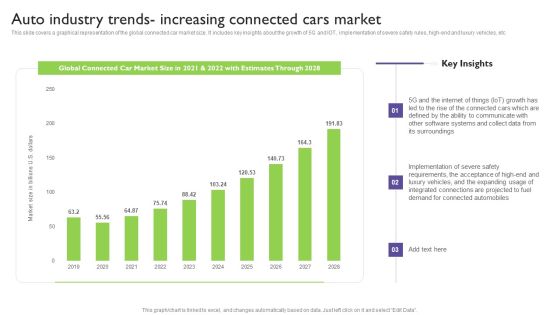
Global Automotive Industry Analysis Auto Industry Trends Increasing Connected Cars Market Pictures PDF
This slide covers a graphical representation of the global connected car market size. It includes key insights about the growth of 5G and IOT, implementation of severe safety rules, high-end and luxury vehicles, etc. Take your projects to the next level with our ultimate collection of Global Automotive Industry Analysis Auto Industry Trends Increasing Connected Cars Market Pictures PDF. Slidegeeks has designed a range of layouts that are perfect for representing task or activity duration, keeping track of all your deadlines at a glance. Tailor these designs to your exact needs and give them a truly corporate look with your own brand colors they will make your projects stand out from the rest.

Buy Side Advisory Services In M And A Mergers And Acquisitions By Sector Introduction PDF
The slide illustrates the graph of number of merger and acquisition deals by sector that the company has completed in last five years. It also covers key facts CAGR growth, deal value etc. related to merger and acquisition deals of the company.There are so many reasons you need a Buy Side Advisory Services In M And A Mergers And Acquisitions By Sector Introduction PDF. The first reason is you can not spend time making everything from scratch, Thus, Slidegeeks has made presentation templates for you too. You can easily download these templates from our website easily.
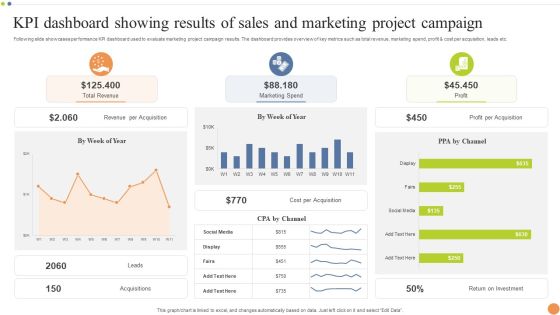
KPI Dashboard Showing Results Of Sales And Marketing Project Campaign Formats PDF
Following slide showcases performance KPI dashboard used to evaluate marketing project campaign results. The dashboard provides overview of key metrics such as total revenue, marketing spend, profit and cost per acquisition, leads etc. Showcasing this set of slides titled KPI Dashboard Showing Results Of Sales And Marketing Project Campaign Formats PDF. The topics addressed in these templates are Marketing Spend, Revenue, Profit Per Acquisition. All the content presented in this PPT design is completely editable. Download it and make adjustments in color, background, font etc. as per your unique business setting.
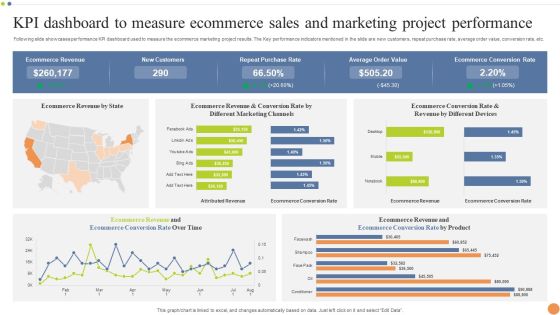
KPI Dashboard To Measure Ecommerce Sales And Marketing Project Performance Portrait PDF
Following slide showcases performance KPI dashboard used to measure the ecommerce marketing project results. The Key performance indicators mentioned in the slide are new customers, repeat purchase rate, average order value, conversion rate, etc. Pitch your topic with ease and precision using this KPI Dashboard To Measure Ecommerce Sales And Marketing Project Performance Portrait PDF. This layout presents information on Purchase Rate, Average Order Value, Ecommerce Conversion Rate. It is also available for immediate download and adjustment. So, changes can be made in the color, design, graphics or any other component to create a unique layout.
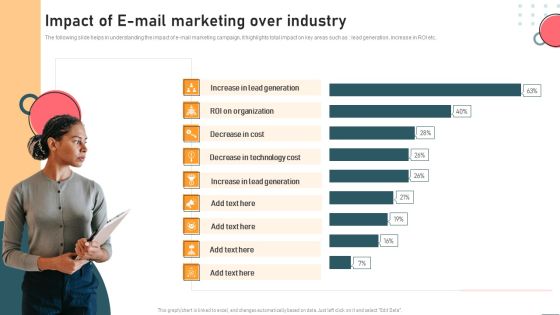
Impact Of E Mail Marketing Over Industry Information PDF
The following slide helps in understanding the impact of e mail marketing campaign, it highlights total impact on key areas such as lead generation, increase in ROI etc. From laying roadmaps to briefing everything in detail, our templates are perfect for you. You can set the stage with your presentation slides. All you have to do is download these easy to edit and customizable templates. Impact Of E Mail Marketing Over Industry Information PDF will help you deliver an outstanding performance that everyone would remember and praise you for. Do download this presentation today.

Account Based Marketing Customer Engagement Dashboard Infographics PDF
Purpose of the following slide is to show key metrics that can help the organization to track their account based marketing efforts, it highlights essential KPIs such as CTR, session by account. Boost your pitch with our creative Account Based Marketing Customer Engagement Dashboard Infographics PDF. Deliver an awe inspiring pitch that will mesmerize everyone. Using these presentation templates you will surely catch everyones attention. You can browse the ppts collection on our website. We have researchers who are experts at creating the right content for the templates. So you do not have to invest time in any additional work. Just grab the template now and use them.
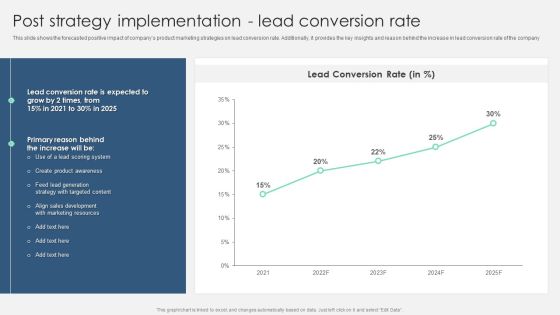
Product Marketing Management To Enforce Business Performance Post Strategy Implementation Lead Formats PDF
This slide shows the forecasted positive impact of companys product marketing strategies on average customer acquisition cost. Additionally, it provides the key insights and reason behind the decline in acquisition cost per customer. Boost your pitch with our creative Product Marketing Management To Enforce Business Performance Post Strategy Implementation Lead Formats PDF. Deliver an awe-inspiring pitch that will mesmerize everyone. Using these presentation templates you will surely catch everyones attention. You can browse the ppts collection on our website. We have researchers who are experts at creating the right content for the templates. So you do not have to invest time in any additional work. Just grab the template now and use them.

Dashboard To Track Product Sales Performance Implementing Focus Strategy To Improve Designs PDF
This slide showcases dashboard that can help organization to analyse the sales of product after entering into niche market. Its key elements are sales, sales target, sales growth, sales by channel, inventory days outstanding etc.Take your projects to the next level with our ultimate collection of Dashboard To Track Product Sales Performance Implementing Focus Strategy To Improve Designs PDF. Slidegeeks has designed a range of layouts that are perfect for representing task or activity duration, keeping track of all your deadlines at a glance. Tailor these designs to your exact needs and give them a truly corporate look with your own brand colors they all make your projects stand out from the rest.

Dashboard Of Product Sales Growth And Gross Analysis Analysis Ppt Styles Good PDF
The following slide highlights the dashboard o product sales growth and gross margin analysis illustrating key headings which includes sales by product, sales by month, sales product by margin, sales product by quantity, gross margin growth, gross margin trend and product inventory. Showcasing this set of slides titled Dashboard Of Product Sales Growth And Gross Analysis Analysis Ppt Styles Good PDF. The topics addressed in these templates are Gross Margin Growth, Gross Margin Trend, Product Inventory. All the content presented in this PPT design is completely editable. Download it and make adjustments in color, background, font etc. as per your unique business setting.
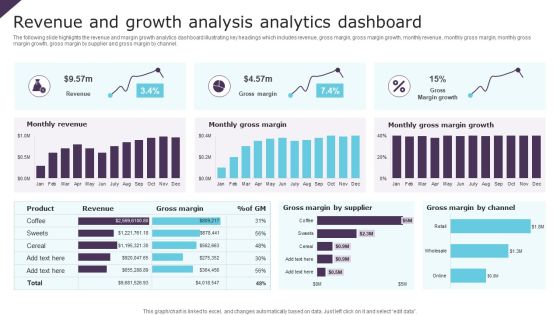
Revenue And Growth Analysis Analytics Dashboard Ppt Infographic Template Brochure PDF
The following slide highlights the revenue and margin growth analytics dashboard illustrating key headings which includes revenue, gross margin, gross margin growth, monthly revenue, monthly gross margin, monthly gross margin growth, gross margin by supplier and gross margin by channel. Pitch your topic with ease and precision using this Revenue And Growth Analysis Analytics Dashboard Ppt Infographic Template Brochure PDF. This layout presents information on Monthly Revenue, Monthly Gross Margin, Gross Margin Growth. It is also available for immediate download and adjustment. So, changes can be made in the color, design, graphics or any other component to create a unique layout.

Sales Revenue And Gross Growth Analysis Dashboard Ppt Inspiration Background Image PDF
The following slide highlights the sales revenue and gross margin growth dashboard illustrating key headings which includes gross margin, total revenue, total client, total product, gross margin trend, gross margin growth, monthly gross margin, monthly revenue, yearly revenue growth and gross margin growth trend by product. Showcasing this set of slides titled Sales Revenue And Gross Growth Analysis Dashboard Ppt Inspiration Background Image PDF. The topics addressed in these templates are Gross Margin, Total Revenue, Total Clients. All the content presented in this PPT design is completely editable. Download it and make adjustments in color, background, font etc. as per your unique business setting.
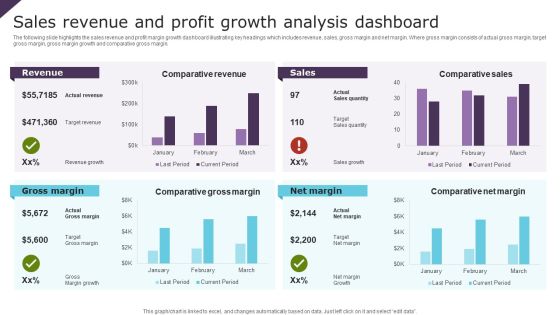
Sales Revenue And Profit Growth Analysis Dashboard Ppt Portfolio Slide PDF
The following slide highlights the sales revenue and profit margin growth dashboard illustrating key headings which includes revenue, sales, gross margin and net margin. Where gross margin consists of actual gross margin, target gross margin, gross margin growth and comparative gross margin. Showcasing this set of slides titled Sales Revenue And Profit Growth Analysis Dashboard Ppt Portfolio Slide PDF. The topics addressed in these templates are Revenue, Sales, Gross Margin, Net Margin. All the content presented in this PPT design is completely editable. Download it and make adjustments in color, background, font etc. as per your unique business setting.
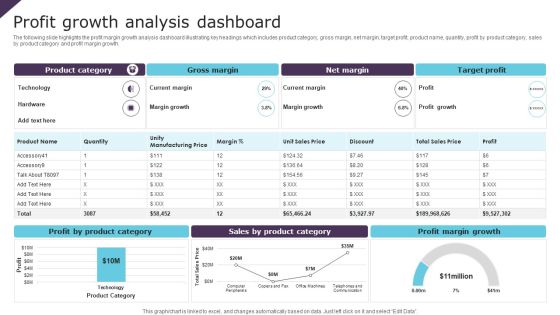
Profit Growth Analysis Dashboard Ppt PowerPoint Presentation File Design Templates PDF
The following slide highlights the profit margin growth analysis dashboard illustrating key headings which includes product category, gross margin, net margin, target profit, product name, quantity, profit by product category, sales by product category and profit margin growth. Showcasing this set of slides titled Profit Growth Analysis Dashboard Ppt PowerPoint Presentation File Design Templates PDF. The topics addressed in these templates are Gross Margin, Net Margin, Target Profit. All the content presented in this PPT design is completely editable. Download it and make adjustments in color, background, font etc. as per your unique business setting.

International Business Extension Distribution Of Merger And Acquisition Cost By Phases Themes PDF
This slide showcases merger and acquisition cost distribution in different phases. Its key elements are strategy, screening, negotiations, due diligence, transaction execution and integration. Make sure to capture your audiences attention in your business displays with our gratis customizable International Business Extension Distribution Of Merger And Acquisition Cost By Phases Themes PDF. These are great for business strategies, office conferences, capital raising or task suggestions. If you desire to acquire more customers for your tech business and ensure they stay satisfied, create your own sales presentation with these plain slides.

Brand Health Definition And Metrics To Track Brand Value Estimation Guide Mockup PDF
Following slide provides an overview about brand equity by covering its definition and key components such as brand loyalty, awareness, quality, association and experience.Present like a pro with Brand Health Definition And Metrics To Track Brand Value Estimation Guide Mockup PDF Create beautiful presentations together with your team, using our easy-to-use presentation slides. Share your ideas in real-time and make changes on the fly by downloading our templates. So whether you are in the office, on the go, or in a remote location, you can stay in sync with your team and present your ideas with confidence. With Slidegeeks presentation got a whole lot easier. Grab these presentations today.
Young And Rubicam Brand Asset Valuator Model Brand Value Estimation Guide Icons PDF
Mentioned slide illustrates information about Young Rubicam brand asset valuator model. It also covers sample model along with key benefits and brand health performance.Boost your pitch with our creative Young And Rubicam Brand Asset Valuator Model Brand Value Estimation Guide Icons PDF. Deliver an awe-inspiring pitch that will mesmerize everyone. Using these presentation templates you will surely catch everyones attention. You can browse the ppts collection on our website. We have researchers who are experts at creating the right content for the templates. So you do not have to invest time in any additional work. Just grab the template now and use them.

Business Analytics Application Workforce Performance Analysis KPI Dashboard Template PDF
This slide represents the dashboard representing key metrics to analyze the performance of overall workforce. It includes details related to absence rate, benefits satisfaction, engagement index etc. Take your projects to the next level with our ultimate collection of Business Analytics Application Workforce Performance Analysis KPI Dashboard Template PDF. Slidegeeks has designed a range of layouts that are perfect for representing task or activity duration, keeping track of all your deadlines at a glance. Tailor these designs to your exact needs and give them a truly corporate look with your own brand colors theyll make your projects stand out from the rest.

Account Based Marketing Customer Engagement Dashboard Demonstration PDF
Purpose of the following slide is to show key metrics that can help the organization to track their account based marketing efforts, it highlights essential KPIs such as CTR, session by account.Find a pre-designed and impeccable Account Based Marketing Customer Engagement Dashboard Demonstration PDF. The templates can ace your presentation without additional effort. You can download these easy-to-edit presentation templates to make your presentation stand out from others. So, what are you waiting for Download the template from Slidegeeks today and give a unique touch to your presentation.

Conversational Marketing Dashboard For B2B And B2C Organization Mockup PDF
Purpose of the following slide is to show key metrics that can help the organization to track conversational marketing efforts, it highlights essential KPIs such as subscribers, e-mail sent, sessions through link sent on e-mail. If your project calls for a presentation, then Slidegeeks is your go-to partner because we have professionally designed, easy-to-edit templates that are perfect for any presentation. After downloading, you can easily edit Conversational Marketing Dashboard For B2B And B2C Organization Mockup PDF and make the changes accordingly. You can rearrange slides or fill them with different images. Check out all the handy templates.

Improving Brand Recognition To Boost Brand Awareness Metrics Share Of Voice Structure PDF
This slide provides information regarding share of voice as brand awareness metrics. It helps in determining online discussion initiated by specific public profile. The slide also include key initiatives to boost share of voice on social media. There are so many reasons you need a Improving Brand Recognition To Boost Brand Awareness Metrics Share Of Voice Structure PDF. The first reason is you cant spend time making everything from scratch, Thus, Slidegeeks has made presentation templates for you too. You can easily download these templates from our website easily.
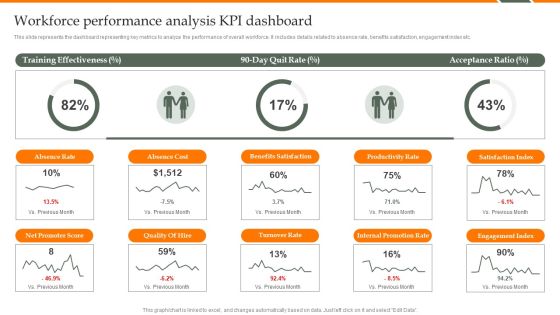
Human Resource Analytics Workforce Performance Analysis KPI Dashboard Structure PDF
This slide represents the dashboard representing key metrics to analyze the performance of overall workforce. It includes details related to absence rate, benefits satisfaction, engagement index etc. Find a pre-designed and impeccable Human Resource Analytics Workforce Performance Analysis KPI Dashboard Structure PDF. The templates can ace your presentation without additional effort. You can download these easy-to-edit presentation templates to make your presentation stand out from others. So, what are you waiting for Download the template from Slidegeeks today and give a unique touch to your presentation.
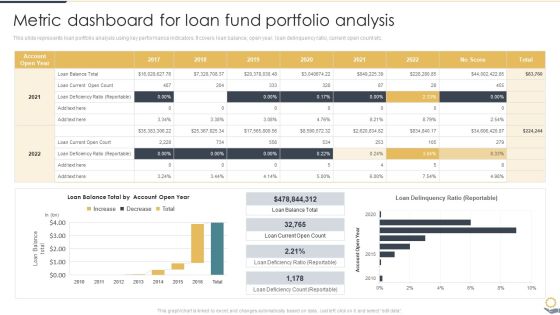
Metric Dashboard For Loan Fund Portfolio Analysis Portfolio Investment Analysis Formats PDF
This slide represents loan portfolio analysis using key performance indicators. It covers loan balance, open year, loan delinquency ratio, current open count etc.From laying roadmaps to briefing everything in detail, our templates are perfect for you. You can set the stage with your presentation slides. All you have to do is download these easy-to-edit and customizable templates. Metric Dashboard For Loan Fund Portfolio Analysis Portfolio Investment Analysis Formats PDF will help you deliver an outstanding performance that everyone would remember and praise you for. Do download this presentation today.

Assessing International Market Distribution Of Merger And Acquisition Cost By Phases Icons PDF
This slide showcases merger and acquisition cost distribution in different phases. Its key elements are strategy, screening, negotiations, due diligence, transaction execution and integration. Make sure to capture your audiences attention in your business displays with our gratis customizable Assessing International Market Distribution Of Merger And Acquisition Cost By Phases Icons PDF. These are great for business strategies, office conferences, capital raising or task suggestions. If you desire to acquire more customers for your tech business and ensure they stay satisfied, create your own sales presentation with these plain slides.

Brand Awareness Strategy Dashboard To Track Website Traffic After Brand Awareness Rules PDF
This slide showcases dashboard that can help organization to track the website traffic after running online brand awareness marketing campaigns. Its key components are new visitors, traffic by source, traffic by lead source, customers wins by lead source and bounce rate. From laying roadmaps to briefing everything in detail, our templates are perfect for you. You can set the stage with your presentation slides. All you have to do is download these easy-to-edit and customizable templates. Brand Awareness Strategy Dashboard To Track Website Traffic After Brand Awareness Rules PDF will help you deliver an outstanding performance that everyone would remember and praise you for. Do download this presentation today.

Promotion Strategies For New Service Launch Global Market Sizing For New Service Infographics PDF
This slide showcases market sizing that can help organization to estimate the profit and revenue potential before launching new service. Its key components are market size, estimated growth and target market. Take your projects to the next level with our ultimate collection of Promotion Strategies For New Service Launch Global Market Sizing For New Service Infographics PDF. Slidegeeks has designed a range of layouts that are perfect for representing task or activity duration, keeping track of all your deadlines at a glance. Tailor these designs to your exact needs and give them a truly corporate look with your own brand colors they will make your projects stand out from the rest.

Promotion Strategies For New Service Launch Service Subscription And Revenue Assessment Dashboard Mockup PDF
This slide showcases dashboard that can help organization to identify the new customers acquired and revenue generated by service subscriptions. Its key components are average weekly subscription revenue, subscription sales target, customer lifetime value and customer acquisition cost. There are so many reasons you need a Promotion Strategies For New Service Launch Service Subscription And Revenue Assessment Dashboard Mockup PDF. The first reason is you can not spend time making everything from scratch, Thus, Slidegeeks has made presentation templates for you too. You can easily download these templates from our website easily.

Security Automation To Analyze And Mitigate Cyberthreats Time To Fix Security Threat Ideas PDF
This slide highlights the time to fix the security threat and error with manual testing in bar graph format. It covers key takeaways which explains how much of error are fixed in 1 to 3 hour, 3 to 6 hour and working day etc.The best PPT templates are a great way to save time, energy, and resources. Slidegeeks have 100 precent editable powerpoint slides making them incredibly versatile. With these quality presentation templates, you can create a captivating and memorable presentation by combining visually appealing slides and effectively communicating your message. Download Security Automation To Analyze And Mitigate Cyberthreats Time To Fix Security Threat Ideas PDF from Slidegeeks and deliver a wonderful presentation.

Department Salary Management Dashboard With Financial Summary Portrait PDF
The following slide highlights the department payroll management dashboard with financial summary illustrating key headings which includes company name, department name, payroll period, net pay employees, payment mode, net cash, employee tax and employer tax. Showcasing this set of slides titled Department Salary Management Dashboard With Financial Summary Portrait PDF. The topics addressed in these templates are Sales Department, Employee Tax, Financial Summary. All the content presented in this PPT design is completely editable. Download it and make adjustments in color, background, font etc. as per your unique business setting.

Personnel Management Dashboard With Salary And Overtime Data Ideas PDF
The following slide highlights the payroll management dashboard with salary and overtime data illustrating key headings which includes employee cost, average salary, overtime per day, Average base salary and average overtime cost. Pitch your topic with ease and precision using this Personnel Management Dashboard With Salary And Overtime Data Ideas PDF. This layout presents information on Average, Customer Service, Cost. It is also available for immediate download and adjustment. So, changes can be made in the color, design, graphics or any other component to create a unique layout.

Personnel Salary Dashboard For Executive Management And Workers Rules PDF
The following slide highlights the employee payroll dashboard for executive, management and workers illustrating key headings which includes country, pay period, pay groups, payroll summary, payroll results, payroll details, payroll preparation, payroll processing and worker data. Showcasing this set of slides titled Personnel Salary Dashboard For Executive Management And Workers Rules PDF. The topics addressed in these templates are Management, Executive, Employees Fund. All the content presented in this PPT design is completely editable. Download it and make adjustments in color, background, font etc. as per your unique business setting.
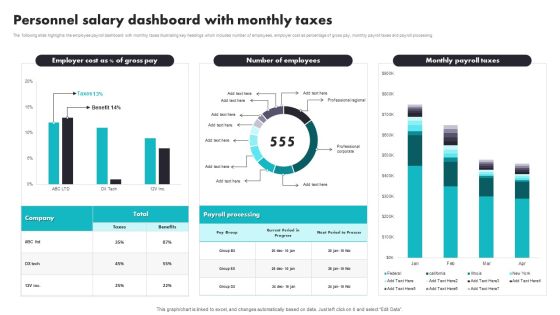
Personnel Salary Dashboard With Monthly Taxes Introduction PDF
The following slide highlights the employee payroll dashboard with monthly taxes illustrating key headings which includes number of employees, employer cost as percentage of gross pay, monthly payroll taxes and payroll processing. Pitch your topic with ease and precision using this Personnel Salary Dashboard With Monthly Taxes Introduction PDF. This layout presents information on Payroll Processing, Benefits. It is also available for immediate download and adjustment. So, changes can be made in the color, design, graphics or any other component to create a unique layout.

Personnel Salary Disbursement Dashboard With Trend Designs PDF
The following slide highlights the employee payroll disbursement dashboard with trend illustrating key headings which includes monthly payroll trend , total login hours, total working hours, payroll disbursement, method, trend, change in number, change in percentage, amount, change requested by and comment. Showcasing this set of slides titled Personnel Salary Disbursement Dashboard With Trend Designs PDF. The topics addressed in these templates are Personnel Salary Disbursement, Dashboard With Trend. All the content presented in this PPT design is completely editable. Download it and make adjustments in color, background, font etc. as per your unique business setting.

Personnel Salary Summary Dashboard With EPF And ESI Data Brochure PDF
The following highlights the slide employee payroll summary dashboard with EPF and ESI data illustrating key headings which includes payroll period, tasks to do, payroll deductions, employee summary and payroll cost. Pitch your topic with ease and precision using this Personnel Salary Summary Dashboard With EPF And ESI Data Brochure PDF. This layout presents information on Employee Provident Fund, Employee State Insurance, Tax Deducted At Source. It is also available for immediate download and adjustment. So, changes can be made in the color, design, graphics or any other component to create a unique layout.
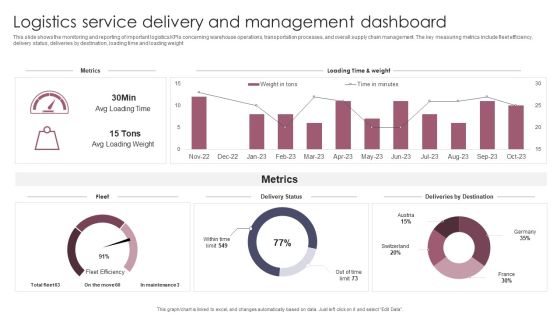
Logistics Service Delivery And Management Dashboard Introduction PDF
This slide shows the monitoring and reporting of important logistics KPIs concerning warehouse operations, transportation processes, and overall supply chain management. The key measuring metrics include fleet efficiency, delivery status, deliveries by destination, loading time and loading weight. Showcasing this set of slides titled Logistics Service Delivery And Management Dashboard Introduction PDF. The topics addressed in these templates are Logistics Service Delivery, Management Dashboard. All the content presented in this PPT design is completely editable. Download it and make adjustments in color, background, font etc. as per your unique business setting.

Effect Of Conflict Resolution On The Organization Functioning Pictures PDF
The following slide showcases graph representing the effects of conflict management on the organization. Key effects included are reduction in turnover, absenteeism, defects and increase in productivity, sales, profitability and customer satisfaction. Showcasing this set of slides titled Effect Of Conflict Resolution On The Organization Functioning Topics PDF. The topics addressed in these templates areEffect Of Conflict Resolution On The Organization Functioning Pictures PDF. All the content presented in this PPT design is completely editable. Download it and make adjustments in color, background, font etc. as per your unique business setting.
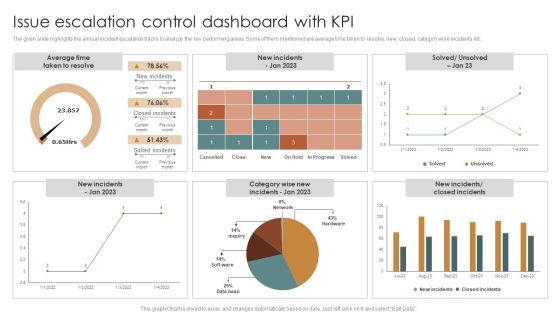
Issue Escalation Control Dashboard With KPI Clipart PDF
The given slide highlights the annual incident escalation tracks to analyze the key performing areas. Some of them mentioned are average time taken to resolve, new, closed, category wise incidents etc. Showcasing this set of slides titled Issue Escalation Control Dashboard With KPI Clipart PDF. The topics addressed in these templates are Average Time, Taken To Resolve. All the content presented in this PPT design is completely editable. Download it and make adjustments in color, background, font etc. as per your unique business setting.

Approach Optimization For Brand Promotion Strategy Post Strategy Implementation Number Of Product Sold Mockup PDF
This slide shows the forecasted positive impact of companys product marketing strategies on number of product sold. Additionally, it provides the key insights and reason behind the growth of product sold.Make sure to capture your audiences attention in your business displays with our gratis customizable Approach Optimization For Brand Promotion Strategy Post Strategy Implementation Number Of Product Sold Mockup PDF. These are great for business strategies, office conferences, capital raising or task suggestions. If you desire to acquire more customers for your tech business and ensure they stay satisfied, create your own sales presentation with these plain slides.
Social Media Marketing Strategies To Generate Lead Dashboard For Tracking Social Media Kpis Summary PDF
This slide shows dashboard for tracking social media key performance indicators KPIs. It provides details about average social engagement, reactions, comments, shares, clicks, thumbnail, platform, post message, etc. Want to ace your presentation in front of a live audience Our Social Media Marketing Strategies To Generate Lead Dashboard For Tracking Social Media Kpis Summary PDF can help you do that by engaging all the users towards you. Slidegeeks experts have put their efforts and expertise into creating these impeccable powerpoint presentations so that you can communicate your ideas clearly. Moreover, all the templates are customizable, and easy to edit and downloadable. Use these for both personal and commercial use.

Dual Branding Campaign To Boost Sales Of Product Or Services Dashboard For Dual Branding Campaign Performance Infographics PDF
This slide showcases dashboard that can help organization to measure performance after launching dual branding campaign. Its key components are sales comparison, revenue by client, revenue by source and new customers by source. The best PPT templates are a great way to save time, energy, and resources. Slidegeeks have 100 percent editable powerpoint slides making them incredibly versatile. With these quality presentation templates, you can create a captivating and memorable presentation by combining visually appealing slides and effectively communicating your message. Download Dual Branding Campaign To Boost Sales Of Product Or Services Dashboard For Dual Branding Campaign Performance Infographics PDF from Slidegeeks and deliver a wonderful presentation.

Dashboard To Measure Performance Of Social Media Marketing Strategies Pictures PDF
This following slide displays the key metrics that can help an organization to measure effectiveness of social media strategies. These can be leads generated, leads by region, web traffic targets etc.Slidegeeks is one of the best resources for PowerPoint templates. You can download easily and regulate Dashboard To Measure Performance Of Social Media Marketing Strategies Pictures PDF for your personal presentations from our wonderful collection. A few clicks is all it takes to discover and get the most relevant and appropriate templates. Use our Templates to add a unique zing and appeal to your presentation and meetings. All the slides are easy to edit and you can use them even for advertisement purposes.

Analyzing And Deploying Effective CMS Market Share Analysis Of CMS Platforms Guidelines PDF
This slide represents the analysis of key players of content management system platforms in the market to help the organization in selecting the best CMS platform. It represents market share analysis of top CMS platforms. There are so many reasons you need a Analyzing And Deploying Effective CMS Market Share Analysis Of CMS Platforms Guidelines PDF. The first reason is you can not spend time making everything from scratch, Thus, Slidegeeks has made presentation templates for you too. You can easily download these templates from our website easily.

Auto Industry Trends Electric Vehicle Adoption Global Automotive Manufacturing Market Analysis Demonstration PDF
This slide covers a graphical representation of EV year over year sales growth. It also includes key insights into global vehicle sales, and electric vehicle expected sales by 2025 and 2040. If your project calls for a presentation, then Slidegeeks is your go-to partner because we have professionally designed, easy-to-edit templates that are perfect for any presentation. After downloading, you can easily edit Auto Industry Trends Electric Vehicle Adoption Global Automotive Manufacturing Market Analysis Demonstration PDF and make the changes accordingly. You can rearrange slides or fill them with different images. Check out all the handy templates
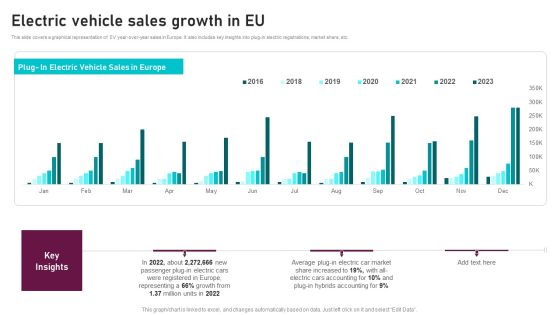
Electric Vehicle Sales Growth In Eu Global Automotive Manufacturing Market Analysis Mockup PDF
This slide covers a graphical representation of EV year over year sales in Europe. It also includes key insights into plug in electric registrations, market share, etc. The best PPT templates are a great way to save time, energy, and resources. Slidegeeks have 100parcent editable powerpoint slides making them incredibly versatile. With these quality presentation templates, you can create a captivating and memorable presentation by combining visually appealing slides and effectively communicating your message. Download Electric Vehicle Sales Growth In Eu Global Automotive Manufacturing Market Analysis Mockup PDF from Slidegeeks and deliver a wonderful presentation.
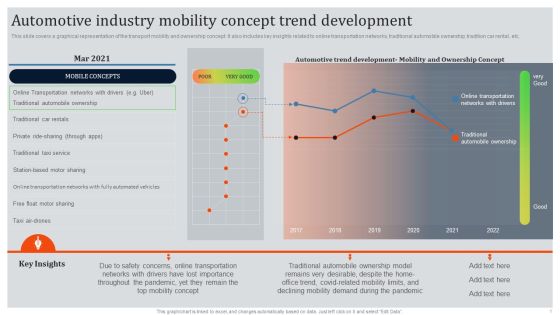
Global Automotive Industry Research And Analysis Automotive Industry Mobility Concept Trend Development Sample PDF
This slide covers a graphical representation of the transport mobility and ownership concept. It also includes key insights related to online transportation networks, traditional automobile ownership, tradition car rental, etc. Find a pre designed and impeccable Global Automotive Industry Research And Analysis Automotive Industry Mobility Concept Trend Development Sample PDF. The templates can ace your presentation without additional effort. You can download these easy to edit presentation templates to make your presentation stand out from others. So, what are you waiting for. Download the template from Slidegeeks today and give a unique touch to your presentation.
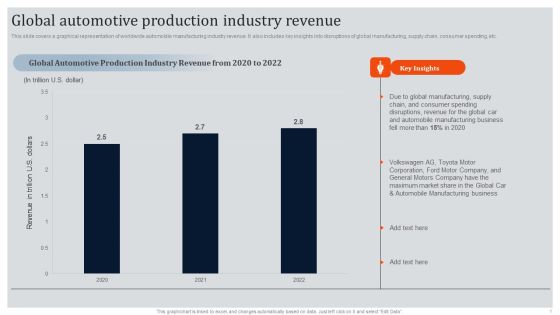
Global Automotive Industry Research And Analysis Global Automotive Production Industry Revenue Designs PDF
This slide covers a graphical representation of worldwide automobile manufacturing industry revenue. It also includes key insights into disruptions of global manufacturing, supply chain, consumer spending, etc. Make sure to capture your audiences attention in your business displays with our gratis customizable Global Automotive Industry Research And Analysis Global Automotive Production Industry Revenue Designs PDF. These are great for business strategies, office conferences, capital raising or task suggestions. If you desire to acquire more customers for your tech business and ensure they stay satisfied, create your own sales presentation with these plain slides.

Global Automotive Industry Research And Analysis Global Motor Vehicle Sales By Type Clipart PDF
This slide covers a graphical representation of worldwide automotive sales for passage cars and commercial vehicles. It also includes key insights such as the worlds largest automobile market, chinas new car registrations, the US, and Europe sales. The best PPT templates are a great way to save time, energy, and resources. Slidegeeks have 100 percent editable powerpoint slides making them incredibly versatile. With these quality presentation templates, you can create a captivating and memorable presentation by combining visually appealing slides and effectively communicating your message. Download Global Automotive Industry Research And Analysis Global Motor Vehicle Sales By Type Clipart PDFfrom Slidegeeks and deliver a wonderful presentation.
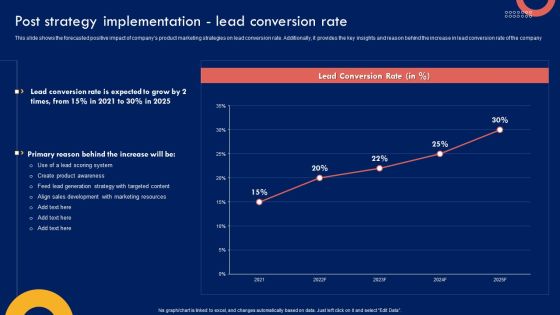
Product Marketing Leadership Post Strategy Implementation Lead Conversion Rate Elements PDF
This slide shows the forecasted positive impact of companys product marketing strategies on lead conversion rate. Additionally, it provides the key insights and reason behind the increase in lead conversion rate of the company. Make sure to capture your audiences attention in your business displays with our gratis customizable Product Marketing Leadership Post Strategy Implementation Lead Conversion Rate Elements PDF. These are great for business strategies, office conferences, capital raising or task suggestions. If you desire to acquire more customers for your tech business and ensure they stay satisfied, create your own sales presentation with these plain slides.
 Home
Home