Key Programs

Strategic Performance Analysis Tools Survey Microsoft PDF
This slide showcase survey result of 300 professional organization using strategic performance measurement tools. It includes elements such as key performance indicators, performance appraisal method, six sigma method, 360 degree feedback etc. Pitch your topic with ease and precision using this Strategic Performance Analysis Tools Survey Microsoft PDF. This layout presents information on Strategic Performance, Analysis Tools Survey. It is also available for immediate download and adjustment. So, changes can be made in the color, design, graphics or any other component to create a unique layout.
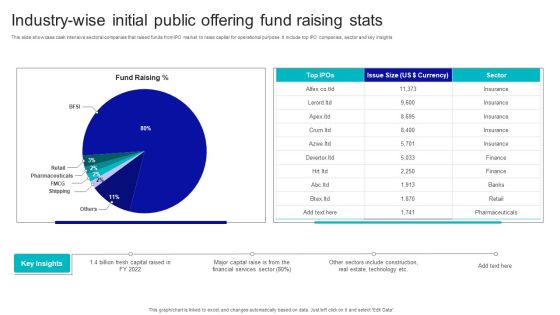
Industry Wise Initial Public Offering Fund Raising Stats Demonstration PDF
This slide showcase cash intensive sectoral companies that raised funds from IPO market to raise capital for operational purpose. It include top IPO companies, sector and key insights. Pitch your topic with ease and precision using this Industry Wise Initial Public Offering Fund Raising Stats Demonstration PDF. This layout presents information on Industry Wise Initial, Public Offering, Fund Raising Stats. It is also available for immediate download and adjustment. So, changes can be made in the color, design, graphics or any other component to create a unique layout.
Impact Survey Report Of Employee Attrition Tracking On Team Operations Demonstration PDF
This slide covers key factors having high impact on day to day team operations. It includes areas such as delay in project delivery, loss of productivity, rehiring cost and on boarding a replacement, low team morale, stress issues, legal and HR related issues. Pitch your topic with ease and precision using this Impact Survey Report Of Employee Attrition Tracking On Team Operations Demonstration PDF. This layout presents information on Employees Turnover, Project, Cost. It is also available for immediate download and adjustment. So, changes can be made in the color, design, graphics or any other component to create a unique layout.
Sales Attrition Tracking Report With Revenue And Customer Churn Analytics Formats PDF
This slide covers dashboard depicting total annual sales in company. It includes key components such as revenue, profit margins, cost incurred, cost breakdown, up sell and churn trends. Showcasing this set of slides titled Sales Attrition Tracking Report With Revenue And Customer Churn Analytics Formats PDF. The topics addressed in these templates are Revenue, Number Of Sales, Profit, Cost. All the content presented in this PPT design is completely editable. Download it and make adjustments in color, background, font etc. as per your unique business setting.
Issues Tracking Dashboard For Organizational Building Management Ppt Infographics Topics PDF
This slide showcases dashboard which can help organization to keep track of issues plus faults during facility management and rectify them within stipulated time. Its key elements are issues reported, fault tracking, etc. Pitch your topic with ease and precision using this Issues Tracking Dashboard For Organizational Building Management Ppt Infographics Topics PDF. This layout presents information on Fault Tracking, Issues Reported, Location. It is also available for immediate download and adjustment. So, changes can be made in the color, design, graphics or any other component to create a unique layout.

Building Management Dashboard Highlighting Power Consumption And Occupancy Rate Template PDF
This slide showcases dashboard that can help organization to keep track of power consumed by machinery and occupancy rate during facility management. Its key components are HVAC, occupancy rate, service requests and temperature. Pitch your topic with ease and precision using this Building Management Dashboard Highlighting Power Consumption And Occupancy Rate Template PDF. This layout presents information on Lighting, Power, Water, Electricity, Temperature. It is also available for immediate download and adjustment. So, changes can be made in the color, design, graphics or any other component to create a unique layout.

KPI Dashboard To Monitor E Commerce Revenue Analysis Performance Mockup PDF
This slide shows the key performance indicators dashboard which can be used to analyze current financial position of e-commerce business. It includes metrics such as revenue, expenses, profit, cash in hand, etc. Showcasing this set of slides titled KPI Dashboard To Monitor E Commerce Revenue Analysis Performance Mockup PDF. The topics addressed in these templates are Accounts Receivable, Accounts Payable, Revenue, Expenses. All the content presented in this PPT design is completely editable. Download it and make adjustments in color, background, font etc. as per your unique business setting.

Market Analysis Of Smart Farming Tech With Growth Drivers Template PDF
The following slide highlights smart farming tech market analysis with growth drivers to measure progress and track performance. It include growth drivers such as increase demand of weather monitoring system, increase in human resource investment and key insights such as estimated market value, forecasted revenue etc.Pitch your topic with ease and precision using this Market Analysis Of Smart Farming Tech With Growth Drivers Template PDF. This layout presents information on Estimated Growth, Estimated Market Value, Forecasted Revenue. It is also available for immediate download and adjustment. So, changes can be made in the color, design, graphics or any other component to create a unique layout.

Cash Management Dashboard With Sales Outstanding And Liquidity Ratio Analysis Information PDF
This showcases dashboard that can help organization in cash management and track KPIs to evaluate the financial performance of company. It key components are liquidity ratios, cash balance. days sales outstanding, days inventory outstanding and days payable outstanding. Pitch your topic with ease and precision using this Cash Management Dashboard With Sales Outstanding And Liquidity Ratio Analysis Information PDF. This layout presents information on Cash Conversion, Working Capital, Cash Balance. It is also available for immediate download and adjustment. So, changes can be made in the color, design, graphics or any other component to create a unique layout.
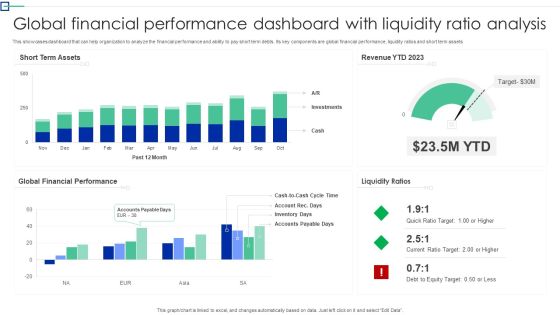
Global Financial Performance Dashboard With Liquidity Ratio Analysis Information PDF
This showcases dashboard that can help organization to analyze the financial performance and ability to pay short term debts. Its key components are global financial performance, liquidity ratios and short term assets. Pitch your topic with ease and precision using this Global Financial Performance Dashboard With Liquidity Ratio Analysis Information PDF. This layout presents information on Short Term Assets, Global Financial Performance, Liquidity Ratios. It is also available for immediate download and adjustment. So, changes can be made in the color, design, graphics or any other component to create a unique layout.
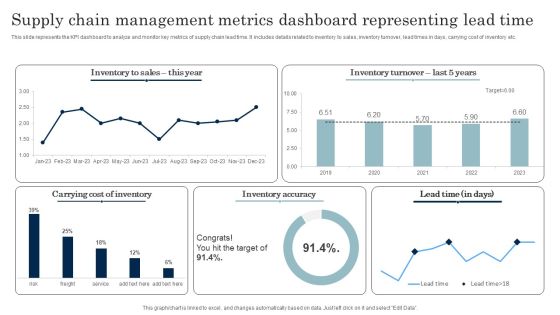
Supply Chain Management Metrics Dashboard Representing Lead Time Download PDF
This slide represents the KPI dashboard to analyze and monitor key metrics of supply chain lead time. It includes details related to inventory to sales, inventory turnover, lead times in days, carrying cost of inventory etc. Pitch your topic with ease and precision using this Supply Chain Management Metrics Dashboard Representing Lead Time Download PDF. This layout presents information on Inventory Accuracy, Carrying Cost Of Inventory. It is also available for immediate download and adjustment. So, changes can be made in the color, design, graphics or any other component to create a unique layout.

KPI Metrics Dashboard To Analyze Business Project Investment Graphics PDF
This slide signifies the key performance indicator dashboard to evaluate project investment project. It covers information about portfolio activity summary, allocation and dividends vs unrealized gains. Showcasing this set of slides titled KPI Metrics Dashboard To Analyze Business Project Investment Graphics PDF. The topics addressed in these templates are Allocation Sector Sheets, Sector Summary, Investment Styles Shares. All the content presented in this PPT design is completely editable. Download it and make adjustments in color, background, font etc. as per your unique business setting.

Top Skills Assessed During Leadership Recruitment Infographics PDF
The slide showcases various skill that organizations assess during leadership recruiting. It includes cognitive skills, personality skills, domain skills, key insights, applications received, applications accepted , total hired leaders and cost of hiring. Showcasing this set of slides titled Top Skills Assessed During Leadership Recruitment Infographics PDF. The topics addressed in these templates are Cognitive Skills, Personality Skills, Domain Skills. All the content presented in this PPT design is completely editable. Download it and make adjustments in color, background, font etc. as per your unique business setting.
Need For Improving Current Customer Touchpoints Consumer Contact Point Guide Icons PDF
This slide covers the requirements of consumer touchpoint optimization. It also includes key insights such as identifying and analyzing resource waste reduction for higher marketing ROI, etc. Slidegeeks is one of the best resources for PowerPoint templates. You can download easily and regulate Need For Improving Current Customer Touchpoints Consumer Contact Point Guide Icons PDF for your personal presentations from our wonderful collection. A few clicks is all it takes to discover and get the most relevant and appropriate templates. Use our Templates to add a unique zing and appeal to your presentation and meetings. All the slides are easy to edit and you can use them even for advertisement purposes.

Guide To Develop And Estimate Brand Value Structure PDF
Mentioned slide illustrates information about young rubicam brand asset valuator model. It also covers sample model along with key benefits and brand health performance.Crafting an eye-catching presentation has never been more straightforward. Let your presentation shine with this tasteful yet straightforward Guide To Develop And Estimate Brand Value Structure PDF template. It offers a minimalistic and classy look that is great for making a statement. The colors have been employed intelligently to add a bit of playfulness while still remaining professional. Construct the ideal Guide To Develop And Estimate Brand Value Structure PDF that effortlessly grabs the attention of your audience Begin now and be certain to wow your customers.

Decline In New Lead Generation Customer Acquisition Through Advertising Designs PDF
The slides shows the five years graph of companys new lead generation. Further, it shows the key insights, and primary reason behind the decline. Slidegeeks is one of the best resources for PowerPoint templates. You can download easily and regulate Decline In New Lead Generation Customer Acquisition Through Advertising Designs PDF for your personal presentations from our wonderful collection. A few clicks is all it takes to discover and get the most relevant and appropriate templates. Use our Templates to add a unique zing and appeal to your presentation and meetings. All the slides are easy to edit and you can use them even for advertisement purposes.

Estimated Global Motor Vehicle Production By Type Global Automotive Manufacturing Market Analysis Information PDF
This slide covers a graphical representation of worldwide automobile manufacturing forecasts. It also includes key insights about as passenger cars, Chinese motorists, etc. The Estimated Global Motor Vehicle Production By Type Global Automotive Manufacturing Market Analysis Information PDF is a compilation of the most recent design trends as a series of slides. It is suitable for any subject or industry presentation, containing attractive visuals and photo spots for businesses to clearly express their messages. This template contains a variety of slides for the user to input data, such as structures to contrast two elements, bullet points, and slides for written information. Slidegeeks is prepared to create an impression.
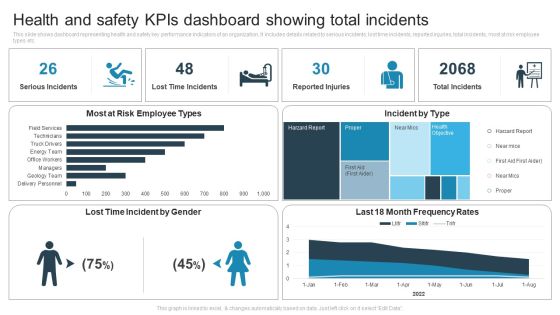
Health And Safety Kpis Dashboard Showing Total Incidents Pictures PDF
This slide shows dashboard representing health and safety key performance indicators of an organization. It includes details related to serious incidents, lost time incidents, reported injuries, total incidents, most at risk employee types etc. Showcasing this set of slides titled Health And Safety Kpis Dashboard Showing Total Incidents Pictures PDF. The topics addressed in these templates are Lost Time Incident, Most At Risk Employee, Incident By Type. All the content presented in this PPT design is completely editable. Download it and make adjustments in color, background, font etc. as per your unique business setting.

About Us Page Executive Summary Of Skincare Products Company Elements PDF
This slide represents the executive summary of a renowned skincare company. It includes information related to their key milestones, market overview, product portfolio, vision and mission, capabilities, current strategy, their revenue, clients and net profit.Pitch your topic with ease and precision using this About Us Page Executive Summary Of Skincare Products Company Elements PDF. This layout presents information on Choice Clients, Exceptional Quality, Products Ingredients. It is also available for immediate download and adjustment. So, changes can be made in the color, design, graphics or any other component to create a unique layout.
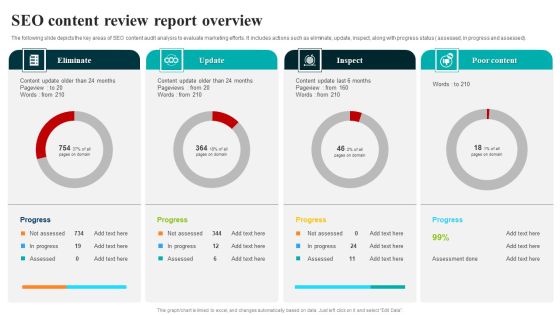
SEO Content Review Report Overview Formats PDF
The following slide depicts the key areas of SEO content audit analysis to evaluate marketing efforts. It includes actions such as eliminate, update, inspect, along with progress status assessed, in progress and assessed. Showcasing this set of slides titled SEO Content Review Report Overview Formats PDF. The topics addressed in these templates are Content Review, Report Overview. All the content presented in this PPT design is completely editable. Download it and make adjustments in color, background, font etc. as per your unique business setting.
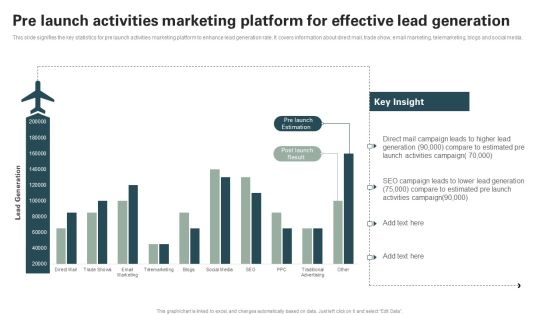
Pre Launch Activities Marketing Platform For Effective Lead Generation Structure PDF
This slide signifies the key statistics for pre launch activities marketing platform to enhance lead generation rate. It covers information about direct mail, trade show, email marketing, telemarketing, blogs and social media. Showcasing this set of slides titled Pre Launch Activities Marketing Platform For Effective Lead Generation Structure PDF. The topics addressed in these templates are Direct Mail Campaign Leads, Compare To Estimated. All the content presented in this PPT design is completely editable. Download it and make adjustments in color, background, font etc. as per your unique business setting.

Cloud Based Computing Analysis Cloud Performance Tracking Dashboard Structure PDF
This slide covers the key performance indicators for tracking performance of the cloud such as violations break down, sources, rules and severity. Get a simple yet stunning designed Cloud Based Computing Analysis Cloud Performance Tracking Dashboard Structure PDF. It is the best one to establish the tone in your meetings. It is an excellent way to make your presentations highly effective. So, download this PPT today from Slidegeeks and see the positive impacts. Our easy-to-edit Cloud Based Computing Analysis Cloud Performance Tracking Dashboard Structure PDF can be your go-to option for all upcoming conferences and meetings. So, what are you waiting for Grab this template today.
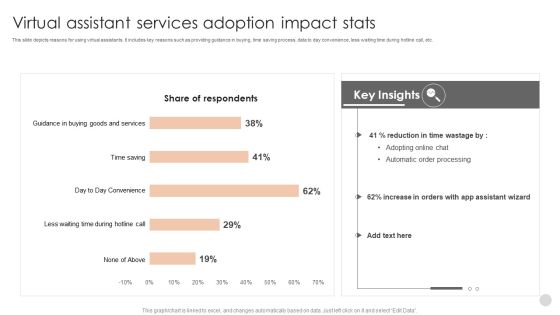
Virtual Assistant Services Adoption Impact Stats Structure PDF
This slide depicts reasons for using virtual assistants. It includes key reasons such as providing guidance in buying, time saving process, data to day convenience, less waiting time during hotline call, etc.Pitch your topic with ease and precision using this Virtual Assistant Services Adoption Impact Stats Structure PDF. This layout presents information on Automatic Order Processing, Assistant Wizard, Guidance Buying. It is also available for immediate download and adjustment. So, changes can be made in the color, design, graphics or any other component to create a unique layout.

Kpi Dashboard To Measure Personal Banking Customer Relationship Themes PDF
This slide signifies the key performance indicator dashboard to monitor bank relationship with customers. It covers customer satisfaction rate by region, district and includes 12 month trends. Pitch your topic with ease and precision using this Kpi Dashboard To Measure Personal Banking Customer Relationship Themes PDF. This layout presents information on Customer Satisfaction, Best Demonstrated, Worst Demonstrated. It is also available for immediate download and adjustment. So, changes can be made in the color, design, graphics or any other component to create a unique layout.
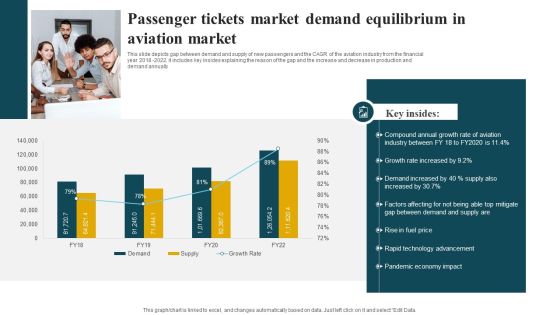
Passenger Tickets Market Demand Equilibrium In Aviation Market Guidelines PDF
This slide depicts gap between demand and supply of new passengers and the CAGR of the aviation industry from the financial year 2018 2022. it includes key insides explaining the reason of the gap and the increase and decrease in production and demand annually. Showcasing this set of slides titled Passenger Tickets Market Demand Equilibrium In Aviation Market Guidelines PDF. The topics addressed in these templates are Growth Rate, Industry, Demand. All the content presented in this PPT design is completely editable. Download it and make adjustments in color, background, font etc. as per your unique business setting.
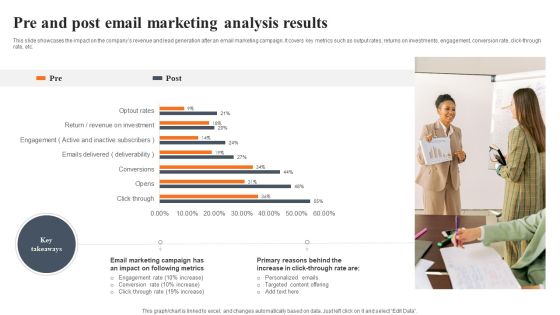
Pre And Post Email Marketing Analysis Results Slides PDF
This slide showcases the impact on the companys revenue and lead generation after an email marketing campaign. It covers key metrics such as output rates, returns on investments, engagement, conversion rate, click through rate, etc. Pitch your topic with ease and precision using this Pre And Post Email Marketing Analysis Results Slides PDF. This layout presents information on Email Marketing Campaign, Following Metrics, Targeted Content Offering. It is also available for immediate download and adjustment. So, changes can be made in the color, design, graphics or any other component to create a unique layout.

Accelerate Productivity In Orientation Process For New Sales Hires Structure PDF
This slide illustrates graphical representation of statistics related to practices involved in sales onboarding of new recruits. It includes business overview and job description etc. with key takeaways. Pitch your topic with ease and precision using this Accelerate Productivity In Orientation Process For New Sales Hires Structure PDF. This layout presents information on Accelerate Productivity In Orientation, Process For New, Sales Hires. It is also available for immediate download and adjustment. So, changes can be made in the color, design, graphics or any other component to create a unique layout.

Big Latest Facts About Data Analytics In Manufacturing Industry Infographics PDF
This slide covers big data analytics and trends in manufacturing industry. It involves details such as expected market size, key drivers and impact on market. Pitch your topic with ease and precision using this Big Latest Facts About Data Analytics In Manufacturing Industry Infographics PDF. This layout presents information on Big Latest Facts, About Data Analytics, Manufacturing Industry. It is also available for immediate download and adjustment. So, changes can be made in the color, design, graphics or any other component to create a unique layout.

HR Organizational Expense Budget Priorities Template PDF
The following slide depicts the HR budget priorities to take key decisions whether to expand, maintain or contract expense allocation in human resource activities. It constitutes of activities such as recruitment, selection, training and development, payroll, employee health and safety etc. Pitch your topic with ease and precision using this HR Organizational Expense Budget Priorities Template PDF. This layout presents information on Budget, Development Activities, Fund Allocation. It is also available for immediate download and adjustment. So, changes can be made in the color, design, graphics or any other component to create a unique layout.

Organizational Expense Management With Kpi Dashboard Slides PDF
The following slide highlights the key metrics to assess the organizational expenses and meet financial goals. It includes KPIs such as quarterly and annual business expense details, expenditure breakdown etc. Showcasing this set of slides titled Organizational Expense Management With Kpi Dashboard Slides PDF. The topics addressed in these templates are Annual Expenses, Expense Details, Expense Breakdown. All the content presented in this PPT design is completely editable. Download it and make adjustments in color, background, font etc. as per your unique business setting.

Quarterly Business Information Dashboard With Product Segments Slides PDF
This slide displays dashboard for performance analysis of key business operations to compare companys growth in different quarters. It further includes information such as sales, revenue, gross profit, income and expenditure, etc. Showcasing this set of slides titled Quarterly Business Information Dashboard With Product Segments Slides PDF. The topics addressed in these templates are Quarterly Business Information, Dashboard With Product Segments. All the content presented in this PPT design is completely editable. Download it and make adjustments in color, background, font etc. as per your unique business setting.
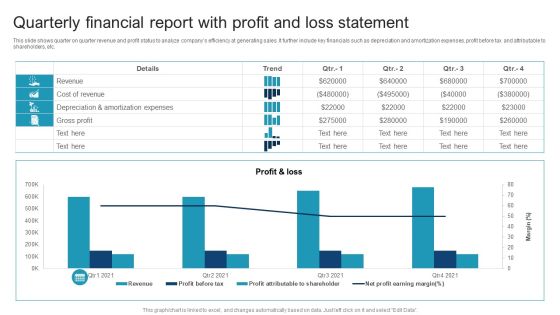
Quarterly Financial Report With Profit And Loss Statement Themes PDF
This slide shows quarter on quarter revenue and profit status to analyze companys efficiency at generating sales. It further include key financials such as depreciation and amortization expenses, profit before tax and attributable to shareholders, etc. Pitch your topic with ease and precision using this Quarterly Financial Report With Profit And Loss Statement Themes PDF. This layout presents information on Quarterly Financial Report, Profit And Loss Statement. It is also available for immediate download and adjustment. So, changes can be made in the color, design, graphics or any other component to create a unique layout.

KPI Dashboard To Evaluate Growth In Sales Funnel Reporting Topics PDF
This slide represents the KPI dashboard to measure sales pipeline reporting for increasing customer conversion rate. It includes activity by representative, forecast by month and monthly growth. Pitch your topic with ease and precision using this KPI Dashboard To Evaluate Growth In Sales Funnel Reporting Topics PDF. This layout presents information on Pipeline Requirement, Key Activities, Pipeline Closed Date. It is also available for immediate download and adjustment. So, changes can be made in the color, design, graphics or any other component to create a unique layout.
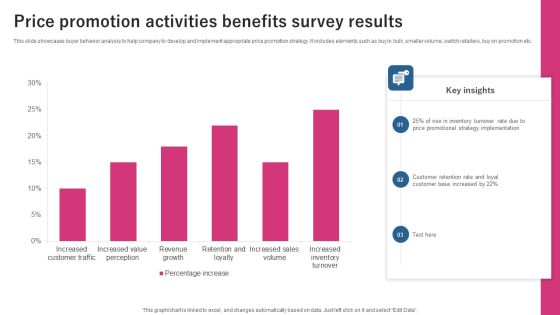
Price Promotion Activities Benefits Survey Results Ppt Inspiration Templates PDF
This slide showcases buyer behavior analysis to help company to develop and implement appropriate price promotion strategy. It includes elements such as buy in bulk, smaller volume, switch retailers, buy on promotion etc. Pitch your topic with ease and precision using this Price Promotion Activities Benefits Survey Results Ppt Inspiration Templates PDF. This layout presents information on Key Price, Promotional Strategy, Implementation. It is also available for immediate download and adjustment. So, changes can be made in the color, design, graphics or any other component to create a unique layout.
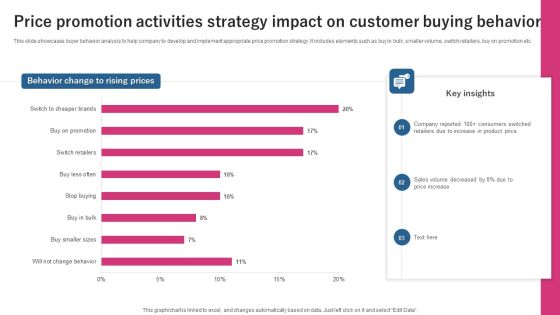
Price Promotion Activities Strategy Impact On Customer Buying Behavior Infographics PDF
This slide showcases buyer behavior analysis to help company to develop and implement appropriate price promotion strategy. It includes elements such as buy in bulk, smaller volume, switch retailers, buy on promotion etc. Showcasing this set of slides titled Price Promotion Activities Strategy Impact On Customer Buying Behavior Infographics PDF. The topics addressed in these templates are Behavior Change, Rising Prices, Key Insights. All the content presented in this PPT design is completely editable. Download it and make adjustments in color, background, font etc. as per your unique business setting.

Customer Healthcare Service Management Dashboard Themes PDF
The slide shows a dashboard for health care consultant to effectively manage of booked appointments. It includes key elements such as review score, patients, appointment sin current month, recently attended appointments, monthly revenue, previous months attended meetings, etc. Showcasing this set of slides titled Customer Healthcare Service Management Dashboard Themes PDF. The topics addressed in these templates are Customer Healthcare Service, Management Dashboard. All the content presented in this PPT design is completely editable. Download it and make adjustments in color, background, font etc. as per your unique business setting.
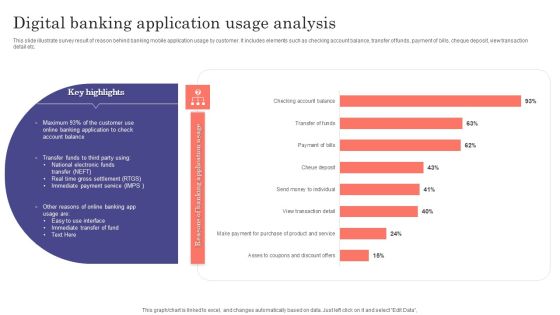
Digital Banking Application Usage Analysis Ppt Portfolio Layouts PDF
This slide illustrate survey result of reason behind banking mobile application usage by customer. It includes elements such as checking account balance, transfer of funds, payment of bills, cheque deposit, view transaction detail etc. Showcasing this set of slides titled Digital Banking Application Usage Analysis Ppt Portfolio Layouts PDF. The topics addressed in these templates are Key Highlights, Application To Check, Account Balance. All the content presented in this PPT design is completely editable. Download it and make adjustments in color, background, font etc. as per your unique business setting.
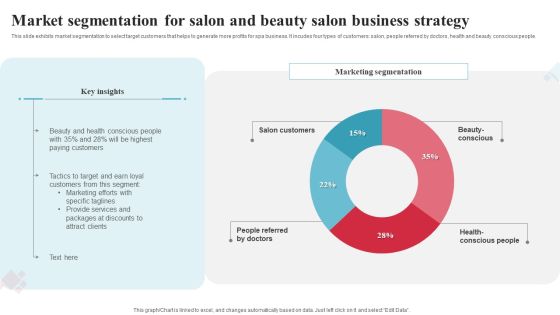
Market Segmentation For Salon And Beauty Salon Business Strategy Ppt Layouts Clipart Images PDF
This slide exhibits market segmentation to select target customers that helps to generate more profits for spa business. It incudes four types of customers salon, people referred by doctors, health and beauty conscious people. Showcasing this set of slides titled Market Segmentation For Salon And Beauty Salon Business Strategy Ppt Layouts Clipart Images PDF. The topics addressed in these templates are Key Insights, Marketing Segmentation, Target And Earn. All the content presented in this PPT design is completely editable. Download it and make adjustments in color, background, font etc. as per your unique business setting.
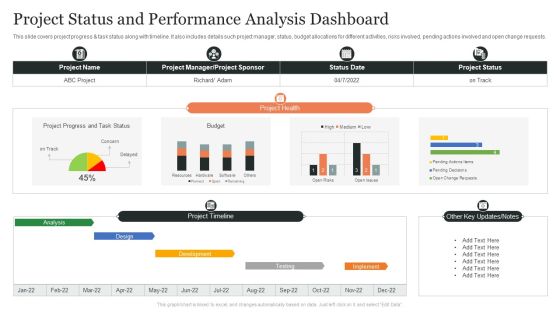
Project Status And Performance Analysis Dashboard Ppt Slides Brochure PDF
This slide covers project progress and task status along with timeline. It also includes details such project manager, status, budget allocations for different activities, risks involved, pending actions involved and open change requests. Showcasing this set of slides titled Project Status And Performance Analysis Dashboard Ppt Slides Brochure PDF. The topics addressed in these templates are Project Health, Design, Project Timeline, Other Key Updates, Notes. All the content presented in this PPT design is completely editable. Download it and make adjustments in color, background, font etc. as per your unique business setting.

Social Media Marketing Performance Analysis Ppt Inspiration Smartart PDF
This slide covers performance analysis of product marketing through a dashboard. It includes elements such as count of social media followers, user engagement analytics, favourite tweets and retweets, Instagram overview, LinkedIn key metrics, etc. Showcasing this set of slides titled Social Media Marketing Performance Analysis Ppt Inspiration Smartart PDF. The topics addressed in these templates are Social Media Followers, Favourite Tweets, Favourite Retweets, Instagram Overview. All the content presented in this PPT design is completely editable. Download it and make adjustments in color, background, font etc. as per your unique business setting.
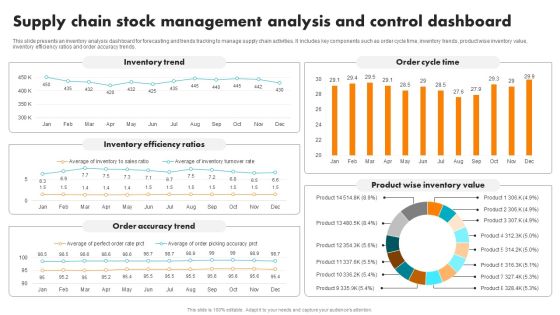
Supply Chain Stock Management Analysis And Control Dashboard Brochure PDF
This slide presents an inventory analysis dashboard for forecasting and trends tracking to manage supply chain activities. It includes key components such as order cycle time, inventory trends, product wise inventory value, inventory efficiency ratios and order accuracy trends. Pitch your topic with ease and precision using this Supply Chain Stock Management Analysis And Control Dashboard Brochure PDF. This layout presents information on Inventory Trend, Inventory Efficiency Ratios, Order Accuracy Trend, Order Cycle Time, Product Wise Inventory Value. It is also available for immediate download and adjustment. So, changes can be made in the color, design, graphics or any other component to create a unique layout.

Budget Benchmark Report For Oncology Clinical Studies At Global Level Icons PDF
The slide showcases budget benchmarking to gauge and improve financial results by selecting few operating ratios by which company wants to measure its results and manage assets. Showcasing this set of slides titled Budget Benchmark Report For Oncology Clinical Studies At Global Level Icons PDF. The topics addressed in these templates are Benchmark Source, Key Insights, Actual Budget. All the content presented in this PPT design is completely editable. Download it and make adjustments in color, background, font etc. as per your unique business setting.
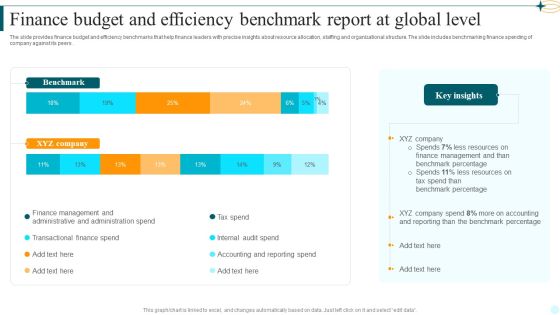
Finance Budget And Efficiency Benchmark Report At Global Level Template PDF
The slide provides finance budget and efficiency benchmarks that help finance leaders with precise insights about resource allocation, staffing and organizational structure. The slide includes benchmarking finance spending of company against its peers. Showcasing this set of slides titled Finance Budget And Efficiency Benchmark Report At Global Level Template PDF. The topics addressed in these templates are Benchmark, Key Insights, Benchmark Percentage. All the content presented in this PPT design is completely editable. Download it and make adjustments in color, background, font etc. as per your unique business setting.
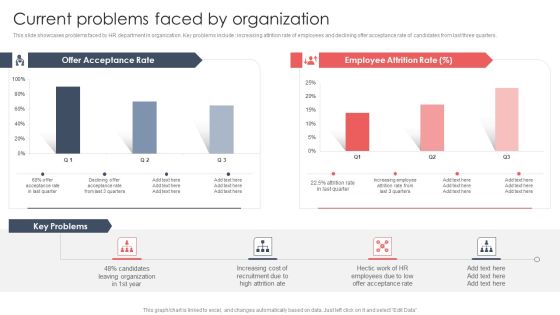
Screening And Staffing Current Problems Faced By Organization Guidelines PDF
This slide showcases problems faced by HR department in organization. Key problems include increasing attrition rate of employees and declining offer acceptance rate of candidates from last three quarters. Get a simple yet stunning designed Screening And Staffing Current Problems Faced By Organization Guidelines PDF. It is the best one to establish the tone in your meetings. It is an excellent way to make your presentations highly effective. So, download this PPT today from Slidegeeks and see the positive impacts. Our easy-to-editScreening And Staffing Current Problems Faced By Organization Guidelines PDF can be your go-to option for all upcoming conferences and meetings. So, what are you waiting for Grab this template today.

Business Projects Dashboard Template With Risk Status Report Template Topics PDF
The slide showcases a multi-project status report of a construction company. It highlights the project financials, resource allocation, portfolio risk meter and other key project parameters. Pitch your topic with ease and precision using this Business Projects Dashboard Template With Risk Status Report Template Topics PDF. This layout presents information on Portfolio Risk Meter, Project Financials, Project Parameters, Resource Allocation. It is also available for immediate download and adjustment. So, changes can be made in the color, design, graphics or any other component to create a unique layout.

Projects Portfolio Roadmap With Health And Budget Cost Status Dashboard Pictures PDF
This slide covers timeline for multi projects with key assigned person. It also includes dashboard stating number of projects, health status and total budget allocated. Showcasing this set of slides titled Projects Portfolio Roadmap With Health And Budget Cost Status Dashboard Pictures PDF. The topics addressed in these templates are Projects Portfolio Roadmap, Health And Budget, Cost Status Dashboard. All the content presented in this PPT design is completely editable. Download it and make adjustments in color, background, font etc. as per your unique business setting.
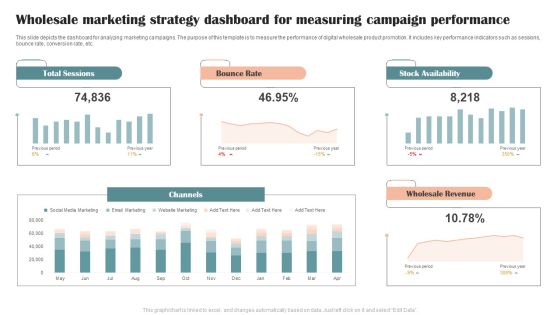
Wholesale Marketing Strategy Dashboard For Measuring Campaign Performance Graphics PDF
This slide depicts the dashboard for analyzing marketing campaigns. The purpose of this template is to measure the performance of digital wholesale product promotion. It includes key performance indicators such as sessions, bounce rate, conversion rate, etc. Showcasing this set of slides titled Wholesale Marketing Strategy Dashboard For Measuring Campaign Performance Graphics PDF. The topics addressed in these templates are Total Sessions, Bounce Rate, Stock Availability. All the content presented in this PPT design is completely editable. Download it and make adjustments in color, background, font etc. as per your unique business setting.
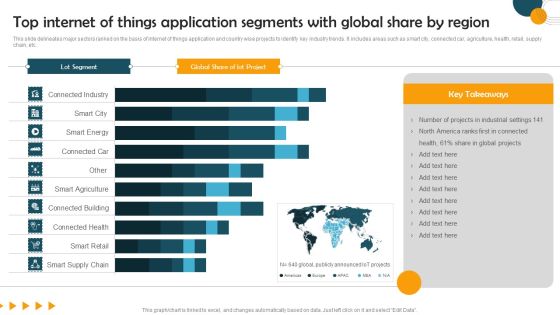
Top Internet Of Things Application Segments With Global Share By Region Formats PDF
This slide delineates major sectors ranked on the basis of internet of things application and country wise projects to identify key industry trends. It includes areas such as smart city, connected car, agriculture, health, retail, supply chain, etc. Pitch your topic with ease and precision using this Top Internet Of Things Application Segments With Global Share By Region Formats PDF. This layout presents information on Lot Segment, Global Share, lot Project. It is also available for immediate download and adjustment. So, changes can be made in the color, design, graphics or any other component to create a unique layout.

Chief Executive Dashboards With Financial Topics PDF
This slide represents the dashboard for the CEO to track the global financial performance of the organization. It includes key performance indicators such as revenue, quick ratio, short term assets etc. Showcasing this set of slides titled Chief Executive Dashboards With Financial Topics PDF. The topics addressed in these templates are Short Term Assets, Global Financial Performance, Debt Equity. All the content presented in this PPT design is completely editable. Download it and make adjustments in color, background, font etc. as per your unique business setting.
Executive Dashboards For Tracking Financial Health Of Enterprise Diagrams PDF
This slide represents the CEO dashboard to track the financial health of an organization. It includes key performance indicators such as revenue, expenses, activity ratio, gross profit margin, EBIT etc. Pitch your topic with ease and precision using this Executive Dashboards For Tracking Financial Health Of Enterprise Diagrams PDF. This layout presents information on Revenue, Expense, Activity Ratio. It is also available for immediate download and adjustment. So, changes can be made in the color, design, graphics or any other component to create a unique layout.

Executive Dashboards To Track Sales Performance Guidelines PDF
This slide represents the CEO dashboard for tracking the sales performance of the organization. It includes key performance indicators such as gross, operating and net profit, sales amount by category, income statement etc. Pitch your topic with ease and precision using this Executive Dashboards To Track Sales Performance Guidelines PDF. This layout presents information on Income Statement, Monthly Sales Growth, Days Receivable Outstanding. It is also available for immediate download and adjustment. So, changes can be made in the color, design, graphics or any other component to create a unique layout.

Integrating Digital Marketing Campaign Strategy Dashboard With Lead Breakdown Slides PDF
This slide depicts an integrating digital marketing campaign dashboard used to track lead generation and user traffic generated. It includes lead breakdown per day, google analytics traffic channels and key conversion metrics. Showcasing this set of slides titled Integrating Digital Marketing Campaign Strategy Dashboard With Lead Breakdown Slides PDF. The topics addressed in these templates are Lead Current Month, Website Users, Top Social Media Channels. All the content presented in this PPT design is completely editable. Download it and make adjustments in color, background, font etc. as per your unique business setting.
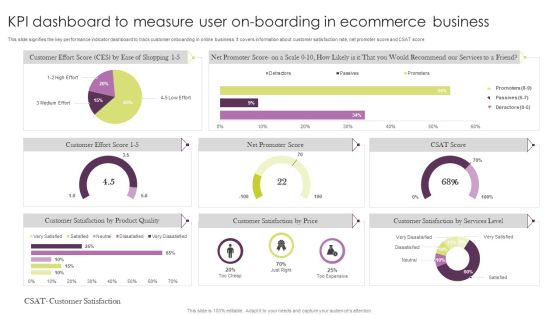
KPI Dashboard To Measure User On Boarding In Ecommerce Business Microsoft PDF
This slide signifies the key performance indicator dashboard to track customer onboarding in online business. It covers information about customer satisfaction rate, net promoter score and CSAT score. Showcasing this set of slides titled KPI Dashboard To Measure User On Boarding In Ecommerce Business Microsoft PDF. The topics addressed in these templates are User Boarding Icon, Develop Ecommerce Business. All the content presented in this PPT design is completely editable. Download it and make adjustments in color, background, font etc. as per your unique business setting.

Project Data Quality Kpis Metrics Status Dashboard Designs PDF
This slide covers key metrics to check the quality status of project data. It includes metrics such as accuracy over time, validity, completeness, relevance, uniformity, consistency, accountability, quality, timeliness, integrity, flexibility, etc. Pitch your topic with ease and precision using this Project Data Quality Kpis Metrics Status Dashboard Designs PDF. This layout presents information on Accuracy Over Time, Validity Over Time. It is also available for immediate download and adjustment. So, changes can be made in the color, design, graphics or any other component to create a unique layout.

Client Relationship Management Tracking Dashboard Topics PDF
The following slide depicts the key performing indicators of customer lead management. It includes the platform wise customer lead, upcoming and achieved targets, country wise customer leads etc. Showcasing this set of slides titled Client Relationship Management Tracking Dashboard Topics PDF. The topics addressed in these templates are Targets, Country Wise Customer Leads, Platform Wise Customer Lead. All the content presented in this PPT design is completely editable. Download it and make adjustments in color, background, font etc. as per your unique business setting.

Business Global Trade Management Dashboard Inspiration PDF
This slide presents a dashboard for global export trade management and tracking product delivery activities across different countries. It includes key components such as total exports by quarter, top business units by export values, top countries to export, etc. Showcasing this set of slides titled Business Global Trade Management Dashboard Inspiration PDF. The topics addressed in these templates are Business Global Trade, Management Dashboard. All the content presented in this PPT design is completely editable. Download it and make adjustments in color, background, font etc. as per your unique business setting.
Construction Project Cost Control And Budget Limitations Tracker Graphics PDF
This slide displays cost tracker for effective management of budget constraints associated with the project. It includes key components such as actual spend, total forecast, pending received, etc. Showcasing this set of slides titled Construction Project Cost Control And Budget Limitations Tracker Graphics PDF. The topics addressed in these templates are Quality Tracking, Budgeted Rate, Cost Tracking. All the content presented in this PPT design is completely editable. Download it and make adjustments in color, background, font etc. as per your unique business setting.

KPI Dashboard To Track Marketing Return On Investment Performance Background PDF
This slide shows key performance indicators dashboard to measure the performs of marketing campaign. It includes metrics such as campaign score, standard customers, growth rate, campaign income, etc. Showcasing this set of slides titled KPI Dashboard To Track Marketing Return On Investment Performance Background PDF. The topics addressed in these templates are Customer Distribution, Standard Customers, Growth Rate. All the content presented in this PPT design is completely editable. Download it and make adjustments in color, background, font etc. as per your unique business setting.
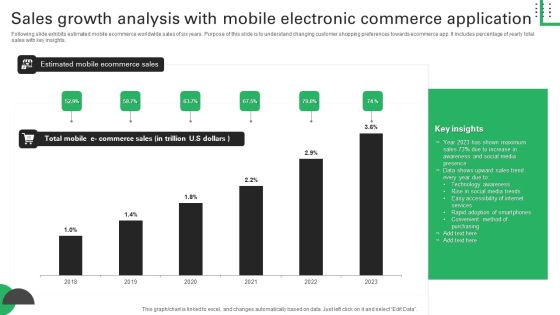
Sales Growth Analysis With Mobile Electronic Commerce Application Structure PDF
Following slide exhibits estimated mobile ecommerce worldwide sales of six years. Purpose of this slide is to understand changing customer shopping preferences towards ecommerce app. It includes percentage of yearly total sales with key insights. Pitch your topic with ease and precision using this Sales Growth Analysis With Mobile Electronic Commerce Application Structure PDF. This layout presents information on Shown Maximum, Awareness Social Media, Accessibility Internet. It is also available for immediate download and adjustment. So, changes can be made in the color, design, graphics or any other component to create a unique layout.
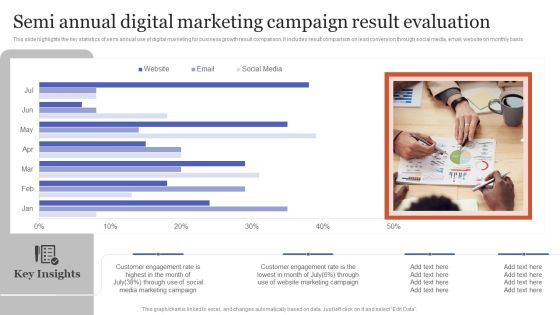
Semi Annual Digital Marketing Campaign Result Evaluation Topics PDF
This slide highlights the key statistics of semi annual use of digital marketing for business growth result comparison. It includes result comparison on lead conversion through social media, email, website on monthly basis. Pitch your topic with ease and precision using this Semi Annual Digital Marketing Campaign Result Evaluation Topics PDF. This layout presents information on Customer Engagement, Marketing Campaign, Through Social. It is also available for immediate download and adjustment. So, changes can be made in the color, design, graphics or any other component to create a unique layout.

Customer Service Organizational Efficiency Gain Assessment With KPI Dashboard Slides PDF
The following slide highlights the key insights of customer service management to optimize issue response process. It includes elements such as average talk time, queue time, answer time, abandoned on hold, voice mails etc. Showcasing this set of slides titled Customer Service Organizational Efficiency Gain Assessment With KPI Dashboard Slides PDF. The topics addressed in these templates are Activity, Unsuccessful Inbound Calls, Efficiency. All the content presented in this PPT design is completely editable. Download it and make adjustments in color, background, font etc. as per your unique business setting.
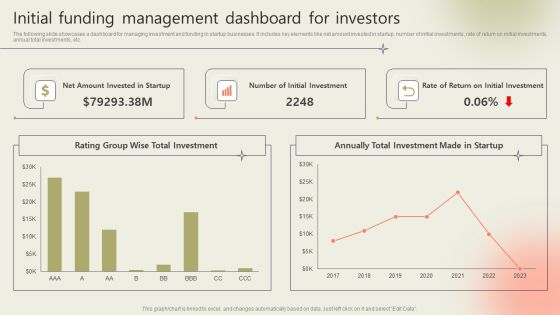
Initial Funding Management Dashboard For Investors Demonstration PDF
The following slide showcases a dashboard for managing investment and funding in startup businesses. It includes key elements like net amount invested in startup, number of initial investments, rate of return on initial investments, annual total investments, etc. Showcasing this set of slides titled Initial Funding Management Dashboard For Investors Demonstration PDF. The topics addressed in these templates are Initial Funding Management, Dashboard For Investors. All the content presented in this PPT design is completely editable. Download it and make adjustments in color, background, font etc. as per your unique business setting.

Actual Vs Budgeted Earning Breakup Dashboard Inspiration PDF
This style showcases revenue breakdown dashboard that can help organization to compare the actual vs budgeted amount and calculate the variance in target achievements. Its key components are product revenue, services revenue and total revenues. Showcasing this set of slides titled Actual Vs Budgeted Earning Breakup Dashboard Inspiration PDF. The topics addressed in these templates are Actual Vs Budgeted, Earning Breakup Dashboard. All the content presented in this PPT design is completely editable. Download it and make adjustments in color, background, font etc. as per your unique business setting.
Social Media Influencer Marketing Campaign Performance Tracking Report Ppt PowerPoint Presentation File Backgrounds PDF
This slide represents the dashboard representing the lead generation through the social media influencer marketing campaign carried out by the organization. It shows measurement of performance through key metrics of post impressions, engagements, clicks and video views etc.Showcasing this set of slides titled Social Media Influencer Marketing Campaign Performance Tracking Report Ppt PowerPoint Presentation File Backgrounds PDF. The topics addressed in these templates are Post Impressions, Post Engagements, Massages During Publishing. All the content presented in this PPT design is completely editable. Download it and make adjustments in color, background, font etc. as per your unique business setting.

Customer Goods Production Business Sales Contribution For Domestic And International Themes PDF
This slide highlights the business sales contribution for domestic market, international market and other market for the year of 2021 and 2022 with key takeaways. Get a simple yet stunning designed Customer Goods Production Business Sales Contribution For Domestic And International Themes PDF. It is the best one to establish the tone in your meetings. It is an excellent way to make your presentations highly effective. So, download this PPT today from Slidegeeks and see the positive impacts. Our easy-to-edit Customer Goods Production Business Sales Contribution For Domestic And International Themes PDF can be your go-to option for all upcoming conferences and meetings. So, what are you waiting for Grab this template today.

Direct Advertising Response Rates Survey Microsoft PDF
This slide presents the survey results to track the response rates of different marketing avenues that allow marketers determine key strategies to focus on for increasing campaign effectiveness. It includes, bar graph analysis of in house versus prospect marketing for email campaign response rates, direct mail and telemarketing. Showcasing this set of slides titled Direct Advertising Response Rates Survey Microsoft PDF. The topics addressed in these templates are Direct Marketing, Direct Advertising, Response Rates. All the content presented in this PPT design is completely editable. Download it and make adjustments in color, background, font etc. as per your unique business setting.
Storage Facility Productivity Tracking KPI Dashboard Graphics PDF
This slide showcases a dashboard for tracking and managing warehouse productivity to optimize logistics operations. It includes key components such as warehouse operating costs, perfect order rate, total shipments by country and on time shipments. Showcasing this set of slides titled Storage Facility Productivity Tracking KPI Dashboard Graphics PDF. The topics addressed in these templates are Warehouse Operating Costs, Perfect Order Rate, Total Shipment Country. All the content presented in this PPT design is completely editable. Download it and make adjustments in color, background, font etc. as per your unique business setting.
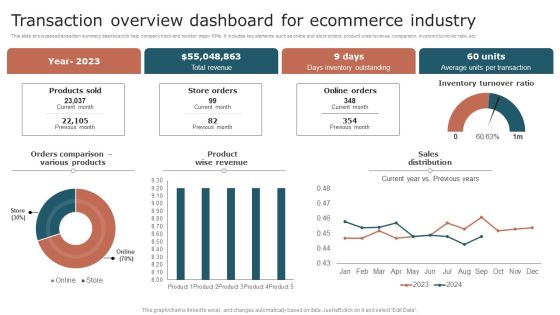
Transaction Overview Dashboard For Ecommerce Industry Summary PDF
This slide showcases transaction summary dashboard to help company track and monitor major KPIs. It includes key elements such as online and store orders, product wise revenue, comparison, inventory turnover ratio, etc. Pitch your topic with ease and precision using this Transaction Overview Dashboard For Ecommerce Industry Summary PDF. This layout presents information on Revenue, Inventory Outstanding, Transaction. It is also available for immediate download and adjustment. So, changes can be made in the color, design, graphics or any other component to create a unique layout.

Google Adwords Strategic Campaign Performance Analysis Download PDF
The following slide displays google adwords campaign KPI trends to help company review change in values over time. It includes key metrics such as impressions, clicks, click through rate and conversions. Pitch your topic with ease and precision using this Google Adwords Strategic Campaign Performance Analysis Download PDF. This layout presents information on Google Ads Impression, Google Ads Clicks, Google Ads Conversions. It is also available for immediate download and adjustment. So, changes can be made in the color, design, graphics or any other component to create a unique layout.

Executive Summary Of Annual Sales Performance Topics PDF
The following slide highlights the sales performance for the year 2021 to track the achievements and assist further decision making. It also includes key highlights, performance indicators, growth stimulators, channel mix etc. Pitch your topic with ease and precision using this Executive Summary Of Annual Sales Performance Topics PDF. This layout presents information on Growth Stimulators, Sales, Value Proposition. It is also available for immediate download and adjustment. So, changes can be made in the color, design, graphics or any other component to create a unique layout.
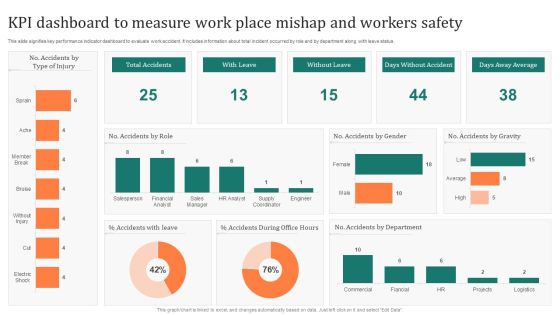
KPI Dashboard To Measure Work Place Mishap And Workers Safety Inspiration PDF
This slide signifies key performance indicator dashboard to evaluate work accident. It includes information about total incident occurred by role and by department along with leave status. Pitch your topic with ease and precision using this KPI Dashboard To Measure Work Place Mishap And Workers Safety Inspiration PDF. This layout presents information on Accidents Role, Accidents Leave, Accidents Department. It is also available for immediate download and adjustment. So, changes can be made in the color, design, graphics or any other component to create a unique layout.
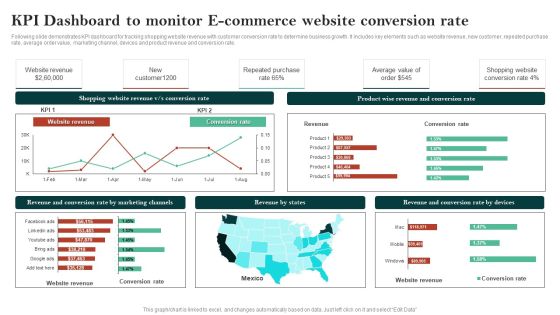
Kpi Dashboard To Monitor E Commerce Website Conversion Rate Clipart PDF
Following slide demonstrates KPI dashboard for tracking shopping website revenue with customer conversion rate to determine business growth. It includes key elements such as website revenue, new customer, repeated purchase rate, average order value, marketing channel, devices and product revenue and conversion rate. Showcasing this set of slides titled Kpi Dashboard To Monitor E Commerce Website Conversion Rate Clipart PDF. The topics addressed in these templates are Shopping Website Revenue, Conversion Rate, Website Revenue. All the content presented in this PPT design is completely editable. Download it and make adjustments in color, background, font etc. as per your unique business setting.

KPI Dashboard To Monitor Public Promotion Marketing Practices Template PDF
Mentioned slide demonstrates dashboard for tracking monthly public relations marketing practices to determine marketing department performance. It includes key components such as month press release for product, blogs and articles posts, social media channel uploads, etc. Pitch your topic with ease and precision using this KPI Dashboard To Monitor Public Promotion Marketing Practices Template PDF. This layout presents information on Paid Media, Owned Media, Total News Release, Comparison Graph. It is also available for immediate download and adjustment. So, changes can be made in the color, design, graphics or any other component to create a unique layout.

Strategic Organization Evaluation Of Geography Wise Revenue Split Ppt File Graphics Download PDF
This slide showcases strategic review of income earned from various business locations to help company formulate appropriate expansion strategies. It further includes information about percentage share of each country in total revenue. Showcasing this set of slides titled Strategic Organization Evaluation Of Geography Wise Revenue Split Ppt File Graphics Download PDF. The topics addressed in these templates are Total Revenue 2023, Key Analysis, FY 22 Revenue, FY 23 Revenue. All the content presented in this PPT design is completely editable. Download it and make adjustments in color, background, font etc. as per your unique business setting.

Business Drivers For Better Organizational Result Ppt Summary Templates PDF
The slide highlights key drivers to influence a businesss financial and operational outcomes. It included business drivers such as increase in business stores, rise in volume of products sold, etc to achieve outcomes such as business growth, rise in no. of orders, etc. Showcasing this set of slides titled Business Drivers For Better Organizational Result Ppt Summary Templates PDF. The topics addressed in these templates are Website Traffic, Page Views, Conversion Rate, New Customers. All the content presented in this PPT design is completely editable. Download it and make adjustments in color, background, font etc. as per your unique business setting.

KPI Dashboard To Measure Performance Of Client Acquisition Strategy Slides PDF
This slide represents the key Performance Indicator dashboard to track marketing strategies that are implemented to increase engagement rate. It includes total visits, cost per click, engagement rate and impressions total. Showcasing this set of slides titled KPI Dashboard To Measure Performance Of Client Acquisition Strategy Slides PDF. The topics addressed in these templates are Visits Total, Cost Per Click, Engagement Rate, Impressions Total. All the content presented in this PPT design is completely editable. Download it and make adjustments in color, background, font etc. as per your unique business setting.

KPI Dashboard To Measure Sales Divisional Strategy Performance Microsoft PDF
This slide signifies the key performance indicator dashboard to evaluate sales department strategy. It covers information regarding to the leads generated, conversion rate, top product in revenue. Pitch your topic with ease and precision using this KPI Dashboard To Measure Sales Divisional Strategy Performance Microsoft PDF. This layout presents information on Sales Rations, Lead Generation, Customer Conversion. It is also available for immediate download and adjustment. So, changes can be made in the color, design, graphics or any other component to create a unique layout.
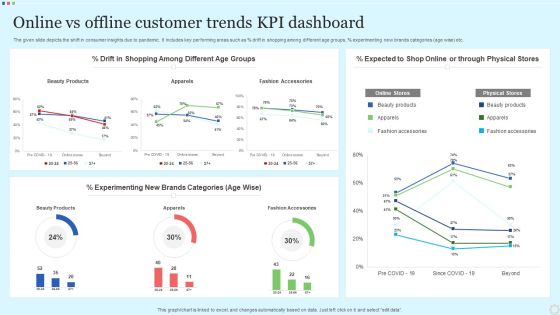
Online Vs Offline Customer Trends Kpi Dashboard Rules PDF
The given slide depicts the shift in consumer insights due to pandemic. It includes key performing areas such as percent drift in shopping among different age groups, percent experimenting new brands categories age wise etc. Showcasing this set of slides titled Online Vs Offline Customer Trends Kpi Dashboard Rules PDF. The topics addressed in these templates are Beauty Products, Apparels, Fashion Accessories. All the content presented in this PPT design is completely editable. Download it and make adjustments in color, background, font etc. as per your unique business setting.
Lead Tracking Dashboard With Metric Comparison Brochure PDF
This slide showcases dashboard of lead pipeline that can help to identify total number of leads generated and expenses incurred to acquire the audience. It also showcases other key performance metrics like lead breakdown by status and number of leads per month. Pitch your topic with ease and precision using this Lead Tracking Dashboard With Metric Comparison Brochure PDF. This layout presents information on Metric Comparison, Lead Pipeline, Lead Breakdown Status. It is also available for immediate download and adjustment. So, changes can be made in the color, design, graphics or any other component to create a unique layout.
Lead Tracking Metrics Dashboard With User Responses Diagrams PDF
This slide showcases dashboard for lead conversion metrics that can help organization to filter out total leads interested from the leads who have responded to the phone calls by organization. It also showcases key metrics such as leads busiest hours, leads busiest days, phone number types and lead types. Showcasing this set of slides titled Lead Tracking Metrics Dashboard With User Responses Diagrams PDF. The topics addressed in these templates are Busiest Hours Leads, Conversion Metrics, Lead Types. All the content presented in this PPT design is completely editable. Download it and make adjustments in color, background, font etc. as per your unique business setting.
Monthly Comparison Dashboard For Lead Tracking Sample PDF
This slide showcases dashboard that can help organization to compare the leads converted in different months and make changes in sales and marketing campaigns . Its key components lead generated by country, by industry type and lead sources by month. Showcasing this set of slides titled Monthly Comparison Dashboard For Lead Tracking Sample PDF. The topics addressed in these templates are Leads Received, Industry Type, Lead Generated. All the content presented in this PPT design is completely editable. Download it and make adjustments in color, background, font etc. as per your unique business setting.

Sales Monitoring Dashboard With Monthly Qualified Leads Guidelines PDF
This slide showcases dashboard that can help organization to monitor the sales pipeline velocity and predict future sales more accurately plus increase the leads converted. Its key components are monthly qualified leads, win rate based on deal size, monthly sales cycle and number of leads at each stage of pipeline. Pitch your topic with ease and precision using this Sales Monitoring Dashboard With Monthly Qualified Leads Guidelines PDF. This layout presents information on Monthly Qualified, Monthly Sales Cycle, Deal Size. It is also available for immediate download and adjustment. So, changes can be made in the color, design, graphics or any other component to create a unique layout.
Sales Performance Dashboard With Average Lead Tracking Time Background PDF
This slide showcases dashboard for sales performance that can help organization to analyze the effectiveness of sales campaigns and average response time of lead. Its key components are average contract value, average sales cycle length, follow up contract rate and sales activity. Showcasing this set of slides titled Sales Performance Dashboard With Average Lead Tracking Time Background PDF. The topics addressed in these templates are Avg Contract Value, Sales Activity, Contract Rate. All the content presented in this PPT design is completely editable. Download it and make adjustments in color, background, font etc. as per your unique business setting.
Website Leads Tracking Dashboard With Traffic Sources Infographics PDF
This slide showcases dashboard for lead generation that can help organziation to identify the traffic sources plus visitors and make changes in SEO of website. It also showcases key metrics that are bounce rate by week, visitors by user type, top channels by conversion, top campaign by conversion and top pages by conversion. Pitch your topic with ease and precision using this Website Leads Tracking Dashboard With Traffic Sources Infographics PDF. This layout presents information on Visitors User Type, Traffic Sources, Bounce Rate Week. It is also available for immediate download and adjustment. So, changes can be made in the color, design, graphics or any other component to create a unique layout.

Logistics Management Revenue Analysis Dashboard With Orders Revenue Brochure PDF
This slide showcases shipping dashboard that can help company to calculate the revenue generated from delivered products and track the monthly order status. Its key components are highest revenue days, subscription revenue, order status, order revenue and transaction paid status. Showcasing this set of slides titled Logistics Management Revenue Analysis Dashboard With Orders Revenue Brochure PDF. The topics addressed in these templates are Order Revenue, Transaction Paid, Subscription Revenue. All the content presented in this PPT design is completely editable. Download it and make adjustments in color, background, font etc. as per your unique business setting.
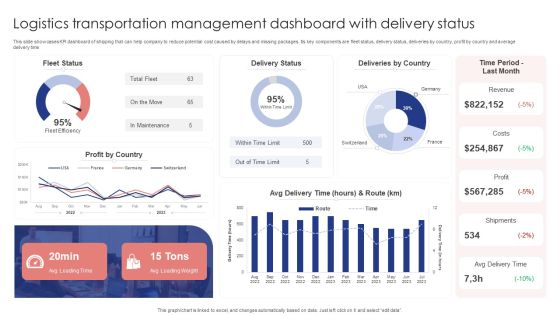
Logistics Transportation Management Dashboard With Delivery Status Portrait PDF
This slide showcases KPI dashboard of shipping that can help company to reduce potential cost caused by delays and missing packages. Its key components are fleet status, delivery status, deliveries by country, profit by country and average delivery time. Showcasing this set of slides titled Logistics Transportation Management Dashboard With Delivery Status Portrait PDF. The topics addressed in these templates are Fleet Status, Delivery Status, Deliveries By Country. All the content presented in this PPT design is completely editable. Download it and make adjustments in color, background, font etc. as per your unique business setting.
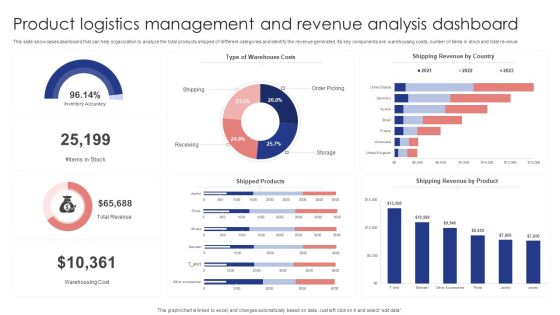
Product Logistics Management And Revenue Analysis Dashboard Demonstration PDF
This slide showcases dashboard that can help organization to analyze the total products shipped of different categories and identify the revenue generated. Its key components are warehousing costs, number of items in stock and total revenue. Pitch your topic with ease and precision using this Product Logistics Management And Revenue Analysis Dashboard Demonstration PDF. This layout presents information on Warehouse Costs, Shipping Revenue Country, Shipped Products . It is also available for immediate download and adjustment. So, changes can be made in the color, design, graphics or any other component to create a unique layout.
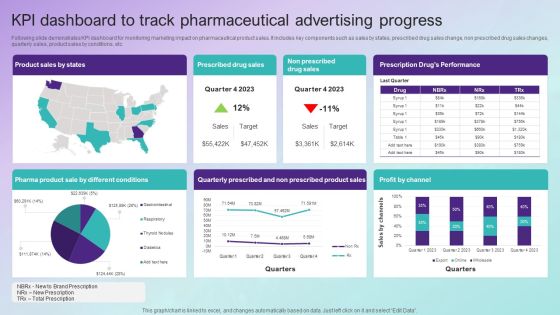
KPI Dashboard To Track Pharmaceutical Advertising Progress Topics PDF
Following slide demonstrates KPI dashboard for monitoring marketing impact on pharmaceutical product sales. It includes key components such as sales by states, prescribed drug sales change, non prescribed drug sales changes, quarterly sales, product sales by conditions, etc. Showcasing this set of slides titled KPI Dashboard To Track Pharmaceutical Advertising Progress Topics PDF. The topics addressed in these templates are Product Sales By States, Prescribed Drug Sales, Non Prescribed Drug Sales, Profit By Channel. All the content presented in this PPT design is completely editable. Download it and make adjustments in color, background, font etc. as per your unique business setting.
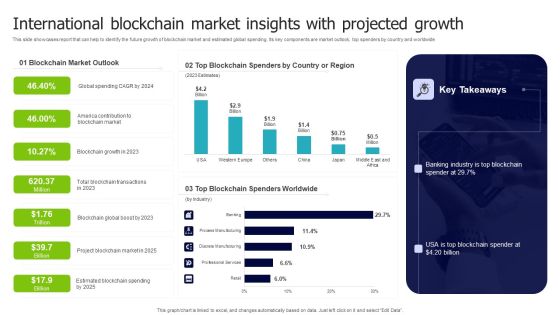
International Blockchain Market Insights With Projected Growth Microsoft PDF
This slide showcases report that can help to identify the future growth of blockchain market and estimated global spending. Its key components are market outlook, top spenders by country and worldwide. Showcasing this set of slides titled International Blockchain Market Insights With Projected Growth Microsoft PDF. The topics addressed in these templates are Blockchain Market Outlook, Blockchain Spenders, Country Region. All the content presented in this PPT design is completely editable. Download it and make adjustments in color, background, font etc. as per your unique business setting.

International Sales Performance Dashboard With Regional Market Report Inspiration PDF
This slide showcases global report that can help organization to estimate forecast of the sales and identify yearly revenue generated. Its key elements are yearly sales, market share, regional outlook, competitor analysis and geographical sales. Pitch your topic with ease and precision using this International Sales Performance Dashboard With Regional Market Report Inspiration PDF. This layout presents information on Regional Outlook, Sales And Forecast, Market Share Overview. It is also available for immediate download and adjustment. So, changes can be made in the color, design, graphics or any other component to create a unique layout.
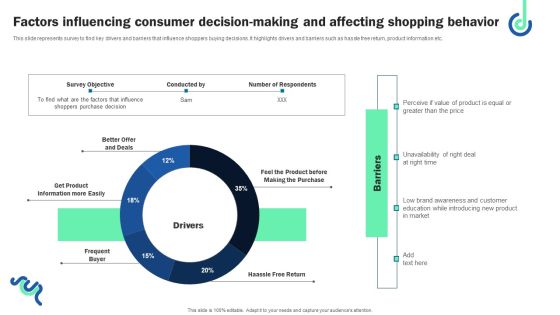
Factors Influencing Consumer Decision Making And Affecting Shopping Behavior Clipart PDF
This slide represents survey to find key drivers and barriers that influence shoppers buying decisions. It highlights drivers and barriers such as hassle free return, product information etc. Slidegeeks is one of the best resources for PowerPoint templates. You can download easily and regulate Factors Influencing Consumer Decision Making And Affecting Shopping Behavior Clipart PDF for your personal presentations from our wonderful collection. A few clicks is all it takes to discover and get the most relevant and appropriate templates. Use our Templates to add a unique zing and appeal to your presentation and meetings. All the slides are easy to edit and you can use them even for advertisement purposes.
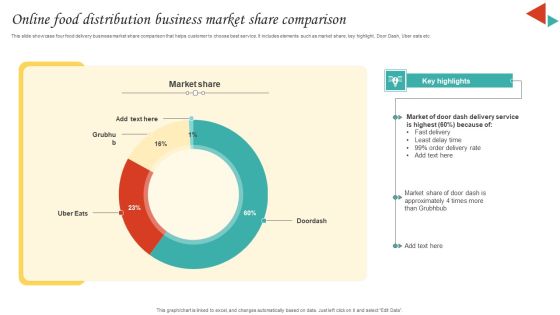
Online Food Distribution Business Market Share Comparison Diagrams PDF
This slide showcase four food delivery business market share comparison that helps customer to choose best service. It includes elements such as market share, key highlight, Door Dash, Uber eats etc. Showcasing this set of slides titled Online Food Distribution Business Market Share Comparison Diagrams PDF. The topics addressed in these templates are Market Share, Delivery Service, Least Delay Time. All the content presented in this PPT design is completely editable. Download it and make adjustments in color, background, font etc. as per your unique business setting.
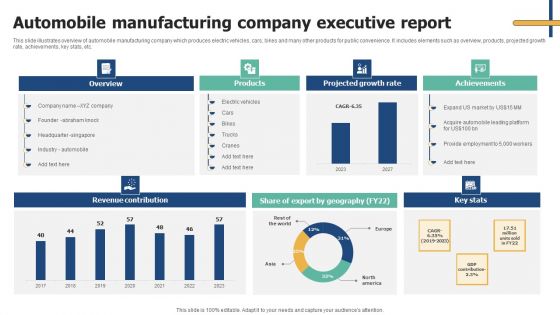
Automobile Manufacturing Company Executive Report Elements PDF
This slide illustrates overview of automobile manufacturing company which produces electric vehicles, cars, bikes and many other products for public convenience. It includes elements such as overview, products, projected growth rate, achievements, key stats, etc. Showcasing this set of slides titled Automobile Manufacturing Company Executive Report Elements PDF. The topics addressed in these templates are Overview, Products, Projected Growth Rate. All the content presented in this PPT design is completely editable. Download it and make adjustments in color, background, font etc. as per your unique business setting.

Digital Terrorism Attack Trends On USA Ideas PDF
This slide shows cyber terrorism attack trends on USA organizations for decade to highlight importance of cyber security systems. It includes valuation of losses, categories of cyber attacks and victim companies etc. Showcasing this set of slides titled Digital Terrorism Attack Trends On USA Ideas PDF. The topics addressed in these templates are Key Insights, Internet, Digital Terrorism Attack Trends. All the content presented in this PPT design is completely editable. Download it and make adjustments in color, background, font etc. as per your unique business setting.

Sales Employee Representative Performance Scorecard Dashboard For Healthcare Industry Clipart PDF
This slide showcases sales performance of healthcare products which can be used by managers to evaluate business achievements. It includes key components such as monthly sales comparison, sales performance of products by different channels, sales team performance. Pitch your topic with ease and precision using this Sales Employee Representative Performance Scorecard Dashboard For Healthcare Industry Clipart PDF. This layout presents information on Monthly Sales Comparison, Revenue By Previous Year, Sales Performance, Different Products, Different Channels, Sales Team Performance . It is also available for immediate download and adjustment. So, changes can be made in the color, design, graphics or any other component to create a unique layout.
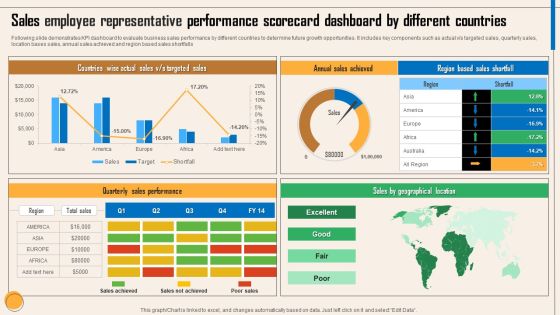
Sales Employee Representative Performance Scorecard Dashboard By Different Countries Themes PDF
Following slide demonstrates KPI dashboard to evaluate business sales performance by different countries to determine future growth opportunities. It includes key components such as actual v or s targeted sales, quarterly sales, location bases sales, annual sales achieved and region based sales shortfalls. Showcasing this set of slides titled Sales Employee Representative Performance Scorecard Dashboard By Different Countries Themes PDF. The topics addressed in these templates are Countries Wise Actual Sales, V Or S Targeted Sales, Annual Sales Achieved, Quarterly Sales Performance, Sales By Geographical Location. All the content presented in this PPT design is completely editable. Download it and make adjustments in color, background, font etc. as per your unique business setting.

Marketing Campaign Performance Measurement Dashboard Download PDF
This slide represents the dashboard showing the performance of search engine marketing campaign run by an organization. It includes key performance indicators such as account activity, campaigns by targeting, landing page speed, keyword relevancy, budget spendings etc. Showcasing this set of slides titled Marketing Campaign Performance Measurement Dashboard Download PDF. The topics addressed in these templates are Keyword Relevancy, Campaigns By Targeting, Budget. All the content presented in this PPT design is completely editable. Download it and make adjustments in color, background, font etc. as per your unique business setting.

Big Data Analytics Analysts Salary Range Structure PDF
This slide showcases big data managers salary range by different experience level for improve business decision making. It includes key components such as analyst experience level, minimum salary range and maximum salary range. Pitch your topic with ease and precision using this Big Data Analytics Analysts Salary Range Structure PDF. This layout presents information on Analyst Manager, Data Management, Management Skills. It is also available for immediate download and adjustment. So, changes can be made in the color, design, graphics or any other component to create a unique layout.

Digital KPI Dashboard To Track Email Bounce Slides PDF
This slide shows dashboard which can e used by organizations to monitor performance of email. It includes key performance indicators such as traffic status, conversions, behaviors, etc. Pitch your topic with ease and precision using this Digital KPI Dashboard To Track Email Bounce Slides PDF. This layout presents information on Digital Kpi Dashboard, Track Email Bounce. It is also available for immediate download and adjustment. So, changes can be made in the color, design, graphics or any other component to create a unique layout.

Industry Specific Dynamic Costing Model Demonstration PDF
This slide highlights a dynamic pricing model showing various pricing methods used by different industries. It includes key components such as industry, dynamic pricing examples, perishable inventory, price, seasonality, differentiated willingness to pay, fixed capacity, etc. Pitch your topic with ease and precision using this Industry Specific Dynamic Costing Model Demonstration PDF. This layout presents information on Dynamic Pricing, E Commerce, Target. It is also available for immediate download and adjustment. So, changes can be made in the color, design, graphics or any other component to create a unique layout.

Metrics To Measure Content Advertising Success Demonstration PDF
This slide represents key performance indicators used by marketers to measure effectiveness of content marketing strategy. It covers website traffic, direct sales, lead quality etc. The Metrics To Measure Content Advertising Success Demonstration PDF is a compilation of the most recent design trends as a series of slides. It is suitable for any subject or industry presentation, containing attractive visuals and photo spots for businesses to clearly express their messages. This template contains a variety of slides for the user to input data, such as structures to contrast two elements, bullet points, and slides for written information. Slidegeeks is prepared to create an impression.

Fix And Flip Method For Renovating Real Estate Budget Allocation For Major Expenses Involved Slides PDF
This slide represents budget allocation for the key cost that are involved in house flipping process faced by investor. It includes purchase price, renovating cost, carrying cost and selling cost. You can download easily and regulate Fix And Flip Method For Renovating Real Estate Budget Allocation For Major Expenses Involved Slides PDF for your personal presentations from our wonderful collection. A few clicks is all it takes to discover and get the most relevant and appropriate templates. Use our Templates to add a unique zing and appeal to your presentation and meetings. All the slides are easy to edit and you can use them even for advertisement purposes.
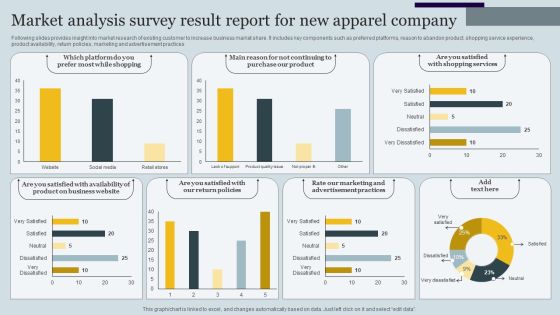
Market Analysis Survey Result Report For New Apparel Company Survey SS
Following slides provides insight into market research of existing customer to increase business market share. It includes key components such as preferred platforms, reason to abandon product, shopping service experience, product availability, return policies, marketing and advertisement practices. Showcasing this set of slides titled Market Analysis Survey Result Report For New Apparel Company Survey SS. The topics addressed in these templates are Purchase Our Product, Shopping Services, Advertisement Practices. All the content presented in this PPT design is completely editable. Download it and make adjustments in color, background, font etc. as per your unique business setting.
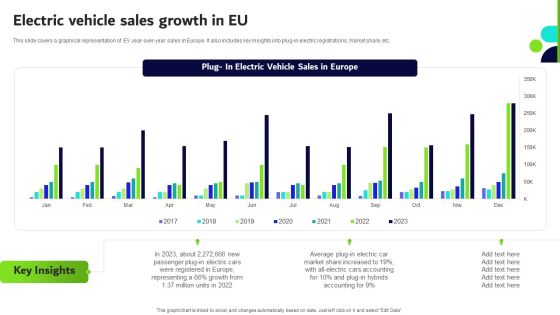
Transformative Impact Of Electric Vehicles On Transportation Industry Electric Vehicle Sales Growth In EU Topics PDF
This slide covers a graphical representation of EV year-over-year sales in Europe. It also includes key insights into plug-in electric registrations, market share, etc. Slidegeeks is one of the best resources for PowerPoint templates. You can download easily and regulate Transformative Impact Of Electric Vehicles On Transportation Industry Electric Vehicle Sales Growth In EU Topics PDF for your personal presentations from our wonderful collection. A few clicks is all it takes to discover and get the most relevant and appropriate templates. Use our Templates to add a unique zing and appeal to your presentation and meetings. All the slides are easy to edit and you can use them even for advertisement purposes.
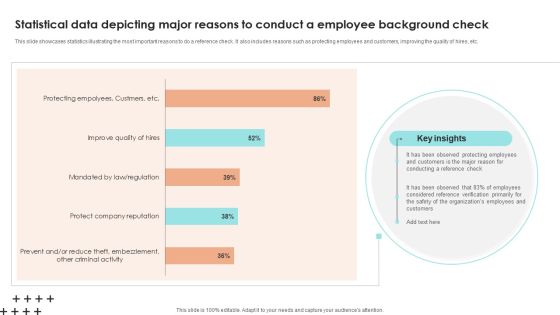
Statistical Data Depicting Major Reasons To Conduct A Employee Background Check Download PDF
This slide showcases statistics illustrating the most important reasons to do a reference check. It also includes reasons such as protecting employees and customers, improving the quality of hires, etc. Pitch your topic with ease and precision using this Statistical Data Depicting Major Reasons To Conduct A Employee Background Check Download PDF. This layout presents information on Key Insights, Reference Check, Customers. It is also available for immediate download and adjustment. So, changes can be made in the color, design, graphics or any other component to create a unique layout.

Metrics With Open Changes By Priority And Age Guidelines PDF
This slide showcases dashboard for monitoring status of open changes in the organization to ensure timely resolution of tickets raised. It includes key elements such as backlog growth, days, trend, distribution, etc. Pitch your topic with ease and precision using this Metrics With Open Changes By Priority And Age Guidelines PDF This layout presents information on Change Backlog Growth, Priority, Age. It is also available for immediate download and adjustment. So, changes can be made in the color, design, graphics or any other component to create a unique layout.

Factors Encouraging E Commerce Transactions By Customers Infographics PDF
This slide analysis major factors that influence online purchase decision of customer foe ecommerce company. It includes details such as ability to compare prices, time savings, free shipping offers, etc. Showcasing this set of slides titled Factors Encouraging E Commerce Transactions By Customers Infographics PDF. The topics addressed in these templates are Key Insights, Convenience, Push Form Offline. All the content presented in this PPT design is completely editable. Download it and make adjustments in color, background, font etc. as per your unique business setting.

Monthly Financial Metrics Dashboard With Income Statement Infographics PDF
This following slide displays kpis to communicate key financial information to both internal and external stakeholders. It further includes details such as OPEX ratio, revenue and COGS, income, expenses, etc. Showcasing this set of slides titled Monthly Financial Metrics Dashboard With Income Statement Infographics PDF. The topics addressed in these templates are Gross Profit Margin, Taxes, Revenue. All the content presented in this PPT design is completely editable. Download it and make adjustments in color, background, font etc. as per your unique business setting.

Monthly Financial Metrics Graph With Operating Profit And Cost Of Goods Sold Pictures PDF
This slide showcases monthly analytics for to keep company finances organized and identify problem areas. It further includes details about marketing, professional fees, COGS and other operations. Pitch your topic with ease and precision using this Monthly Financial Metrics Graph With Operating Profit And Cost Of Goods Sold Pictures PDF. This layout presents information on Key Insights, Operating Profit, Total Revenue. It is also available for immediate download and adjustment. So, changes can be made in the color, design, graphics or any other component to create a unique layout.

Monthly Financials Metrics With Revenue And Gross Profit Professional PDF
This slide displays P and L variance analysis to closely monitor key financial parameters of the company. It includes details about sales, discounts allowed, freight income, customer finance charges, etc. Showcasing this set of slides titled Monthly Financials Metrics With Revenue And Gross Profit Professional PDF. The topics addressed in these templates are Amount, Current Month, Profit. All the content presented in this PPT design is completely editable. Download it and make adjustments in color, background, font etc. as per your unique business setting.
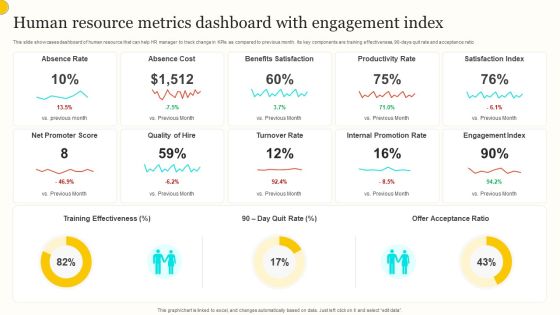
Human Resource Metrics Dashboard With Engagement Index Guidelines PDF
This slide showcases dashboard of human resource that can help HR manager to track change in KPIs as compared to previous month. Its key components are training effectiveness, 90 days quit rate and acceptance ratio. Pitch your topic with ease and precision using this Human Resource Metrics Dashboard With Engagement Index Guidelines PDF. This layout presents information on Absence Rate, Absence Cost, Benefits Satisfaction. It is also available for immediate download and adjustment. So, changes can be made in the color, design, graphics or any other component to create a unique layout.

Human Resource Recruitment Funnel Dashboard With Metrics Summary PDF
This slide showcases KPIs dashboard of human resource recruitment that can help to track the employee hiring process using funnel. Its key components are time to hire, time to fill days and recruitment cost. Showcasing this set of slides titled Human Resource Recruitment Funnel Dashboard With Metrics Summary PDF. The topics addressed in these templates are Recruitment Funnel, Male Female Ratio, Age Applicants. All the content presented in this PPT design is completely editable. Download it and make adjustments in color, background, font etc. as per your unique business setting.
Real Time Employment Tracking Dashboard With Human Resource Metrics Brochure PDF
This slide showcases dashboard that can help human resource manager to track the salary and hiring status of employee in organization. Its key KPIs are permanent rate, turnover rate, absenteeism rate, employees hired and employees left. Showcasing this set of slides titled Real Time Employment Tracking Dashboard With Human Resource Metrics Brochure PDF. The topics addressed in these templates are Average Age, Permanent Rate, Headcount. All the content presented in this PPT design is completely editable. Download it and make adjustments in color, background, font etc. as per your unique business setting.
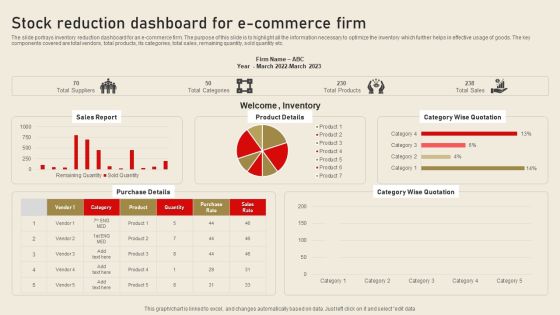
Stock Reduction Dashboard For E Commerce Firm Ideas PDF
The slide portrays inventory reduction dashboard for an e commerce firm. The purpose of this slide is to highlight all the information necessary to optimize the inventory which further helps in effective usage of goods. The key components covered are total vendors, total products, its categories, total sales, remaining quantity, sold quantity etc. Showcasing this set of slides titled Stock Reduction Dashboard For E Commerce Firm Ideas PDF. The topics addressed in these templates are Sales Report, Product Details, Category Wise Quotation. All the content presented in this PPT design is completely editable. Download it and make adjustments in color, background, font etc. as per your unique business setting.

AI Application In Multiple Human Resource Management Functions Inspiration PDF
Following slide showcases various areas of human resource management where artificial intelligence can be used by managers to improve strategic workforce decisions. It includes key elements such as recruitment and selection, employee management, training, HR policy analysis, workforce automation, corporate compliance, etc. Showcasing this set of slides titled AI Application In Multiple Human Resource Management Functions Inspiration PDF. The topics addressed in these templates are Artificial Intelligence, Hiring Process, Artificial Intelligence. All the content presented in this PPT design is completely editable. Download it and make adjustments in color, background, font etc. as per your unique business setting.
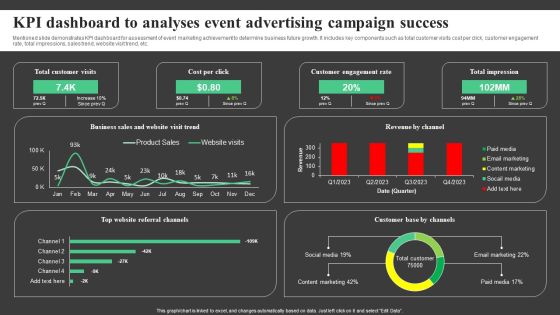
KPI Dashboard To Analyses Event Advertising Campaign Success Topics PDF
Mentioned slide demonstrates KPI dashboard for assessment of event marketing achievement to determine business future growth. It includes key components such as total customer visits cost per click, customer engagement rate, total impressions, sales trend, website visit trend, etc. Showcasing this set of slides titled KPI Dashboard To Analyses Event Advertising Campaign Success Topics PDF. The topics addressed in these templates are Total Customer Visits, Cost Per Click, Customer Engagement Rate . All the content presented in this PPT design is completely editable. Download it and make adjustments in color, background, font etc. as per your unique business setting.

Statistical Relationship Between Organic Growth Procedure And Profitability Rules PDF
This slide showcases graph depicting relationship between organic growth process and profit . It includes annual growth , annual profits , frequent , occasional and no researches etc. Pitch your topic with ease and precision using this Statistical Relationship Between Organic Growth Procedure And Profitability Rules PDF. This layout presents information on Key Insights, Frequency, Profitability. It is also available for immediate download and adjustment. So, changes can be made in the color, design, graphics or any other component to create a unique layout.
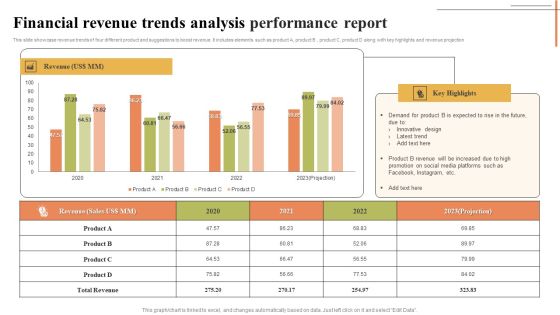
Financial Revenue Trends Analysis Performance Report Designs PDF
This slide showcase revenue trends of four different product and suggestions to boost revenue. It includes elements such as product A, product B , product C, product D along with key highlights and revenue projection. Showcasing this set of slides titled Financial Revenue Trends Analysis Performance Report Designs PDF. The topics addressed in these templates are Revenue, Innovative Design, Latest Trend. All the content presented in this PPT design is completely editable. Download it and make adjustments in color, background, font etc. as per your unique business setting.
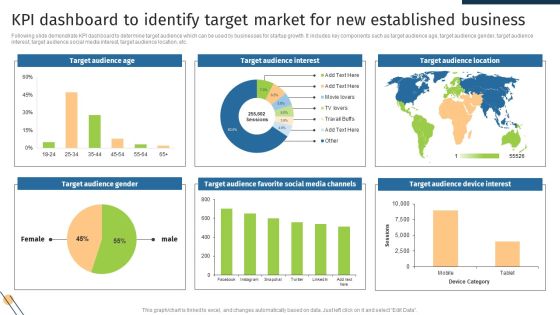
KPI Dashboard To Identify Target Market For New Established Business Formats PDF
Following slide demonstrate KPI dashboard to determine target audience which can be used by businesses for startup growth. It includes key components such as target audience age, target audience gender, target audience interest, target audience social media interest, target audience location, etc. Showcasing this set of slides titled KPI Dashboard To Identify Target Market For New Established Business Formats PDF. The topics addressed in these templates are Target Audience Age, Target Audience Interest, Target Audience Location. All the content presented in this PPT design is completely editable. Download it and make adjustments in color, background, font etc. as per your unique business setting.

KPI Dashboard To Track Best Market Opportunities For New Established Business Pictures PDF
Following slide showcases KPI dashboard to determine best market for launching new business. It includes key components such as growth rate by different industries, best states to launch startup, sales forecast, market growth forecast, projected sales by different states. Showcasing this set of slides titled KPI Dashboard To Track Best Market Opportunities For New Established Business Pictures PDF. The topics addressed in these templates are Forecasted Sales, Growth Rate, Startup Industries. All the content presented in this PPT design is completely editable. Download it and make adjustments in color, background, font etc. as per your unique business setting.

Business Operations Performance Assessment Dashboard Information PDF
This slide presents a dashboard to analyze and monitor business operational activities and gain insights of functional performance. It includes key components such as revenue, sigh ups, visitors, revenue by source, monthly sign ups, top performing agents, etc. Showcasing this set of slides titled Business Operations Performance Assessment Dashboard Information PDF. The topics addressed in these templates are Source, Monthly, Agents. All the content presented in this PPT design is completely editable. Download it and make adjustments in color, background, font etc. as per your unique business setting.
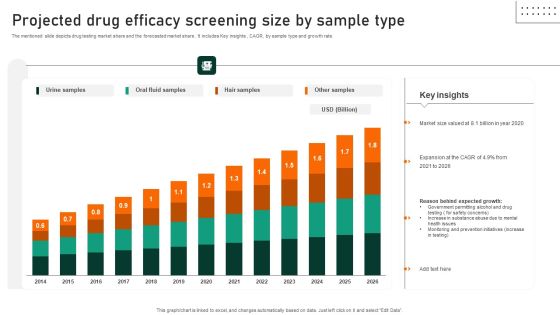
Projected Drug Efficacy Screening Size By Sample Type Portrait PDF
The mentioned slide depicts drug testing market share and the forecasted market share . It includes Key insights , CAGR, by sample type and growth rate. Showcasing this set of slides titled Projected Drug Efficacy Screening Size By Sample Type Portrait PDF. The topics addressed in these templates are Market Size Valued, Reason Behind Expected Growth, Government Permitting. All the content presented in this PPT design is completely editable. Download it and make adjustments in color, background, font etc. as per your unique business setting.

Business Intelligence Dashboard To Monitor Performance Of Retail Business Infographics PDF
The following slide displays BI dashboard for real time tracking of key business financials. It further includes details about scorecard, sales distribution, supply and demand, etc. Pitch your topic with ease and precision using this Business Intelligence Dashboard To Monitor Performance Of Retail Business Infographics PDF. This layout presents information on Business Intelligence Dashboard, Monitor Performance, Retail Business. It is also available for immediate download and adjustment. So, changes can be made in the color, design, graphics or any other component to create a unique layout.

Impact Of Product Corporate Diversification In Improving Business Performance Infographics PDF
This slide shows impact of product corporate diversification on business performance with various key performance indicators. It includes quality, productivity, profitability, market share, brand recognition etc. Showcasing this set of slides titled Impact Of Product Corporate Diversification In Improving Business Performance Infographics PDF. The topics addressed in these templates are Product Transportation Costs, Product Quality, Market Segments. All the content presented in this PPT design is completely editable. Download it and make adjustments in color, background, font etc. as per your unique business setting.

B2B Content Advertising Campaign Impact On Business Growth Sample PDF
Following slide demonstrates content marketing campaign impact on b2b company performance. It includes performance areas such as improved business awareness, lead generation, improve customer loyalty, increase sales, etc. Pitch your topic with ease and precision using this B2B Content Advertising Campaign Impact On Business Growth Sample PDF. This layout presents information on Key Insights, Growth, Marketing . It is also available for immediate download and adjustment. So, changes can be made in the color, design, graphics or any other component to create a unique layout.
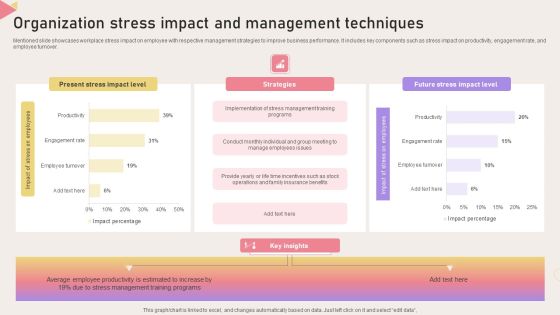
Organization Stress Impact And Management Techniques Sample PDF
Mentioned slide showcases workplace stress impact on employee with respective management strategies to improve business performance. It includes key components such as stress impact on productivity, engagement rate, and employee turnover. Pitch your topic with ease and precision using this Organization Stress Impact And Management Techniques Sample PDF. This layout presents information on Strategies, Impact Level, Technique. It is also available for immediate download and adjustment. So, changes can be made in the color, design, graphics or any other component to create a unique layout.

Survey To Build Organization Stress Management Techniques Formats PDF
Mentioned slide demonstrated survey summary of employee stress analysis for development for effective workplace stress management strategies. It includes key components such as employee stress level, work priority. and employee turnover. Pitch your topic with ease and precision using this Survey To Build Organization Stress Management Techniques Formats PDF. This layout presents information on Employee Stress Level, Work Priority, Productivity. It is also available for immediate download and adjustment. So, changes can be made in the color, design, graphics or any other component to create a unique layout.

Incorporating HIS To Enhance Healthcare Services Outsourcing Medical Billing Services To Improve Efficiency Ideas PDF
This slide covers key benefits of outsourcing medical services to serve better to patients. It involves advantages such as patient centered care, minimize costs and reliable security. The Incorporating HIS To Enhance Healthcare Services Outsourcing Medical Billing Services To Improve Efficiency Ideas PDF is a compilation of the most recent design trends as a series of slides. It is suitable for any subject or industry presentation, containing attractive visuals and photo spots for businesses to clearly express their messages. This template contains a variety of slides for the user to input data, such as structures to contrast two elements, bullet points, and slides for written information. Slidegeeks is prepared to create an impression.

Strategic Market Insight Implementation Guide Product Yearly Sales Trend Analysis Sample Clipart PDF
The following slide showcases a graph of yearly sales for analyzing trends over different periods. It highlights components such as yearly product sales, data analysis and key reasons. Slidegeeks is one of the best resources for PowerPoint templates. You can download easily and regulate Strategic Market Insight Implementation Guide Product Yearly Sales Trend Analysis Sample Clipart PDF for your personal presentations from our wonderful collection. A few clicks is all it takes to discover and get the most relevant and appropriate templates. Use our Templates to add a unique zing and appeal to your presentation and meetings. All the slides are easy to edit and you can use them even for advertisement purposes.

Airtable Capital Funding Pitch Deck Shareholding Pattern Clipart PDF
This slide covers shareholding pattern of company. It involves key shareholders such as founder, pre seed investors, venture capitalists, Investor A,B and C and it also highlights ratio of shareholders before and after crowd funding. Make sure to capture your audiences attention in your business displays with our gratis customizable Airtable Capital Funding Pitch Deck Shareholding Pattern Clipart PDF. These are great for business strategies, office conferences, capital raising or task suggestions. If you desire to acquire more customers for your tech business and ensure they stay satisfied, create your own sales presentation with these plain slides.
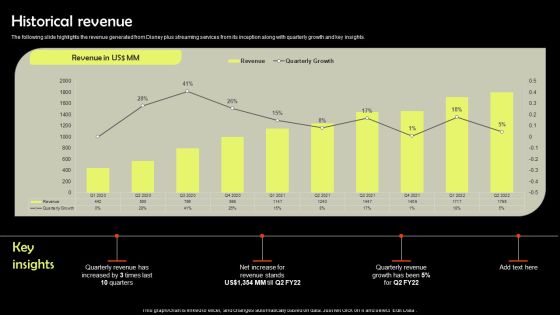
Digital Media Streaming Platform Company Profile Historical Revenue Ideas PDF
The following slide highlights the revenue generated from Disney plus streaming services from its inception along with quarterly growth and key insights. Slidegeeks is one of the best resources for PowerPoint templates. You can download easily and regulate Digital Media Streaming Platform Company Profile Historical Revenue Ideas PDF for your personal presentations from our wonderful collection. A few clicks is all it takes to discover and get the most relevant and appropriate templates. Use our Templates to add a unique zing and appeal to your presentation and meetings. All the slides are easy to edit and you can use them even for advertisement purposes.

Strategy To Enhance Supply Chain Operations Impact Of Implementing Logistics Management Strategies Rules PDF
This slide covers impact of implementing key logistics management strategies in supply chain. It involves rising impact on perfect order rate and diminishing impact on average cycle time. The Strategy To Enhance Supply Chain Operations Impact Of Implementing Logistics Management Strategies Rules PDF is a compilation of the most recent design trends as a series of slides. It is suitable for any subject or industry presentation, containing attractive visuals and photo spots for businesses to clearly express their messages. This template contains a variety of slides for the user to input data, such as structures to contrast two elements, bullet points, and slides for written information. Slidegeeks is prepared to create an impression.

Data Driven Marketing Solutions Firm Company Profile Operating Profit And Margin Topics PDF
The following slide highlights the profit and margin from business operations for a time period of 6 years. It also provides key insights for the operating income data The Data Driven Marketing Solutions Firm Company Profile Operating Profit And Margin Topics PDF is a compilation of the most recent design trends as a series of slides. It is suitable for any subject or industry presentation, containing attractive visuals and photo spots for businesses to clearly express their messages. This template contains a variety of slides for the user to input data, such as structures to contrast two elements, bullet points, and slides for written information. Slidegeeks is prepared to create an impression.
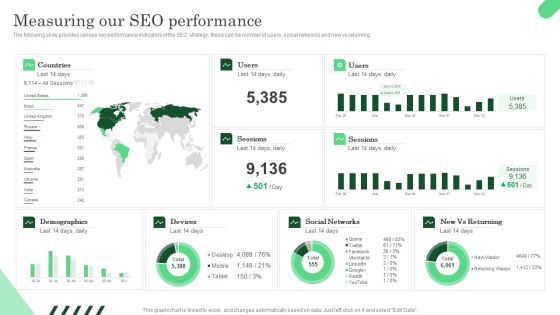
Measuring Our SEO Performance Ppt PowerPoint Presentation File Gallery PDF
The following slide provides various key performance indicators of the SEO strategy, these can be number of users, social networks and new vs returning. This Measuring Our SEO Performance Ppt PowerPoint Presentation File Gallery PDF is perfect for any presentation, be it in front of clients or colleagues. It is a versatile and stylish solution for organizing your meetings. The Measuring Our SEO Performance Ppt PowerPoint Presentation File Gallery PDF features a modern design for your presentation meetings. The adjustable and customizable slides provide unlimited possibilities for acing up your presentation. Slidegeeks has done all the homework before launching the product for you. So, do not wait, grab the presentation templates today
Social Media Performance Tracking And Monitoring Dashboard Graphics PDF
The following slide showcases a dashboard to track and measure social media platforms performance. It includes key elements such as website traffic, social media referral rate, site revenue, social media site revenue, etc. The Social Media Performance Tracking And Monitoring Dashboard Graphics PDF is a compilation of the most recent design trends as a series of slides. It is suitable for any subject or industry presentation, containing attractive visuals and photo spots for businesses to clearly express their messages. This template contains a variety of slides for the user to input data, such as structures to contrast two elements, bullet points, and slides for written information. Slidegeeks is prepared to create an impression.
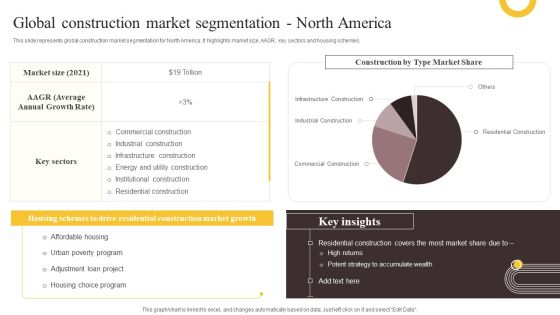
Global Construction Sector Industry Report Global Construction Market Segmentation North America Information PDF
This slide represents global construction market segmentation for North America. It highlights market size, AAGR, key sectors and housing schemes. Slidegeeks is one of the best resources for PowerPoint templates. You can download easily and regulate Global Construction Sector Industry Report Global Construction Market Segmentation North America Information PDF for your personal presentations from our wonderful collection. A few clicks is all it takes to discover and get the most relevant and appropriate templates. Use our Templates to add a unique zing and appeal to your presentation and meetings. All the slides are easy to edit and you can use them even for advertisement purposes.
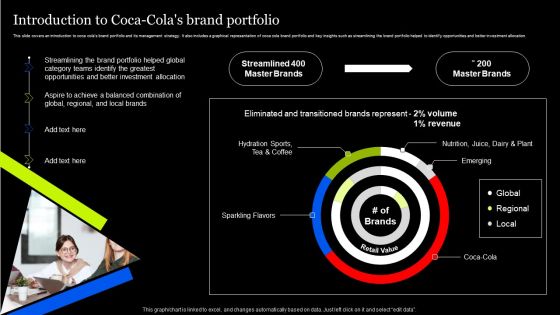
Tactical Approach To Enhance Brand Portfolio Introduction To Coca Colas Brand Portfolio Information PDF
This slide covers an introduction to coca colas brand portfolio and its management strategy. It also includes a graphical representation of coca cola brand portfolio and key insights such as streamlining the brand portfolio helped to identify opportunities and better investment allocation. There are so many reasons you need a Tactical Approach To Enhance Brand Portfolio Introduction To Coca Colas Brand Portfolio Information PDF. The first reason is you can not spend time making everything from scratch, Thus, Slidegeeks has made presentation templates for you too. You can easily download these templates from our website easily.

Global Biogas Industry Growth Analysis Download PDF
This slide depicts analysis of compound annual growth rate of biofuels which helps in reduction of carbon dioxide emission in environment. It include elements such as market drivers, feedstock, market revenue, opportunities and key players Showcasing this set of slides titled Global Biogas Industry Growth Analysis Download PDF. The topics addressed in these templates are Market Drivers, Opportunities, Global Biofuel Market. All the content presented in this PPT design is completely editable. Download it and make adjustments in color, background, font etc. as per your unique business setting.

Market Share Growth Dashboard For Business Feasibility Study Demonstration PDF
This slide showcases dashboard for market share growth that can help company to estimate the potential for profits and analyze business feasibility. Its key components are last year market share, last year relative market share, YOY relative market share growth and YOY growth Showcasing this set of slides titled Market Share Growth Dashboard For Business Feasibility Study Demonstration PDF. The topics addressed in these templates are Market Share, Feasibility Study, Growth. All the content presented in this PPT design is completely editable. Download it and make adjustments in color, background, font etc. as per your unique business setting.

Corporate Conditions And Evaluation Survey Summary Report Survey SS
Following slide demonstrates summarized report for business insights and conditions to evaluate business cost efficiency. It includes key elements such as present and future demand for products and services offered and present and future business turnover assessment. Showcasing this set of slides titled Corporate Conditions And Evaluation Survey Summary Report Survey SS. The topics addressed in these templates are Business Turnover Insights, Demand For Goods And Services. All the content presented in this PPT design is completely editable. Download it and make adjustments in color, background, font etc. as per your unique business setting.

Sample Restaurant Survey Feedback Example Questionnaire Result Report Survey SS
Following slides demonstrates sample questionnaire for hotel feedback which can be used by hotel managers to determine customer service improvement areas. It includes key elements such as purpose of hotel trip, check in experience, satisfaction with hotel cleanliness, and staff behaviour. Pitch your topic with ease and precision using this Sample Restaurant Survey Feedback Example Questionnaire Result Report Survey SS. This layout presents information on Maintenance, Staff Hospitality, Cleanliness Services . It is also available for immediate download and adjustment. So, changes can be made in the color, design, graphics or any other component to create a unique layout.

Enterprise Sales Trend Analysis And Forecast Overview Summary PDF
The following slide represents the sales trend of the past few years to project future revenue growth. It includes sales data from year 2018 2022 and projected sales for 2022 2025 along with key insights. Pitch your topic with ease and precision using this Enterprise Sales Trend Analysis And Forecast Overview Summary PDF. This layout presents information on Sales Revenue, Overview, Projection. It is also available for immediate download and adjustment. So, changes can be made in the color, design, graphics or any other component to create a unique layout.

Manufacturing Enterprise Inventory Overview Dashboard Graphics PDF
The following slide depicts the key performance areas of inventory management in a manufacturing firm. It includes KPIs such as inventory turnover ratio, out of stock rate, on time in full rate, product wise average time to sell etc. Showcasing this set of slides titled Manufacturing Enterprise Inventory Overview Dashboard Graphics PDF. The topics addressed in these templates are Turnover Analysis, Dashboard, Stock Rate. All the content presented in this PPT design is completely editable. Download it and make adjustments in color, background, font etc. as per your unique business setting.

Online Enterprise Customer Activity Overview Dashboard Download PDF
The following slide highlights the key performance indicators of online customer activity to create better user experience. It includes KPAs such as website traffic, device breakdown summary, average time spent etc. Pitch your topic with ease and precision using this Online Enterprise Customer Activity Overview Dashboard Download PDF. This layout presents information on Device, Analysis, Summary. It is also available for immediate download and adjustment. So, changes can be made in the color, design, graphics or any other component to create a unique layout.

Budget For Running Personalized Marketing Campaign Ppt Infographics Images PDF
This showcases budget that can be allocated by organization before running personalized marketing campaigns. Key elements of budget are email marketing, data analysis, social media marketing, mobile application personalization and website optimization. This Budget For Running Personalized Marketing Campaign Ppt Infographics Images PDF is perfect for any presentation, be it in front of clients or colleagues. It is a versatile and stylish solution for organizing your meetings. The product features a modern design for your presentation meetings. The adjustable and customizable slides provide unlimited possibilities for acing up your presentation. Slidegeeks has done all the homework before launching the product for you. So, do not wait, grab the presentation templates today

Budget For Running Personalized Marketing Campaign Ppt Portfolio Visuals PDF
This showcases budget that can be allocated by organization before running personalized marketing campaigns. Key elements of budget are email marketing, data analysis, social media marketing, mobile application personalization and website optimization. This Budget For Running Personalized Marketing Campaign Ppt Portfolio Visuals PDF is perfect for any presentation, be it in front of clients or colleagues. It is a versatile and stylish solution for organizing your meetings. The product features a modern design for your presentation meetings. The adjustable and customizable slides provide unlimited possibilities for acing up your presentation. Slidegeeks has done all the homework before launching the product for you. So, do not wait, grab the presentation templates today

Dashboard For Enterprise Recruitment With Time To Hire And Fill Icons PDF
In this slide corporate staffing dashboard highlights important recruitment KPIs to review application trends and candidate response to job vacancy. It further includes details about application, review, assessment, interview, etc. Showcasing this set of slides titled Dashboard For Enterprise Recruitment With Time To Hire And Fill Icons PDF. The topics addressed in these templates are Key Metrics, Experienced Ratio, Applicants. All the content presented in this PPT design is completely editable. Download it and make adjustments in color, background, font etc. as per your unique business setting.
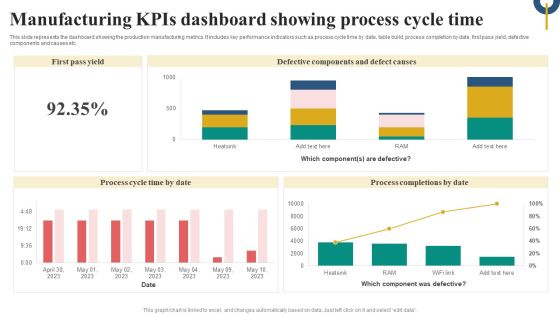
Manufacturing Kpis Dashboard Showing Process Cycle Time Microsoft PDF
This slide represents the dashboard showing the production manufacturing metrics. It includes key performance indicators such as process cycle time by date, table build, process completion by date, first pass yield, defective components and causes etc. Pitch your topic with ease and precision using this Manufacturing Kpis Dashboard Showing Process Cycle Time Microsoft PDF. This layout presents information on Defective Components Defect Causes, Process Cycle, Time By Date, Process Completions By Date. It is also available for immediate download and adjustment. So, changes can be made in the color, design, graphics or any other component to create a unique layout.
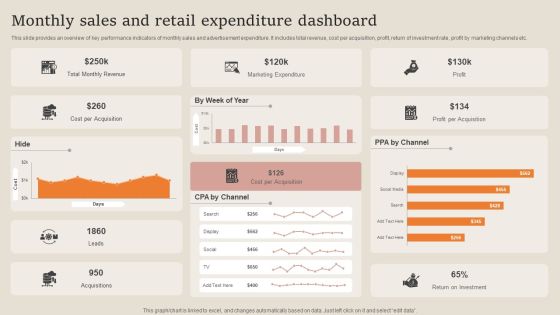
Monthly Sales And Retail Expenditure Dashboard Summary PDF
This slide provides an overview of key performance indicators of monthly sales and advertisement expenditure. It includes total revenue, cost per acquisition, profit, return of investment rate, profit by marketing channels etc. Pitch your topic with ease and precision using this Monthly Sales And Retail Expenditure Dashboard Summary PDF. This layout presents information on Marketing Expenditure, Revenue, Cost Per Acquisition. It is also available for immediate download and adjustment. So, changes can be made in the color, design, graphics or any other component to create a unique layout.
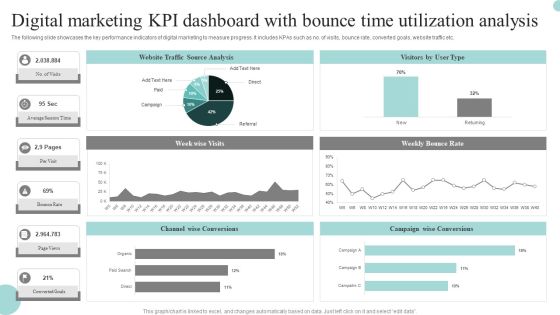
Digital Marketing Kpi Dashboard With Bounce Time Utilization Analysis Graphics PDF
The following slide showcases the key performance indicators of digital marketing to measure progress. It includes KPAs such as no. of visits, bounce rate, converted goals, website traffic etc. Pitch your topic with ease and precision using this Digital Marketing Kpi Dashboard With Bounce Time Utilization Analysis Graphics PDF. This layout presents information on Digital Marketing, KPI Dashboard, Bounce Time Utilization Analysis. It is also available for immediate download and adjustment. So, changes can be made in the color, design, graphics or any other component to create a unique layout.

Website Medical Checkup And Audit Dashboard Background PDF
The slide showcases a dashboard for monitoring website performance and identifying health score of website. It includes key elements like ranking, Google analytics, site audit, Google ranking, backlinks, search console, etc. Showcasing this set of slides titled Website Medical Checkup And Audit Dashboard Background PDF. The topics addressed in these templates are Rankings, Google Analytics, Site Audit. All the content presented in this PPT design is completely editable. Download it and make adjustments in color, background, font etc. as per your unique business setting.

Social Media Platform Analysis For Online Campaign Summary PDF
This slide presents digital campaign analysis through evaluation of different social media platforms, helpful in providing insights on effectiveness of each channel. It includes social media status, key metrics and engagement provided by different channels Pitch your topic with ease and precision using this Social Media Platform Analysis For Online Campaign Summary PDF. This layout presents information on Media Status, Campaign, Engagement. It is also available for immediate download and adjustment. So, changes can be made in the color, design, graphics or any other component to create a unique layout.

Customer Support Services Analysis Dashboard Template PDF
The following slide illustrates dashboard for customer services which can be used to evaluate performance of businesses over the years. It include key elements such as request volume, customer retention, cost per support, revenue, customer satisfaction etc. Showcasing this set of slides titled Customer Support Services Analysis Dashboard Template PDF. The topics addressed in these templates are Customer Support Services, Analysis Dashboard. All the content presented in this PPT design is completely editable. Download it and make adjustments in color, background, font etc. as per your unique business setting.
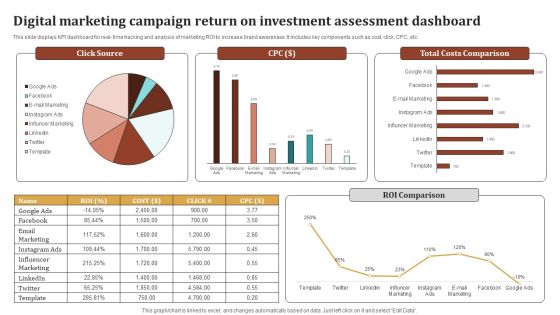
Digital Marketing Campaign Return On Investment Assessment Dashboard Ideas PDF
This slide displays KPI dashboard for real- time tracking and analysis of marketing ROI to increase brand awareness. It includes key components such as cost, click, CPC, etc. Showcasing this set of slides titled Digital Marketing Campaign Return On Investment Assessment Dashboard Ideas PDF. The topics addressed in these templates are Influencer Marketing, Email Marketing, Total Costs Comparison, Roi Comparison. All the content presented in this PPT design is completely editable. Download it and make adjustments in color, background, font etc. as per your unique business setting.

Vendor Performance KPI Dashboard For Distribution Business Formats PDF
This slide exhibits monthly performance dashboard for distribution businesses to track their suppliers and reduce the chance of major disruptions. It includes key elements such as cost per drop, purchase trend, top items, top suppliers, etc. Showcasing this set of slides titled Vendor Performance KPI Dashboard For Distribution Business Formats PDF. The topics addressed in these templates are Purchase Trend, Suppliers, Distribution Business. All the content presented in this PPT design is completely editable. Download it and make adjustments in color, background, font etc. as per your unique business setting.

Customer Segmentation And Behavioral Analysis Target Customer Analysis Ideas PDF
The following slide presents a dashboard for analyzing customer segmentation based on demographics factors. It includes key components such as appointment status value, count of payment method, total payments and age count. The Customer Segmentation And Behavioral Analysis Target Customer Analysis Ideas PDF is a compilation of the most recent design trends as a series of slides. It is suitable for any subject or industry presentation, containing attractive visuals and photo spots for businesses to clearly express their messages. This template contains a variety of slides for the user to input data, such as structures to contrast two elements, bullet points, and slides for written information. Slidegeeks is prepared to create an impression.
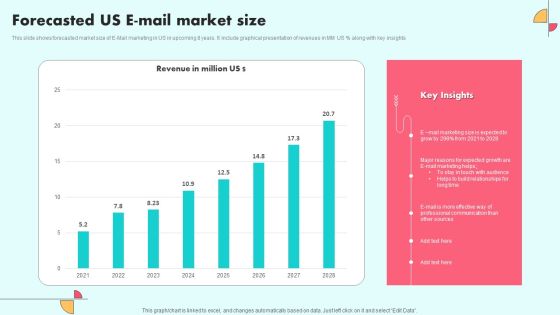
Forecasted Us E Mail Market Size Ideas PDF
This slide shows forecasted market size of E-Mail marketing in US in upcoming 8 years. It include graphical presentation of revenues in MM US percentage along with key insights. Pitch your topic with ease and precision using this Forecasted Us E Mail Market Size Ideas PDF. This layout presents information on E Mail Marketing, Sources, Communication. It is also available for immediate download and adjustment. So, changes can be made in the color, design, graphics or any other component to create a unique layout.

Content Analysis Survey Outcome Percentage Formats PDF
The slide showcases results of content analysis survey in percentage to increase website traffic and customer engagement rate. It includes key elements like case studies, organic research, trending topics, marketing topic and checklists. Showcasing this set of slides titled Content Analysis Survey Outcome Percentage Formats PDF. The topics addressed in these templates are Content Analysis, Survey Outcome Percentage. All the content presented in this PPT design is completely editable. Download it and make adjustments in color, background, font etc. as per your unique business setting.

Customer Experience Analysis Survey Outcome Percentage Portrait PDF
The following slide highlights percentage of results to analyze and enhance customer experience. It includes key elements such as customer experience with product, global net promoter score, regional sales agent performance, satisfaction channel, quarterly NPS, etc. Pitch your topic with ease and precision using this Customer Experience Analysis Survey Outcome Percentage Portrait PDF. This layout presents information on Customer Experience, Promoter Score, Regional Sales. It is also available for immediate download and adjustment. So, changes can be made in the color, design, graphics or any other component to create a unique layout.

Customer Service Satisfaction Survey Outcome In Percentage Microsoft PDF
The slide showcases percentage result of customer satisfaction to identify service improvement areas. It includes key questions related to service satisfaction, service recommendation, business type and service improvement areas. Pitch your topic with ease and precision using this Customer Service Satisfaction Survey Outcome In Percentage Microsoft PDF. This layout presents information on Customer Service, Satisfaction Survey, Outcome In Percentage. It is also available for immediate download and adjustment. So, changes can be made in the color, design, graphics or any other component to create a unique layout.
Online Shopping Survey Outcome In Percentage Icons PDF
The slide showcases percentage results to analyze experience of online shopping to identify areas for enhancing shopping experience. It includes key elements such as reasons for online shopping, elements considered by customers and shopping platforms. Pitch your topic with ease and precision using this Online Shopping Survey Outcome In Percentage Icons PDF. This layout presents information on Price Comparison, Product Information, Online Reviews. It is also available for immediate download and adjustment. So, changes can be made in the color, design, graphics or any other component to create a unique layout.

Outcome In Percentage Of Social Media Survey Demonstration PDF
This slide showcases percentage results of social media survey analyzing youngsters frequency of going online. It includes key elements like trending social media platforms, youngsters own their personal smartphone, etc. Showcasing this set of slides titled Outcome In Percentage Of Social Media Survey Demonstration PDF. The topics addressed in these templates are Frequently Youngsters, Trending Social Apps, Personal Smartphones. All the content presented in this PPT design is completely editable. Download it and make adjustments in color, background, font etc. as per your unique business setting.
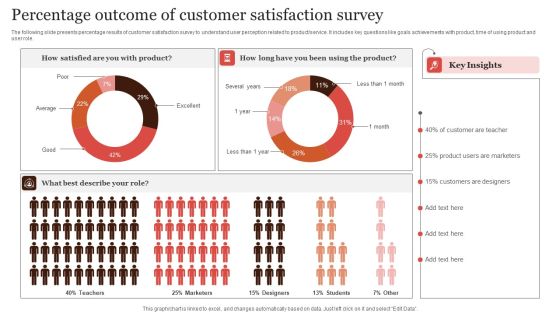
Percentage Outcome Of Customer Satisfaction Survey Infographics PDF
The following slide presents percentage results of customer satisfaction survey to understand user perception related to product or service. It includes key questions like goals achievements with product, time of using product and user role. Pitch your topic with ease and precision using this Percentage Outcome Of Customer Satisfaction Survey Infographics PDF. This layout presents information on Percentage Outcome, Customer Satisfaction Survey. It is also available for immediate download and adjustment. So, changes can be made in the color, design, graphics or any other component to create a unique layout.

Product Market Research Survey Outcome Percentage Elements PDF
This slide showcases percentage of results of market research and analysis survey to effectively understand customer behavior towards product or service. It includes key elements like customer profession, customer by countries and customer responses. Pitch your topic with ease and precision using this Product Market Research Survey Outcome Percentage Elements PDF. This layout presents information on Customer By Countries, Customer Professions, Customer Responses. It is also available for immediate download and adjustment. So, changes can be made in the color, design, graphics or any other component to create a unique layout.
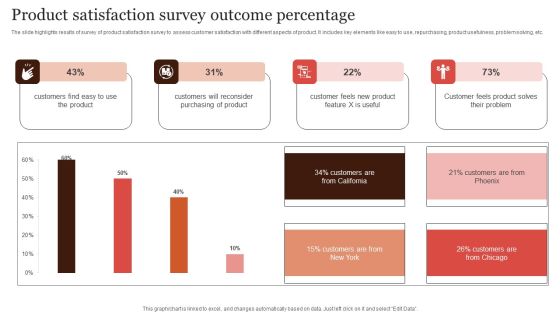
Product Satisfaction Survey Outcome Percentage Elements PDF
The slide highlights results of survey of product satisfaction survey to assess customer satisfaction with different aspects of product. It includes key elements like easy to use, repurchasing, product usefulness, problem solving, etc. Showcasing this set of slides titled Product Satisfaction Survey Outcome Percentage Elements PDF. The topics addressed in these templates are Customers Will Reconsider, Purchasing Of Product, Survey Outcome Percentage. All the content presented in this PPT design is completely editable. Download it and make adjustments in color, background, font etc. as per your unique business setting.
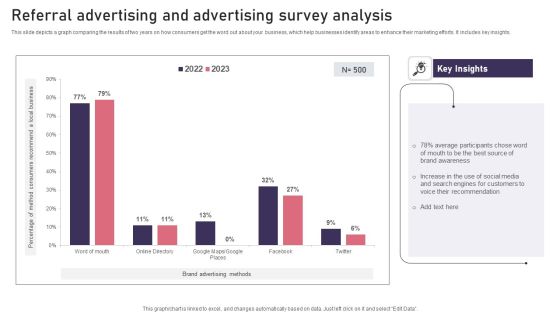
Referral Advertising And Advertising Survey Analysis Background PDF
This slide depicts a graph comparing the results of two years on how consumers get the word out about your business, which help businesses identify areas to enhance their marketing efforts. It includes key insights. Showcasing this set of slides titled Referral Advertising And Advertising Survey Analysis Background PDF. The topics addressed in these templates are Referral Advertising, Advertising Survey Analysis. All the content presented in this PPT design is completely editable. Download it and make adjustments in color, background, font etc. as per your unique business setting.
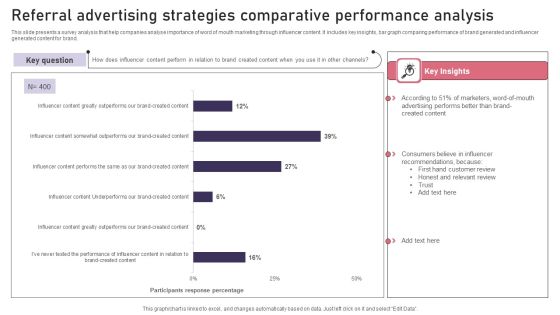
Referral Advertising Strategies Comparative Performance Analysis Diagrams PDF
This slide presents a survey analysis that help companies analyse importance of word of mouth marketing through influencer content. It includes key insights, bar graph comparing performance of brand generated and influencer generated content for brand. Showcasing this set of slides titled Referral Advertising Strategies Comparative Performance Analysis Diagrams PDF. The topics addressed in these templates are Referral Advertising, Strategies Comparative, Performance Analysis. All the content presented in this PPT design is completely editable. Download it and make adjustments in color, background, font etc. as per your unique business setting.

Property Trust Investment Fundraising Facts And Figures Background PDF
This slide highlights a statistical data showing global facts in private real estate fundraising investments. It includes key components such as yearly statistics, number of funds closed, aggregate capital raised, debt, core, core plus, value added, opportunistic, distressed, etc.Showcasing this set of slides titled Property Trust Investment Fundraising Facts And Figures Background PDF. The topics addressed in these templates are Closed At Maximum, Opportunistic Funds. All the content presented in this PPT design is completely editable. Download it and make adjustments in color, background, font etc. as per your unique business setting.
Digital Sales Metrics Showing Enhancement Icons PDF
The following slide represents statistics of online sales key performance indicators KPIs which can assist marketing manager to review their performance and take necessary steps. It include different metrics such as add to cart rate, conversion rate, and revenue per session. Showcasing this set of slides titled Digital Sales Metrics Showing Enhancement Icons PDF. The topics addressed in these templates are Quarterly Online Sales Metrics, Targeted Right Customers, Offered Product Recommendations. All the content presented in this PPT design is completely editable. Download it and make adjustments in color, background, font etc. as per your unique business setting.
Automated Manufacturing Workflow Impact On Business Performance Sample PDF
Mentioned slide showcases statistics highlighting impact of manufacturing process automation on business growth. It includes key components such as product quality, cost efficiency, customer support, resource management, productivity, and customization. Showcasing this set of slides titled Automated Manufacturing Workflow Impact On Business Performance Sample PDF. The topics addressed in these templates are Product Quality Improved, Business Cost Efficiency, Defective Products Development. All the content presented in this PPT design is completely editable. Download it and make adjustments in color, background, font etc. as per your unique business setting.
Dashboard To Track Automated Manufacturing Workflow Progress Professional PDF
Following slide demonstrates KPI dashboard for monitoring automated manufacturing processes performance which can be used by businesses to increase organization efficiency. It includes key components such as total business revenue, Number of customers, total units produced, production rate, monthly production by manufacturing lines, etc. Showcasing this set of slides titled Dashboard To Track Automated Manufacturing Workflow Progress Professional PDF. The topics addressed in these templates are Machine Utilization, Product Delivery, Defective Units Produced. All the content presented in this PPT design is completely editable. Download it and make adjustments in color, background, font etc. as per your unique business setting.
Online Risk Management Dashboard For Tracking Threats And Attacks Icons PDF
The purpose of this slide is to represent dashboard to monitor risks and cyber threats for efficient risk management. It includes various types of key performance indicators such as types of risks, severities, sources and risk meter. Showcasing this set of slides titled Online Risk Management Dashboard For Tracking Threats And Attacks Icons PDF. The topics addressed in these templates are Attack, Indication Severities, Sources. All the content presented in this PPT design is completely editable. Download it and make adjustments in color, background, font etc. as per your unique business setting.
Global Medicare Outpatients Inpatients Kpi Dashboard Template PDF
This slide shows global healthcare KPIs related to outpatients-inpatients through dashboard. It include Key performance indicators such as average global patients, average treatment cost etc. Pitch your topic with ease and precision using this Global Medicare Outpatients Inpatients Kpi Dashboard Template PDF. This layout presents information on Average Treatment Cost, Average Global Patients, Average Available Staff. It is also available for immediate download and adjustment. So, changes can be made in the color, design, graphics or any other component to create a unique layout.
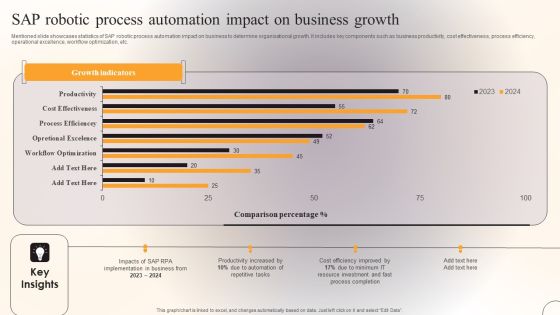
SAP Robotic Process Automation Impact On Business Growth Template PDF
Mentioned slide showcases statistics of SAP robotic process automation impact on business to determine organisational growth. It includes key components such as business productivity, cost effectiveness, process efficiency, operational excellence, workflow optimization, etc. Pitch your topic with ease and precision using this SAP Robotic Process Automation Impact On Business Growth Template PDF. This layout presents information on Productivity, Process Completion, Resource Investment. It is also available for immediate download and adjustment. So, changes can be made in the color, design, graphics or any other component to create a unique layout.

Average Duration Of Stay In Hospital By Patients In EU Member States Slides PDF
This slide showcases patients average hospital stay in EU member countries. It includes data of member countries such as sweden , ireland, denmark , cyprus, germany , etc. Pitch your topic with ease and precision using this Average Duration Of Stay In Hospital By Patients In EU Member States Slides PDF. This layout presents information on Greatest Average, Key Insights. It is also available for immediate download and adjustment. So, changes can be made in the color, design, graphics or any other component to create a unique layout.

Comparison Of Average Duration Of Stay In Different Years Summary PDF
This slide showcases an analysis of the average length of stay in different years. It also includes a decrease observed in the average length of years in the mentioned the years. Showcasing this set of slides titled Comparison Of Average Duration Of Stay In Different Years Summary PDF. The topics addressed in these templates are Key Insights, Average Duration. All the content presented in this PPT design is completely editable. Download it and make adjustments in color, background, font etc. as per your unique business setting.

Emergency Department Duration Of Stay For Elderly Patients And Younger Patients Information PDF
This slide showcases the length of stay in the emergency department for older and younger patients to identify which factors are related to hospital stay duration. It also includes Showcasing this set of slides titled Emergency Department Duration Of Stay For Elderly Patients And Younger Patients Information PDF. The topics addressed in these templates are Key Characteristics, Organizational Factors. All the content presented in this PPT design is completely editable. Download it and make adjustments in color, background, font etc. as per your unique business setting.
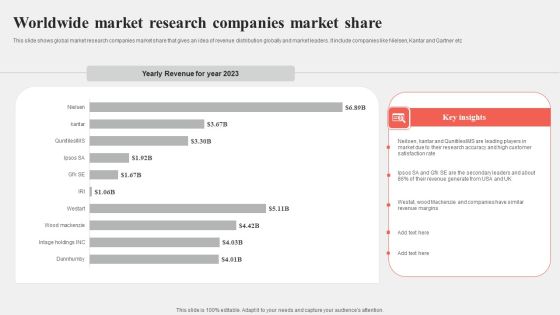
Worldwide Market Research Companies Market Share Portrait PDF
This slide shows global market research companies market share that gives an idea of revenue distribution globally and market leaders. It include companies like Nielsen, Kantar and Gartner etc Pitch your topic with ease and precision using this Worldwide Market Research Companies Market Share Portrait PDF. This layout presents information on Market Share, Key Insights, Worldwide. It is also available for immediate download and adjustment. So, changes can be made in the color, design, graphics or any other component to create a unique layout.

Major Reasons Of Missing Shipment For Manufacturing Firm Demonstration PDF
Following slide demonstrates major reasons of lost packages faced by manufacturing firms leading to reduce business profits. It includes key elements such as lost in transit, product non delivery and product stolen or damaged due to fire. Showcasing this set of slides titled Major Reasons Of Missing Shipment For Manufacturing Firm Demonstration PDF. The topics addressed in these templates are Major Reasons Faced, Product Not Delivered, Customers Due Packaging Error. All the content presented in this PPT design is completely editable. Download it and make adjustments in color, background, font etc. as per your unique business setting.

Average Talent Attrition Cost By Profession Diagrams PDF
This slide illustrates a survey report of professionals facing high turnover cost along with the average rate of all roles. It includes professions such as human resources, research, product management, marketing and consulting. Pitch your topic with ease and precision using this Average Talent Attrition Cost By Profession Diagrams PDF. This layout presents information on Human Resource Manager, Key Highlights, Bad Management. It is also available for immediate download and adjustment. So, changes can be made in the color, design, graphics or any other component to create a unique layout.

 Home
Home