Key Performance Indicators

Social Media Strategy Framework Ppt Sample
This is a social media strategy framework ppt sample. This is a seven stage process. The stages in this process are arrows, business, marketing.
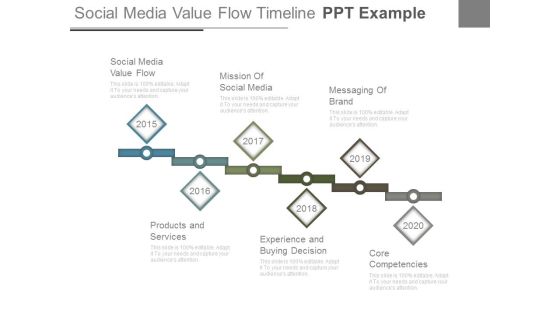
Social Media Value Flow Timeline Ppt Example
This is a social media value flow timeline ppt example. This is a six stage process. The stages in this process are marketing, business, time Planning. \n

Product Support Manufacturing Operations Ppt Sample
This is a product support manufacturing operations ppt sample. This is a three stage process. The stages in this process are marketing, success, business.
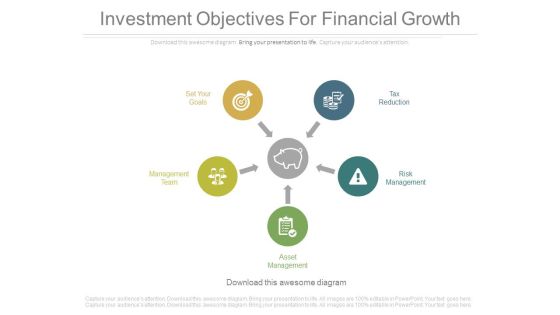
Investment Objectives For Financial Growth Ppt Slides
This is an investment objectives for financial growth ppt slides. This is a five stage process. The stages in this process are marketing, business, success, arrows.

Four Steps Of Strategy Implementation Process Powerpoint Template
Our above business slide contains colorful infographic diagram. Download this template to display four steps of strategy implementation. This diagram provides an effective way of displaying information you can edit text, color, shade and style as per you need.
KPI Dashboard With Pen Vector Icon Ppt PowerPoint Presentation Professional Infographics PDF
Persuade your audience using this kpi dashboard with pen vector icon ppt powerpoint presentation professional infographics pdf. This PPT design covers three stages, thus making it a great tool to use. It also caters to a variety of topics including kpi dashboard with pen vector icon. Download this PPT design now to present a convincing pitch that not only emphasizes the topic but also showcases your presentation skills.

Customer Relationship Management Applications For Retail With Overall Rating Template PDF
This slide focuses on the customer relationship management dashboard which includes region wise lead tracker, team performance, lead generation target, organization performance, tracking target of sales representative, etc. Showcasing this set of slides titled Customer Relationship Management Applications For Retail With Overall Rating Template PDF. The topics addressed in these templates are Team Performance, Maximum Target. All the content presented in this PPT design is completely editable. Download it and make adjustments in color, background, font etc. as per your unique business setting.
Primary And Secondary Shipping Tracking Metrics Profile Rules PDF
This slide covers the KPI profile for defining measures to evaluate KPI performance. It also includes the details for enlisted KPIs such as ID, name, value, unit and rating. Showcasing this set of slides titled Primary And Secondary Shipping Tracking Metrics Profile Rules PDF. The topics addressed in these templates are Secondary, Primary, Metrics Profile. All the content presented in this PPT design is completely editable. Download it and make adjustments in color, background, font etc. as per your unique business setting.

Web Analytics Dashboard Click Through And Conversion Rate Ppt PowerPoint Presentation Professional
This is a web analytics dashboard click through and conversion rate ppt powerpoint presentation professional. This is a three stage process. The stages in this process are marketing analytics, marketing performance, marketing discovery.
Marketing Success Metrics KPI Dashboard For Tracking Seo Analytics Background PDF
This slide covers the KPI dashboard for analyzing SEO metrics such as authority score, organic traffic, organic keywords, paid keywords, ref. Domains, site audit, link-building tool, organic traffic, on-page SEO checker, backlink audit, etc. This Marketing Success Metrics KPI Dashboard For Tracking Seo Analytics Background PDF from Slidegeeks makes it easy to present information on your topic with precision. It provides customization options, so you can make changes to the colors, design, graphics, or any other component to create a unique layout. It is also available for immediate download, so you can begin using it right away. Slidegeeks has done good research to ensure that you have everything you need to make your presentation stand out. Make a name out there for a brilliant performance.
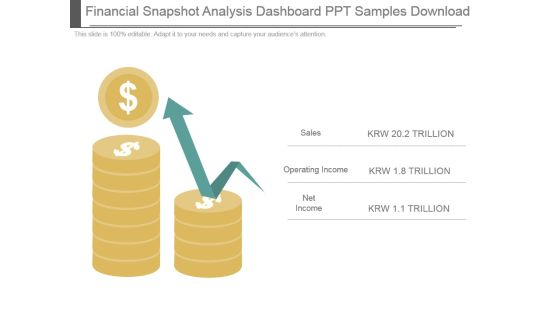
Financial Snapshot Analysis Dashboard Ppt Samples Download
This is a financial snapshot analysis dashboard ppt samples download. This is a two stage process. The stages in this process are sales, operating income, net income.
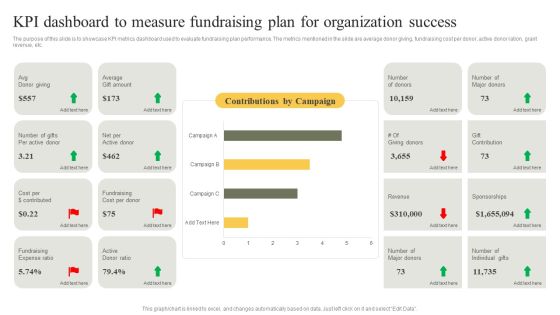
KPI Dashboard To Measure Fundraising Plan For Organization Success Infographics PDF
The purpose of this slide is to showcase KPI metrics dashboard used to evaluate fundraising plan performance. The metrics mentioned in the slide are average donor giving, fundraising cost per donor, active donor ration, grant revenue, etc. Showcasing this set of slides titled KPI Dashboard To Measure Fundraising Plan For Organization Success Infographics PDF. The topics addressed in these templates are Fundraising Cost, Average, Ratio. All the content presented in this PPT design is completely editable. Download it and make adjustments in color, background, font etc. as per your unique business setting.
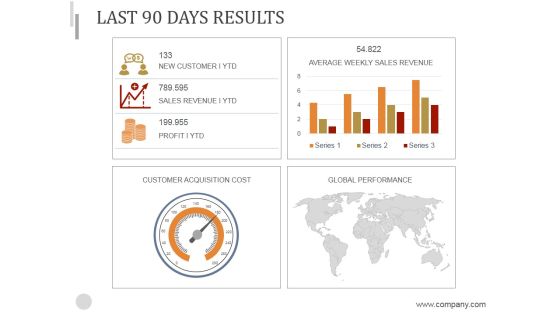
Last 90 Days Results Ppt PowerPoint Presentation Background Image
This is a last 90 days results ppt powerpoint presentation background image. This is a four stage process. The stages in this process are customer acquisition cost, global performance, average weekly sales revenue.

Digital Marketing Strategy Leads Conversion Funnel Ppt PowerPoint Presentation Layouts Example
This is a digital marketing strategy leads conversion funnel ppt powerpoint presentation layouts example. This is a five stage process. The stages in this process are marketing analytics, marketing performance, marketing discovery.

Financial Analysis Vector Bar Graph With Magnifying Glass Ppt PowerPoint Presentation Gallery Design Ideas
This is a financial analysis vector bar graph with magnifying glass ppt powerpoint presentation gallery design ideas. This is a four stage process. The stages in this process are marketing analytics, marketing performance, marketing discovery.
Marketing Analysis Tools Roi And Budget Optimization Ppt PowerPoint Presentation Icon Show
This is a marketing analysis tools roi and budget optimization ppt powerpoint presentation icon show. This is a six stage process. The stages in this process are marketing analytics, marketing performance, marketing discovery.
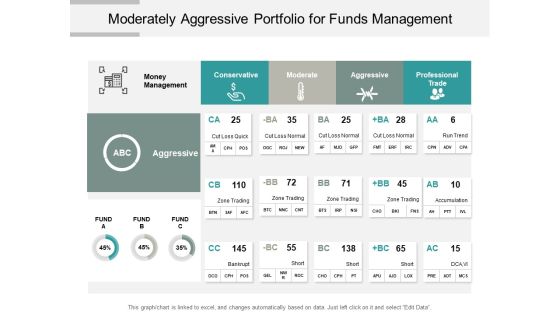
Moderately Aggressive Portfolio For Funds Management Ppt PowerPoint Presentation Ideas Brochure
This is a moderately aggressive portfolio for funds management ppt powerpoint presentation ideas brochure. This is a three stage process. The stages in this process are marketing analytics, marketing performance, marketing discovery.

Worldwide Market Trends Mobile With Bar Graph And Globe Ppt PowerPoint Presentation Styles Demonstration
This is a worldwide market trends mobile with bar graph and globe ppt powerpoint presentation styles demonstration. This is a four stage process. The stages in this process are marketing analytics, marketing performance, marketing discovery.

Business Operations Metrics Dashboard Icon Graphics PDF
Showcasing this set of slides titled Business Operations Metrics Dashboard Icon Graphics PDF. The topics addressed in these templates are Business Operations, Metrics Dashboard Icon. All the content presented in this PPT design is completely editable. Download it and make adjustments in color, background, font etc. as per your unique business setting.

DAD Framework Agile Delivery Metrics Security Ppt Ideas Skills PDF
Listed Here are the metrics used by the organization to measure agile capability on the basis of product performance, security level and user satisfaction. Deliver and pitch your topic in the best possible manner with this DAD framework agile delivery metrics security ppt ideas skills pdf. Use them to share invaluable insights on security, accuracy of planning, functional coverage, performance, resourse consumption and impress your audience. This template can be altered and modified as per your expectations. So, grab it now.
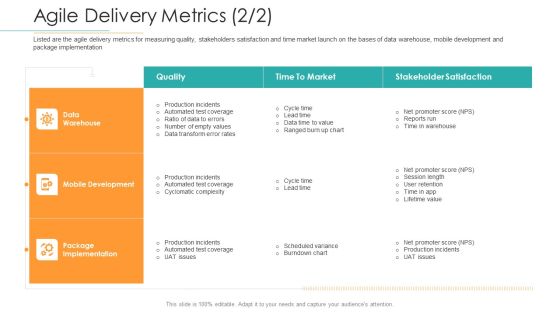
Disciplined Agile Distribution Responsibilities Agile Delivery Metrics Quality Formats PDF
Listed here are the metrics used by the organisation to measure agile capability on the basis of product performance, security level and user satisfaction. Deliver an awe-inspiring pitch with this creative disciplined agile distribution responsibilities agile delivery metrics quality formats pdf bundle. Topics like organisation, measure agile capability, product performance, security, planning can be discussed with this completely editable template. It is available for immediate download depending on the needs and requirements of the user.

Implementing Integrated Software Comparing Hospital Metrics With Competitors Professional PDF
This slide shows the comparison of hospital metrics with competitors such as average length of patient stay, time to service, patient satisfaction, physician performance, patient readmission rate, operating margin, etc.Deliver and pitch your topic in the best possible manner with this Implementing Integrated Software Comparing Hospital Metrics With Competitors Professional PDF. Use them to share invaluable insights on Physician Performance, Patient Satisfaction, Patient Readmission and impress your audience. This template can be altered and modified as per your expectations. So, grab it now.

Sales Optimization Best Practices To Close More Deals Sales KPI Dashboard Accumulated Topics PDF
The sales dashboard is an effective tool that helps in monitoring various sales KPIs in order to aid sales teams in reaching sales goals by analyzing the sales performance. Deliver and pitch your topic in the best possible manner with this sales optimization best practices to close more deals sales kpi dashboard accumulated topics pdf. Use them to share invaluable insights on incremental sales, sales revenue, cost breakdown, accumulated revenue and impress your audience. This template can be altered and modified as per your expectations. So, grab it now.
Sales Department Strategies Increase Revenues Sales KPI Dashboard Ppt Icon Visual Aids PDF
The sales dashboard is an effective tool that helps in monitoring various sales KPIs in order to aid sales teams in reaching sales goals by analyzing the sales performance. Deliver and pitch your topic in the best possible manner with this sales department strategies increase revenues sales kpi dashboard ppt icon visual aids pdf. Use them to share invaluable insights on average revenue, customer lifetime value, customer acquisition cost and impress your audience. This template can be altered and modified as per your expectations. So, grab it now.

Sales Assistance Boost Overall Efficiency Sales KPI Dashboard New Topics PDF
The sales dashboard is an effective tool that helps in monitoring various sales KPIs in order to aid sales teams in reaching sales goals by analyzing the sales performance. Deliver and pitch your topic in the best possible manner with this sales assistance boost overall efficiency sales kpi dashboard new topics pdf. Use them to share invaluable insights on customer acquisition cost, customer lifetime value, average revenue and impress your audience. This template can be altered and modified as per your expectations. So, grab it now.
KPI Metrics Vector Icon Ppt PowerPoint Presentation Layouts Slide
This is a kpi metrics vector icon ppt powerpoint presentation layouts slide. This is a three stage process. The stages in this process are kpi proposal, kpi plan, kpi scheme.
Google Keyword Assessment KPI Dashboard For Tracking Improvement In Website Traffic Infographics PDF
Following slide demonstrates keyword analysis dashboard which can be used by business to track website traffic performance. It includes metrics such as average keyword position, keyword ranking distribution, keyword ranking, keyword in top 3, top 10, top 20 and top 100. Showcasing this set of slides titled Google Keyword Assessment KPI Dashboard For Tracking Improvement In Website Traffic Infographics PDF. The topics addressed in these templates are Keyword Ranking, Keyword Ranking Distribution, Average Keyword Position. All the content presented in this PPT design is completely editable. Download it and make adjustments in color, background, font etc. as per your unique business setting.

Business Coaching Plan Schedule With KPI And Duration Ppt PowerPoint Presentation Gallery Files PDF
Showcasing this set of slides titled business coaching plan schedule with kpi and duration ppt powerpoint presentation gallery files pdf. The topics addressed in these templates are performance, development, leadership. All the content presented in this PPT design is completely editable. Download it and make adjustments in color, background, font etc. as per your unique business setting.
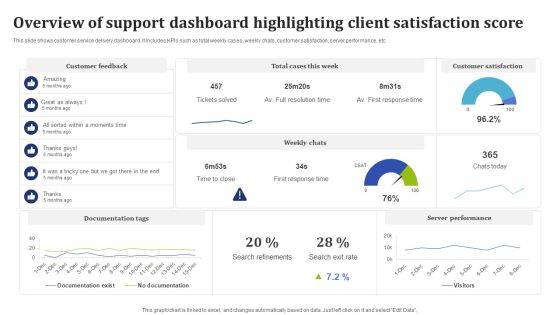
Overview Of Support Dashboard Highlighting Client Satisfaction Score Guidelines PDF
This slide shows customer service delivery dashboard. It includes KPIs such as total weekly cases, weekly chats, customer satisfaction, server performance, etc. Pitch your topic with ease and precision using this Overview Of Support Dashboard Highlighting Client Satisfaction Score Guidelines PDF. This layout presents information on Documentation Tags, Server Performance, Customer Satisfaction. It is also available for immediate download and adjustment. So, changes can be made in the color, design, graphics or any other component to create a unique layout.

Client Achievements Playbook Customer Success KPI Dashboard To Measure Support Brochure PDF
Mentioned slide showcases customer success dashboard that company is currently using to measure its support team performance. KPIs covered in the dashboard are health score, retention cost, churn rate etc. Deliver an awe inspiring pitch with this creative client achievements playbook customer success kpi dashboard to measure support brochure pdf bundle. Topics like customer retention cost, current health score, customer churn rate, customer accounts, customer health can be discussed with this completely editable template. It is available for immediate download depending on the needs and requirements of the user.

Client Success Playbook Customer Success KPI Dashboard To Measure Support Team Background PDF
Mentioned slide showcases customer success dashboard that company is currently using to measure its support team performance. KPIs covered in the dashboard are health score, retention cost, churn rate etc. Deliver an awe inspiring pitch with this creative Client Success Playbook Customer Success KPI Dashboard To Measure Support Team Background PDF bundle. Topics like Customer Retention Cost, Customer Churn Rate, Success Plays can be discussed with this completely editable template. It is available for immediate download depending on the needs and requirements of the user.

Business Kpi Dashboard Diagram Powerpoint Slides
This is a business kpi dashboard diagram powerpoint slides. This is a four stage process. The stages in this process are kpi tracking, activity planning, targeting, data management.

Execution Of Effective Paid Media Advertising Strategies Kpi Dashboard To Analyze Paid Marketing Campaigns Formats PDF
This slide showcases the parameters that would help the business organization to evaluate paid media marketing performance. It includes metrics such as cost per acquisition CPA, monthly conversion by channel, ad impressions, daily paid social clicks, etc. There are so many reasons you need a Execution Of Effective Paid Media Advertising Strategies Kpi Dashboard To Analyze Paid Marketing Campaigns Formats PDF. The first reason is you cannot spend time making everything from scratch, Thus, Slidegeeks has made presentation templates for you too. You can easily download these templates from our website easily.
KPI Metrics For SQA Ppt PowerPoint Presentation Icon Deck PDF
This slide shows the KPI metrics which can be used by an organization to measure the software quality. It includes passed test defects fixed per day, Average time to test, quality ratio, etc. Showcasing this set of slides titled KPI Metrics For SQA Ppt PowerPoint Presentation Icon Deck PDF. The topics addressed in these templates are Quality Ratio, Kpis, Passed Tests. All the content presented in this PPT design is completely editable. Download it and make adjustments in color, background, font etc. as per your unique business setting.
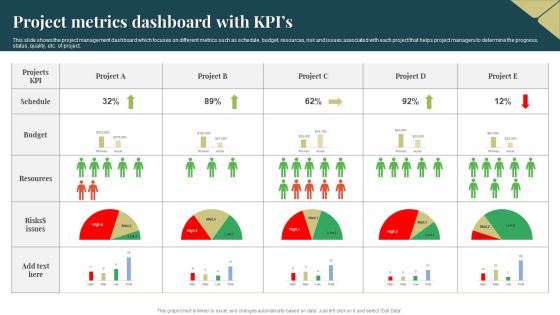
Project Metrics Dashboard With Kpis Ideas PDF
This slide shows the project management dashboard which focuses on different metrics such as schedule, budget, resources, risk and issues associated with each project that helps project managers to determine the progress, status, quality, etc. of project. Pitch your topic with ease and precision using this Project Metrics Dashboard With Kpis Ideas PDF. This layout presents information on Resources, Budget, Risks. It is also available for immediate download and adjustment. So, changes can be made in the color, design, graphics or any other component to create a unique layout.
Kpi Tracker Ppt Slides
This is a kpi tracker ppt slides. This is a three stage process. The stages in this process are total calls attempted, successful, no answer, call busy, disconnected, wrong number, unavailable, not interested, demo booked.
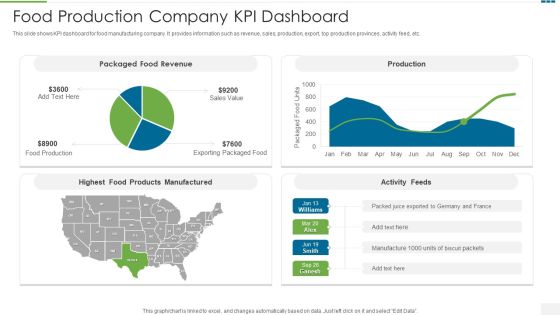
Food Production Company KPI Dashboard Formats PDF
This slide shows KPI dashboard for food manufacturing company. It provides information such as revenue, sales, production, export, top production provinces, activity feed, etc.Showcasing this set of slides titled food production company kpi dashboard formats pdf The topics addressed in these templates are food production company kpi dashboard All the content presented in this PPT design is completely editable. Download it and make adjustments in color, background, font etc. as per your unique business setting.

Client Solution Service Kpi Dashboard Sample PDF
This slide depicts service team KPI dashboard for providing customer solutions. It provides information about incoming cases, solutions provided, escalations, resolution time, case priority, etc. Showcasing this set of slides titled Client Solution Service Kpi Dashboard Sample PDF. The topics addressed in these templates are Client Solution Service KPI Dashboard. All the content presented in this PPT design is completely editable. Download it and make adjustments in color, background, font etc. as per your unique business setting
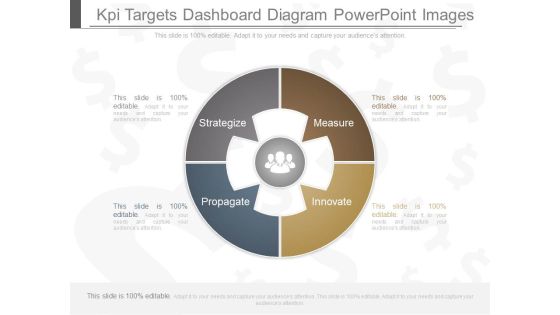
Kpi Targets Dashboard Diagram Powerpoint Images
This is a kpi targets dashboard diagram powerpoint images. This is a four stage process. The stages in this process are strategize, measure, propagate, innovate.

Kpi For Management Dashboard Diagram Powerpoint Guide
This is a kpi for management dashboard diagram powerpoint guide. This is a three stage process. The stages in this process are ceo, senior management, junior managers.

Customer Service Kpi Dashboard Powerpoint Ideas
This is a customer service kpi dashboard powerpoint ideas. This is a two stage process. The stages in this process are information desk, gift shop sales.

Business Kpi Dashboard Slide Powerpoint Presentation Templates
This is a business kpi dashboard slide powerpoint presentation templates. This is a four stage process. The stages in this process are sales, marketing, budget, people.

B2B Trade Management Ecommerce Management KPI Metrics Order Elements PDF
Presenting b2b trade management ecommerce management kpi metrics order elements pdf to provide visual cues and insights. Share and navigate important information on five stages that need your due attention. This template can be used to pitch topics like shopping cart conversion rate, shopping cart sessions, shopping cart abandoned, revenue per visitor, order value. In addtion, this PPT design contains high-resolution images, graphics, etc, that are easily editable and available for immediate download.
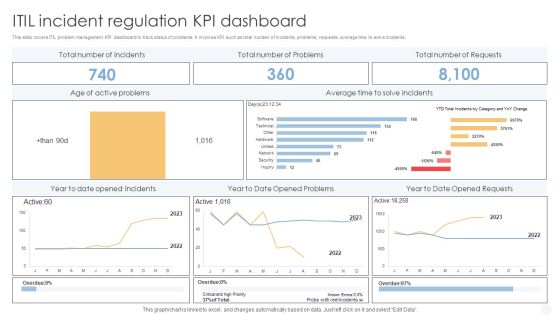
ITIL Incident Regulation Kpi Dashboard Background PDF
This slide covers ITIL problem management KPI dashboard to track status of problems. It involves KPI such as total number of incidents, problems, requests, average time to solve incidents.Pitch your topic with ease and precision using this ITIL Incident Regulation Kpi Dashboard Background PDF. This layout presents information on Active Problems, Average Incidents, Opened Problems. It is also available for immediate download and adjustment. So, changes can be made in the color, design, graphics or any other component to create a unique layout.

Retail Inventory Management Kpi Dashboard Rules PDF
This slide gives overview of inventory management in retail industry showcasing expected date of order placed for top selling item, sales return by product category, average inventory value in FY 2022 and purchase order summary. Pitch your topic with ease and precision using this Retail Inventory Management Kpi Dashboard Rules PDF. This layout presents information on Retail Inventory Management, Dashboard. It is also available for immediate download and adjustment. So, changes can be made in the color, design, graphics or any other component to create a unique layout.
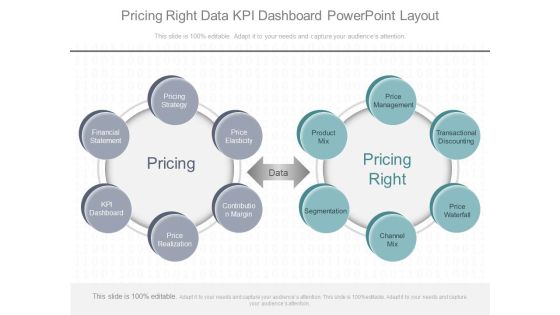
Pricing Right Data Kpi Dashboard Powerpoint Layout
This is a pricing right data kpi dashboard powerpoint layout. This is a two stage process. The stages in this process are price management, transactional discounting, price waterfall, channel mix, segmentation, product mix, price elasticity, contribution margin, price realization, kpi dashboard, financial statement, pricing, data, pricing right.
Manager Checking PMO KPI Dashboard Mockup PDF
Persuade your audience using this Manager Checking PMO KPI Dashboard Mockup PDF This PPT design covers three stages, thus making it a great tool to use. It also caters to a variety of topics including Manager Checking, Pmo Kpi Dashboard Download this PPT design now to present a convincing pitch that not only emphasizes the topic but also showcases your presentation skills.

Expert Systems Business Intelligence KPI Metrics Average Rules PDF
Presenting expert systems business intelligence kpi metrics average rules pdf to provide visual cues and insights. Share and navigate important information on four stages that need your due attention. This template can be used to pitch topics like business intelligence kpi metrics. In addtion, this PPT design contains high-resolution images, graphics, etc, that are easily editable and available for immediate download.
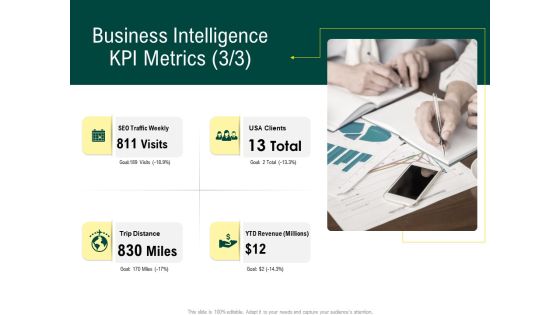
Expert Systems Business Intelligence KPI Metrics Usa Clients Pictures PDF
Presenting expert systems business intelligence kpi metrics usa clients pictures pdf to provide visual cues and insights. Share and navigate important information on four stages that need your due attention. This template can be used to pitch topics like business intelligence, kpi metrics. In addtion, this PPT design contains high-resolution images, graphics, etc, that are easily editable and available for immediate download.

Kpi Dashboard Ppt Powerpoint Slide Design Templates
This is a kpi dashboard ppt powerpoint slide design templates. This is a four stage process. The stages in this process are sales, new customer, budget, resource and task.
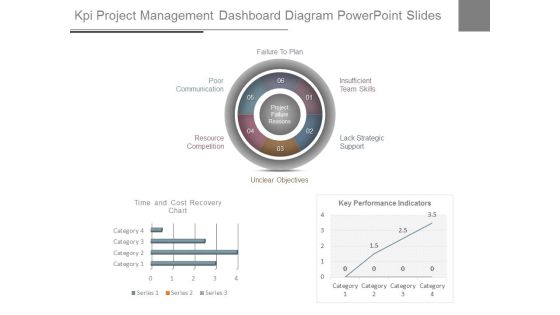
Kpi Project Management Dashboard Diagram Powerpoint Slides
This is a kpi project management dashboard diagram powerpoint slides. This is a three stage process. The stages in this process are unclear objectives, resource competition, poor communication, failure to plan, insufficient team skills, lack strategic support.

Project Kpi Sample Dashboard Diagram Powerpoint Images
This is a project kpi sample dashboard diagram powerpoint images. This is a four stage process. The stages in this process are costs thousands, employee names, burndown, project status.
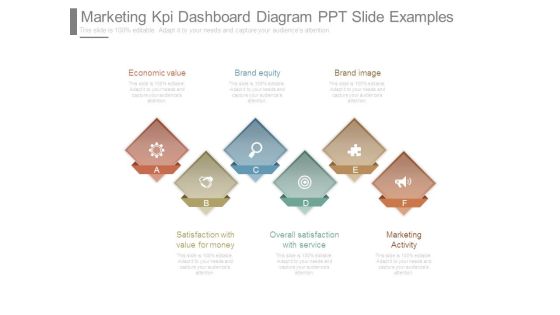
Marketing Kpi Dashboard Diagram Ppt Slide Examples
This is a marketing kpi dashboard diagram ppt slide examples. This is a six stage process. The stages in this process are economic value, satisfaction with value for money, brand equity, overall satisfaction with service, brand image, marketing activity.

Customer Need Assessment Kpi Dashboard Infographics PDF
The following slide highlights the spas to assess customers changing needs and make strategies to improve. It consists of NPS, responses, weekly variations in needs, positive and negative feedback etc. Showcasing this set of slides titled customer need assessment kpi dashboard infographics pdf. The topics addressed in these templates are customer need assessment kpi dashboard. All the content presented in this PPT design is completely editable. Download it and make adjustments in color, background, font etc. as per your unique business setting.

Warehouse Inventory Management KPI Dashboard Information PDF
This slide covers stock inventory management KPI dashboard. It involves details such as percentage of out of stock, inventory and cost, stock days of supply and product details. Showcasing this set of slides titled Warehouse Inventory Management KPI Dashboard Information PDF. The topics addressed in these templates are Inventory And Cost, Return Rate, Out Of Stock. All the content presented in this PPT design is completely editable. Download it and make adjustments in color, background, font etc. as per your unique business setting.
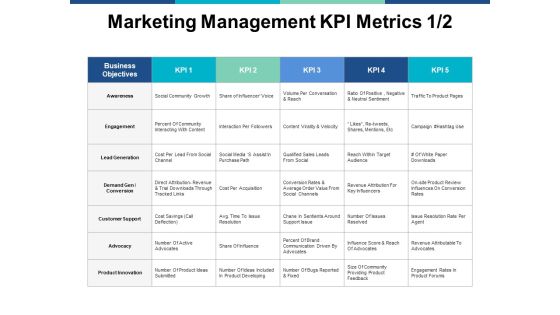
Marketing Management Kpi Metrics Business Ppt PowerPoint Presentation Show Shapes
This is a marketing management kpi metrics business ppt powerpoint presentation show shapes. This is a four stage process. The stages in this process are compare, marketing, business, management, planning.
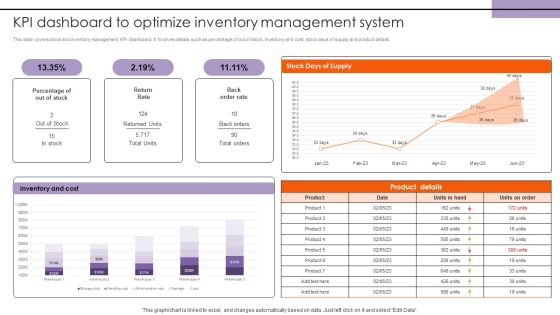
KPI Dashboard To Optimize Inventory Management System Structure PDF
This slide covers stock and inventory management KPI dashboard. It involves details such as percentage of out of stock, inventory and cost, stock days of supply and product details. This KPI Dashboard To Optimize Inventory Management System Structure PDF from Slidegeeks makes it easy to present information on your topic with precision. It provides customization options, so you can make changes to the colors, design, graphics, or any other component to create a unique layout. It is also available for immediate download, so you can begin using it right away. Slidegeeks has done good research to ensure that you have everything you need to make your presentation stand out. Make a name out there for a brilliant performance.
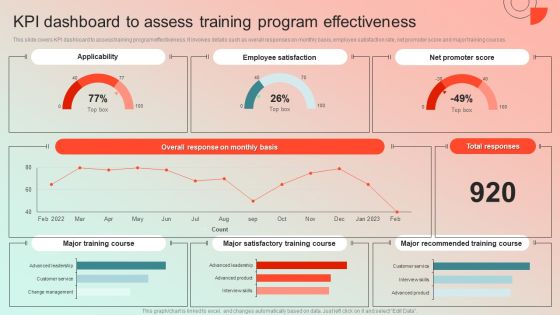
KPI Dashboard To Assess Training Program Effectiveness Background PDF
This slide covers KPI dashboard to assess training program effectiveness. It involves details such as overall responses on monthly basis, employee satisfaction rate, net promoter score and major training courses. This KPI Dashboard To Assess Training Program Effectiveness Background PDF from Slidegeeks makes it easy to present information on your topic with precision. It provides customization options, so you can make changes to the colors, design, graphics, or any other component to create a unique layout. It is also available for immediate download, so you can begin using it right away. Slidegeeks has done good research to ensure that you have everything you need to make your presentation stand out. Make a name out there for a brilliant performance.
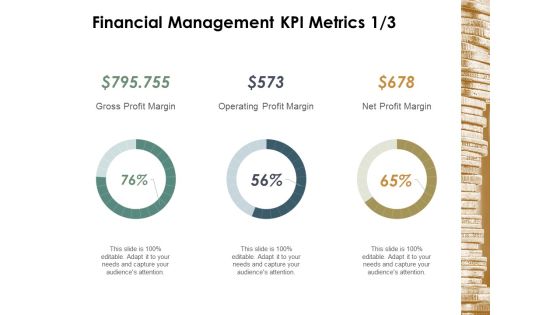
Financial Management Kpi Metrics Business Ppt Powerpoint Presentation Model Example
This is a financial management kpi metrics business ppt powerpoint presentation model example. This is a three stage process. The stages in this process are finance, marketing, management, investment, analysis.

Logistics Kpi Metrics Business Ppt PowerPoint Presentation Layouts Microsoft
This is a logistics kpi metrics business ppt powerpoint presentation layouts microsoft. This is a two stage process. The stages in this process are finance, marketing, management, investment, analysis.

Logistics Kpi Metrics Business Ppt PowerPoint Presentation Ideas Infographics
This is a logistics kpi metrics business ppt powerpoint presentation ideas infographics. This is a four stage process. The stages in this process are finance, marketing, management, investment, analysis.
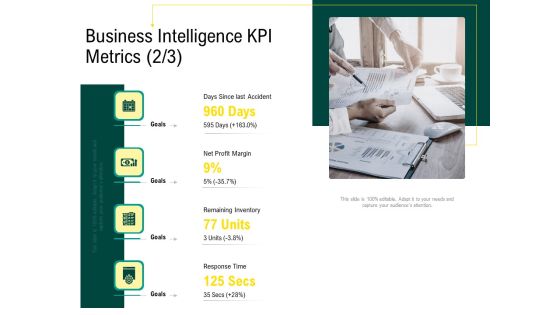
Expert Systems Business Intelligence KPI Metrics Goals Mockup PDF
This is a expert systems business intelligence kpi metrics goals mockup pdf template with various stages. Focus and dispense information on four stages using this creative set, that comes with editable features. It contains large content boxes to add your information on topics like business intelligence, kpi metrics. You can also showcase facts, figures, and other relevant content using this PPT layout. Grab it now.

Financial Management Kpi Metrics Business Ppt Powerpoint Presentation Styles Diagrams
This is a financial management kpi metrics business ppt powerpoint presentation styles diagrams. This is a four stage process. The stages in this process are finance, marketing, management, investment, analysis.
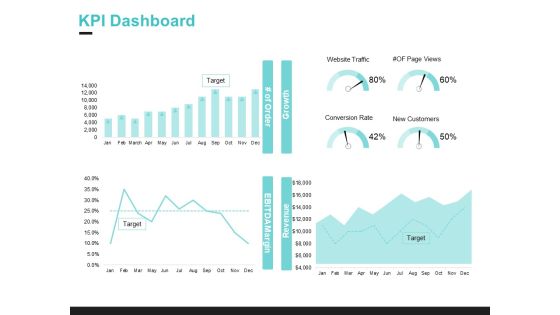
Inbound Marketing Proposal KPI Dashboard Designs PDF
Deliver and pitch your topic in the best possible manner with this inbound marketing proposal kpi dashboard designs pdf. Use them to share invaluable insights on target, growth, revenue and impress your audience. This template can be altered and modified as per your expectations. So, grab it now.
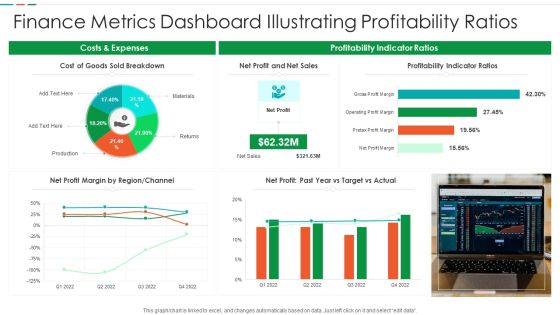
Finance Metrics Dashboard Illustrating Profitability Ratios Diagrams PDF
This graph or chart is linked to excel, and changes automatically based on data. Just left click on it and select edit data. Pitch your topic with ease and precision using this Finance Metrics Dashboard Illustrating Profitability Ratios Diagrams PDF. This layout presents information on Cost Goods Sold, Net Profit Net, Sales Profitability Indicator. It is also available for immediate download and adjustment. So, changes can be made in the color, design, graphics or any other component to create a unique layout.

Customer Journey Touchpoint Kpi Dashboard Slides PDF
This template covers touchpoint dashboard with different customer journey stages. It also includes detailed evaluation of each stage on the basis of experience, importance, etc. Showcasing this set of slides titled Customer Journey Touchpoint Kpi Dashboard Slides PDF. The topics addressed in these templates are Purchasing, Customer Service, Consumer Journey. All the content presented in this PPT design is completely editable. Download it and make adjustments in color, background, font etc. as per your unique business setting.
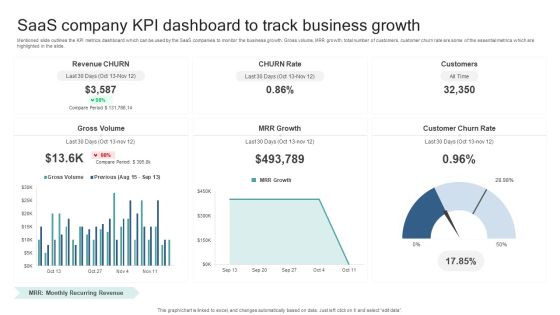
Saas Company KPI Dashboard To Track Business Growth Guidelines PDF
Mentioned slide outlines the KPI metrics dashboard which can be used by the SaaS companies to monitor the business growth. Gross volume, MRR growth, total number of customers, customer churn rate are some of the essential metrics which are highlighted in the slide. Showcasing this set of slides titled Saas Company KPI Dashboard To Track Business Growth Guidelines PDF. The topics addressed in these templates are Gross Volume, Mrr Growth, Customer Churn Rate. All the content presented in this PPT design is completely editable. Download it and make adjustments in color, background, font etc. as per your unique business setting.

Online Business Framework Ecommerce Management Kpi Metrics Profit Introduction PDF
Presenting online business framework ecommerce management kpi metrics profit introduction pdf to provide visual cues and insights. Share and navigate important information on one stages that need your due attention. This template can be used to pitch topics like customer, product, target. In addtion, this PPT design contains high resolution images, graphics, etc, that are easily editable and available for immediate download.
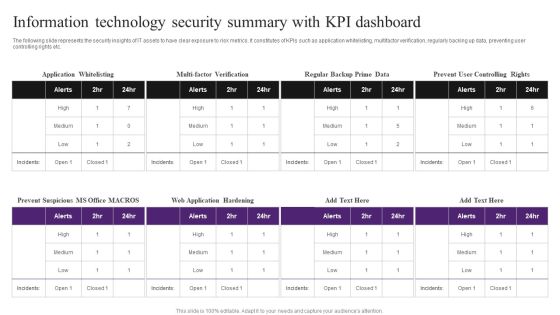
Information Technology Security Summary With KPI Dashboard Inspiration PDF
The following slide represents the security insights of IT assets to have clear exposure to risk metrics. It constitutes of KPIs such as application whitelisting, multifactor verification, regularly backing up data, preventing user controlling rights etc. Pitch your topic with ease and precision using this Information Technology Security Summary With KPI Dashboard Inspiration PDF. This layout presents information on Information Technology Security, Summary With KPI Dashboard. It is also available for immediate download and adjustment. So, changes can be made in the color, design, graphics or any other component to create a unique layout.
Project Error Tracking KPI Dashboard Themes PDF
This slide illustrates the dashboard for the project issue tracking and management. It includes the column chart for issues assignee, incomplete issues by priority and project, monthly percentage increase in issues created and closed, etc. Pitch your topic with ease and precision using this Project Error Tracking KPI Dashboard Themes PDF. This layout presents information on Issues Assignee, Issue Status, Incomplete Issues. It is also available for immediate download and adjustment. So, changes can be made in the color, design, graphics or any other component to create a unique layout.

Business Sales Productivity Kpis And Metrics Ppt PowerPoint Presentation Professional Microsoft PDF
Presenting this set of slides with name business sales productivity kpis and metrics ppt powerpoint presentation professional microsoft pdf. The topics discussed in these slides are new customer i ytd, average weekly sales revenue, above sales target i ytd, profit i ytd, monthly sales growth, sales country performance. This is a completely editable PowerPoint presentation and is available for immediate download. Download now and impress your audience.

Kpi Dashboard Best Practices For Project Management Ppt Powerpoint Presentation Outline Samples
This is a kpi dashboard best practices for project management ppt powerpoint presentation outline samples. This is a three stage process. The stages in this process are business metrics, business kpi, business dashboard.

Data Assimilation Business Intelligence KPI Metrics Miles Ppt Ideas PDF
Presenting data assimilation business intelligence kpi metrics miles ppt ideas pdf to provide visual cues and insights. Share and navigate important information on four stages that need your due attention. This template can be used to pitch topics like seo traffic weekly, trip distance, usa clients, ytd revenue . In addtion, this PPT design contains high resolution images, graphics, etc, that are easily editable and available for immediate download.
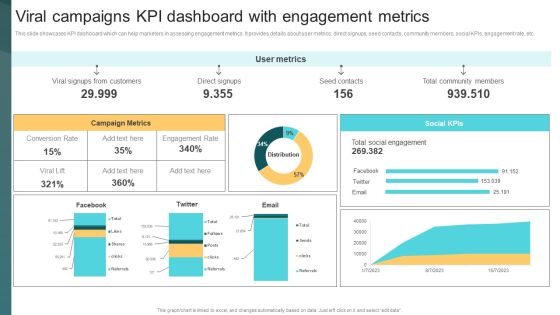
Viral Campaigns Kpi Dashboard With Engagement Metrics Deploying Viral Marketing Strategies Demonstration PDF
This slide showcases KPI dashboard which can help marketers in assessing engagement metrics. It provides details about user metrics, direct signups, seed contacts, community members, social KPIs, engagement rate, etc. Whether you have daily or monthly meetings, a brilliant presentation is necessary. Viral Campaigns Kpi Dashboard With Engagement Metrics Deploying Viral Marketing Strategies Demonstration PDF can be your best option for delivering a presentation. Represent everything in detail using Viral Campaigns Kpi Dashboard With Engagement Metrics Deploying Viral Marketing Strategies Demonstration PDF and make yourself stand out in meetings. The template is versatile and follows a structure that will cater to your requirements. All the templates prepared by Slidegeeks are easy to download and edit. Our research experts have taken care of the corporate themes as well. So, give it a try and see the results.
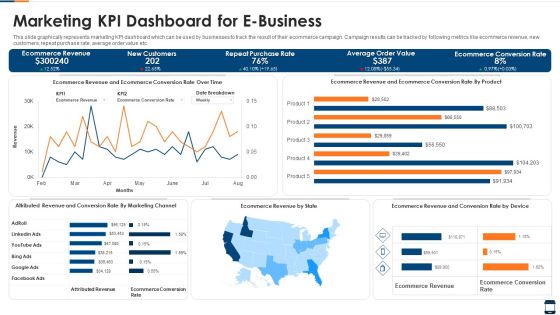
Marketing KPI Dashboard For E Business Brochure PDF
This slide graphically represents marketing KPI dashboard which can be used by businesses to track the result of their ecommerce campaign. Campaign results can be tracked by following metrics like ecommerce revenue, new customers, repeat purchase rate, average order value etc. Showcasing this set of slides titled marketing kpi dashboard for e business brochure pdf. The topics addressed in these templates are marketing kpi dashboard for e business. All the content presented in this PPT design is completely editable. Download it and make adjustments in color, background, font etc. as per your unique business setting.
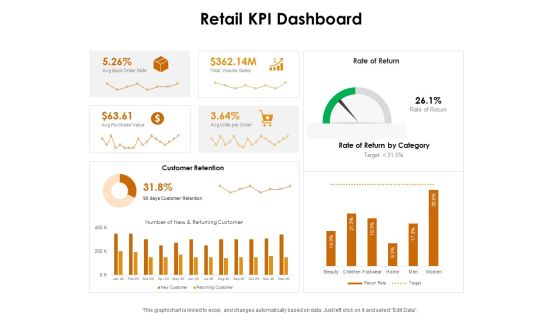
KPI Dashboards Per Industry Retail KPI Dashboard Ppt PowerPoint Presentation Slides Clipart PDF
Deliver an awe-inspiring pitch with this creative kpi dashboards per industry retail kpi dashboard ppt powerpoint presentation slides clipart pdf bundle. Topics like return reasons, top seller orders, perfect order rate, total orders can be discussed with this completely editable template. It is available for immediate download depending on the needs and requirements of the user.
Kpi And Dashboard Ppt PowerPoint Presentation Icon Template
This is a kpi and dashboard ppt powerpoint presentation icon template. This is a two stage process. The stages in this process are kpi dashboard, kpi metrics, management, marketing, strategy.

Dashboard Related To Logistic Company Electronics Ideas PDF
This slide shows the dashboard related to the ABC logistic company which includes order status, global financial performance, volume, inventory details, etc. Deliver an awe inspiring pitch with this creative dashboard related to logistic company electronics ideas pdf bundle. Topics like inventory, global financial performance, product can be discussed with this completely editable template. It is available for immediate download depending on the needs and requirements of the user.

Supply Chain Management Metrics With Order Status Ppt PowerPoint Presentation Layouts Graphics Design PDF
Presenting this set of slides with name supply chain management metrics with order status ppt powerpoint presentation layouts graphics design pdf. The topics discussed in these slides are global financial performance, inventory, orders, volume today, kpis monthly. This is a completely editable PowerPoint presentation and is available for immediate download. Download now and impress your audience.

Inbound Marketing Channel KPI Dashboard To Measure Brand Measurement Awareness Pictures PDF
Mentioned slide highlights a inbound marketing dashboard which can be used by managers to measure brand campaign performance. Information covered in this slide is related to total visits, page views, web mentions, social shares, inbound traffic to the company website etc. Pitch your topic with ease and precision using this inbound marketing channel kpi dashboard to measure brand measurement awareness pictures pdf. This layout presents information on inbound marketing channel kpi dashboard to measure brand measurement awareness. It is also available for immediate download and adjustment. So, changes can be made in the color, design, graphics or any other component to create a unique layout.
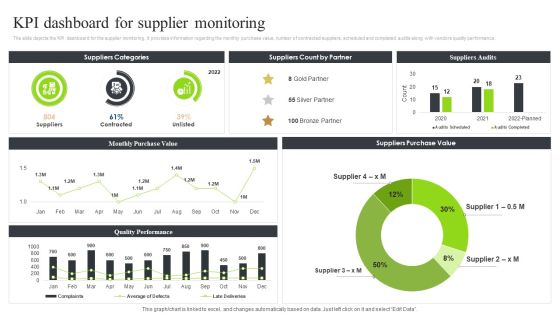
Strategic Sourcing And Supplier Quality Kpi Dashboard For Supplier Monitoring Graphics PDF
The slide depicts the KPI dashboard for the supplier monitoring. It provides information regarding the monthly purchase value, number of contracted suppliers, scheduled and completed audits along with vendors quality performance.Take your projects to the next level with our ultimate collection of Strategic Sourcing And Supplier Quality Kpi Dashboard For Supplier Monitoring Graphics PDF. Slidegeeks has designed a range of layouts that are perfect for representing task or activity duration, keeping track of all your deadlines at a glance. Tailor these designs to your exact needs and give them a truly corporate look with your own brand colors they all make your projects stand out from the rest.
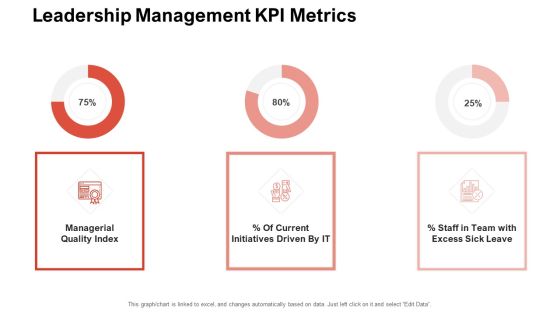
Team Manager Administration Leadership Management KPI Metrics Topics Pdf
Deliver an awe-inspiring pitch with this creative team manager administration leadership management kPI metrics topics pdf. bundle. Topics like staff team excess sick leave, managerial quality index, current initiatives driven by it can be discussed with this completely editable template. It is available for immediate download depending on the needs and requirements of the user
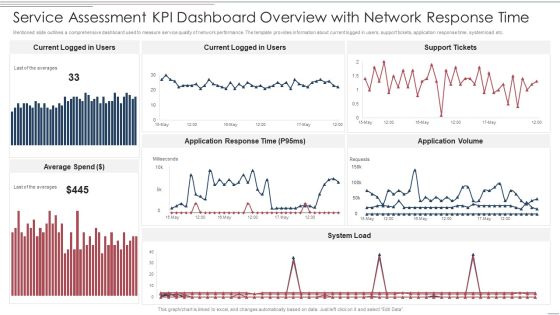
Service Assessment Kpi Dashboard Overview With Network Response Time Themes PDF
Mentioned slide outlines a comprehensive dashboard used to measure service quality of network performance. The template provides information about current logged in users, support tickets, application response time, system load etc. Pitch your topic with ease and precision using this Service Assessment Kpi Dashboard Overview With Network Response Time Themes PDF. This layout presents information on Average Spend, System Load, Application Response Time. It is also available for immediate download and adjustment. So, changes can be made in the color, design, graphics or any other component to create a unique layout.

Revolutionizing Customer Support Through Digital Transformation KPI Dashboard To Measure Customer Elements PDF
This slide represents dashboard to measure customer service performance. It includes number of issues, average time to close, average response time etc. Take your projects to the next level with our ultimate collection of Revolutionizing Customer Support Through Digital Transformation KPI Dashboard To Measure Customer Elements PDF. Slidegeeks has designed a range of layouts that are perfect for representing task or activity duration, keeping track of all your deadlines at a glance. Tailor these designs to your exact needs and give them a truly corporate look with your own brand colors they will make your projects stand out from the rest.
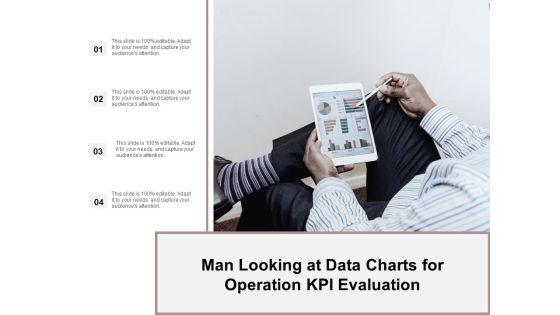
Man Looking At Data Charts For Operation Kpi Evaluation Ppt Powerpoint Presentation Ideas Demonstration
This is a man looking at data charts for operation kpi evaluation ppt powerpoint presentation ideas demonstration. This is a four stage process. The stages in this process are business metrics, business kpi, business dashboard.

Business Metrics Pyramid To Guide Devops Initiative Summary PDF
The slide showcases a metric oriented framework to guide the companys DevOps initiatives and helps in measuring efficiency, quality, and velocity in order to accomplish a true DevOps transformation. It covers business performance, customer value, organizational effectiveness, service quality, service velocity and operational efficiency. Presenting Business Metrics Pyramid To Guide Devops Initiative Summary PDF to dispense important information. This template comprises six stages. It also presents valuable insights into the topics including Business Performance, Customer Value, Organizational Effectiveness. This is a completely customizable PowerPoint theme that can be put to use immediately. So, download it and address the topic impactfully.
KPI Metrics Marketing Ppt PowerPoint Presentation Inspiration File Formats Cpb
This is a kpi metrics marketing ppt powerpoint presentation inspiration file formats cpb. This is a two stage process. The stages in this process are kpi metrics marketing.
KPI Metrics Examples Ppt PowerPoint Presentation Outline Show Cpb
This is a kpi metrics examples ppt powerpoint presentation outline show cpb. This is a four stage process. The stages in this process are kpi metrics examples.
KPI Metrics Template Ppt PowerPoint Presentation Pictures Introduction Cpb
This is a kpi metrics template ppt powerpoint presentation pictures introduction cpb. This is a six stage process. The stages in this process are kpi metrics template.

Agile QA Procedure Quality Control Kpi Dashboard Topics PDF
This slide shows the quality control dashboard to monitor the effectiveness of agile quality assurance model. It includes KPIs namely test execution summary, defect severity distribution, module wise text execution and defect severity index. Deliver an awe inspiring pitch with this creative agile qa procedure quality control kpi dashboard topics pdf bundle. Topics like quality control kpi dashboard can be discussed with this completely editable template. It is available for immediate download depending on the needs and requirements of the user.
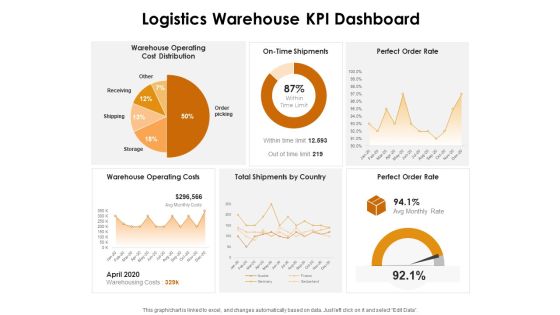
KPI Dashboards Per Industry Logistics Warehouse KPI Dashboard Ppt PowerPoint Presentation Inspiration Skills PDF
Deliver and pitch your topic in the best possible manner with this kpi dashboards per industry logistics warehouse kpi dashboard ppt powerpoint presentation inspiration skills pdf. Use them to share invaluable insights on warehouse operating cost distribution, time shipments, perfect order rate, warehouse operating costs, total shipments country, perfect order rate and impress your audience. This template can be altered and modified as per your expectations. So, grab it now.
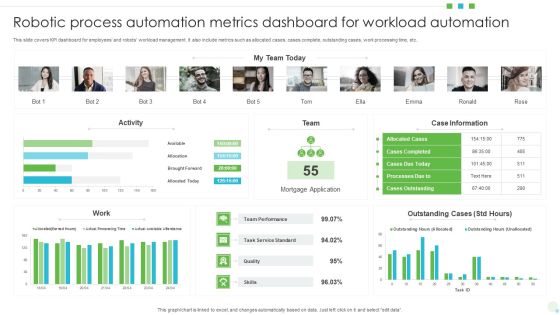
Robotic Process Automation Metrics Dashboard For Workload Automation Mockup PDF
This slide covers KPI dashboard for employees and robots workload management. It also include metrics such as allocated cases, cases complete, outstanding cases, work processing time, etc. Pitch your topic with ease and precision using this Robotic Process Automation Metrics Dashboard For Workload Automation Mockup PDF. This layout presents information on Mortgage Application, Team Performance, Case Information. It is also available for immediate download and adjustment. So, changes can be made in the color, design, graphics or any other component to create a unique layout.

Inventory Metrics Carrying Cost Order Inventory Delivered Unit Costs Ppt Powerpoint Presentation Layouts Guidelines
This is a inventory metrics carrying cost order inventory delivered unit costs ppt powerpoint presentation layouts guidelines. This is a two stage process. The stages in this process are availability kpi, availability dashboard, availability metrics.
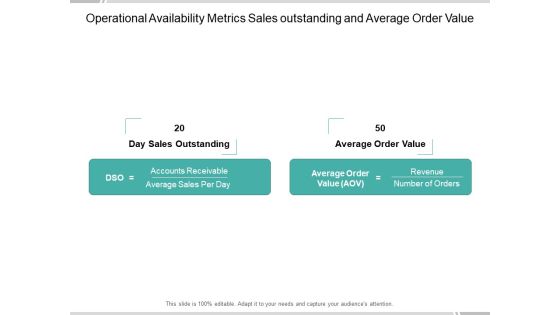
Operational Availability Metrics Sales Outstanding And Average Order Value Ppt Powerpoint Presentation Infographic Template Introduction
This is a operational availability metrics sales outstanding and average order value ppt powerpoint presentation infographic template introduction. This is a two stage process. The stages in this process are availability kpi, availability dashboard, availability metrics.

Dashboard Related To Application Programming Interface Ppt Model Example PDF
This slide shows the dashboard related to API Application Program Interface Implementation which includes Name, Status, Performance, Uptime etc. Deliver an awe-inspiring pitch with this creative dashboard related to application programming interface ppt model example pdf bundle. Topics like status, performance, actions, last run can be discussed with this completely editable template. It is available for immediate download depending on the needs and requirements of the user.

Data Requirements For Analytics Dashboard For Email Marketing Mockup PDF
This slide shows dashboard for data requirement analysis of email marketing. It includes components such as subscribers growth, web and email performance. Showcasing this set of slides titled data requirements for analytics dashboard for email marketing mockup pdf. The topics addressed in these templates are growth, performance. All the content presented in this PPT design is completely editable. Download it and make adjustments in color, background, font etc. as per your unique business setting.

Decentralized Applications IT Dashboard For Dapp Development Topics PDF
This slide depicts the dashboard for dApp development based on the portfolio performance, recent activities, assets, deposits, and so on. Deliver an awe inspiring pitch with this creative Decentralized Applications IT Dashboard For Dapp Development Topics PDF bundle. Topics like Portfolio Performance, Marketplace, Deposit can be discussed with this completely editable template. It is available for immediate download depending on the needs and requirements of the user.

Dashboard To Evaluate Effectiveness Of Affiliate Marketing Program Background PDF
This slide covers dashboard to track affiliate marketing program performance. It involves details such as affiliate licenses, solution licenses and program performance. Find a pre-designed and impeccable Dashboard To Evaluate Effectiveness Of Affiliate Marketing Program Background PDF. The templates can ace your presentation without additional effort. You can download these easy-to-edit presentation templates to make your presentation stand out from others. So, what are you waiting for Download the template from Slidegeeks today and give a unique touch to your presentation.
Kpis For Tracking Fleet Information Effectively Icons PDF
This slide showcases factors which fleet data needs to keep track of. This template focuses on increasing uptime and improving conditions for their mobile workforce. It includes information related to vehicle performance, safety behaviour, etc. Persuade your audience using this Kpis For Tracking Fleet Information Effectively Icons PDF. This PPT design covers four stages, thus making it a great tool to use. It also caters to a variety of topics including Predictive Safety Behavior, Vehicle Performance, Inspection Maintenance. Download this PPT design now to present a convincing pitch that not only emphasizes the topic but also showcases your presentation skills.

Business Diagram Sentiment Analysis From Different Social Media Feeds Ppt Slide
This diagram has been designed with graphic of funnel diagram displaying multiple icons of social media. These icons may be used to display social media sentiment analysis. Use this diagram slide for social media related presentations.
Ecommerce Management KPI Metrics Ppt Icon Graphics Example PDF
Deliver and pitch your topic in the best possible manner with this ecommerce management kpi metrics ppt icon graphics example pdf. Use them to share invaluable insights on average order value, gross profit margin, coupon conversion and impress your audience. This template can be altered and modified as per your expectations. So, grab it now.
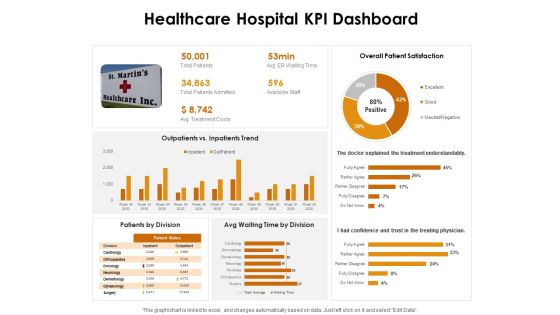
KPI Dashboards Per Industry Healthcare Hospital KPI Dashboard Ppt PowerPoint Presentation Show Infographics PDF
Deliver an awe-inspiring pitch with this creative kpi dashboards per industry healthcare hospital kpi dashboard ppt powerpoint presentation show infographics pdf bundle. Topics like overall patient satisfaction, outpatients vs. inpatients trend, doctor explained the treatment understandably can be discussed with this completely editable template. It is available for immediate download depending on the needs and requirements of the user.

Marketing Management Kpi Metrics Planning Ppt PowerPoint Presentation Model Graphics
This is a marketing management kpi metrics planning ppt powerpoint presentation model graphics. The topics discussed in this diagram are marketing, business, management, planning, strategy This is a completely editable PowerPoint presentation, and is available for immediate download.

Customer Retention Kpis Lifetime Value And Acquisition Cost Ppt Powerpoint Presentation Model Samples
This is a customer retention kpis lifetime value and acquisition cost ppt powerpoint presentation model samples. This is a five stage process. The stages in this process are dashboard, kpi, metrics.

Customer Service Kpis Satisfied Customers And Churn Rate Ppt Powerpoint Presentation Pictures Template
This is a customer service kpis satisfied customers and churn rate ppt powerpoint presentation pictures template. This is a four stage process. The stages in this process are dashboard, kpi, metrics.

Kpis For Measuring Brand Marketing Communication Potential Share Ppt Powerpoint Presentation Layouts Infographics
This is a kpis for measuring brand marketing communication potential share ppt powerpoint presentation layouts infographics. This is a six stage process. The stages in this process are dashboard, kpi, metrics.
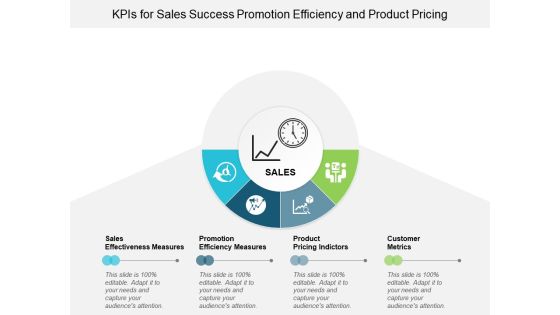
Kpis For Sales Success Promotion Efficiency And Product Pricing Ppt Powerpoint Presentation Infographics Background Images
This is a kpis for sales success promotion efficiency and product pricing ppt powerpoint presentation infographics background images. This is a four stage process. The stages in this process are dashboard, kpi, metrics.
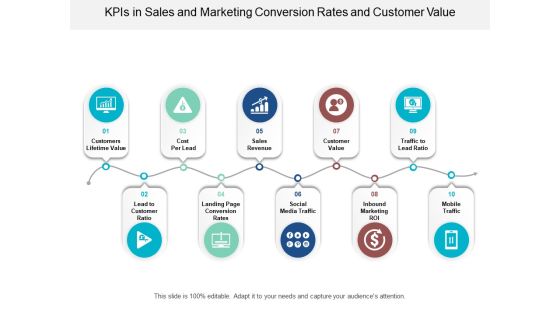
Kpis In Sales And Marketing Conversion Rates And Customer Value Ppt Powerpoint Presentation File Information
This is a kpis in sales and marketing conversion rates and customer value ppt powerpoint presentation file information. This is a ten stage process. The stages in this process are dashboard, kpi, metrics.
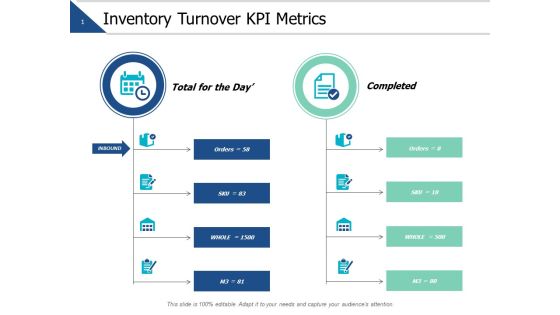
Inventory Turnover Kpi Metrics Ppt PowerPoint Presentation Summary File Formats
This is a inventory turnover kpi metrics ppt powerpoint presentation summary file formats. This is a five stage process. The stages in this process are marketing, business, management, planning, strategy.

Inventory Turnover Kpi Metrics Ppt PowerPoint Presentation Summary Master Slide
This is a inventory turnover kpi metrics ppt powerpoint presentation summary master slide. This is a two stage process. The stages in this process are marketing, business, management, compare.

B2B Lead Generation KPI Metrics Settled Infographics PDF
Deliver an awe inspiring pitch with this creative b2b lead generation kpi metrics settled infographics pdf bundle. Topics like kpi metrics can be discussed with this completely editable template. It is available for immediate download depending on the needs and requirements of the user.
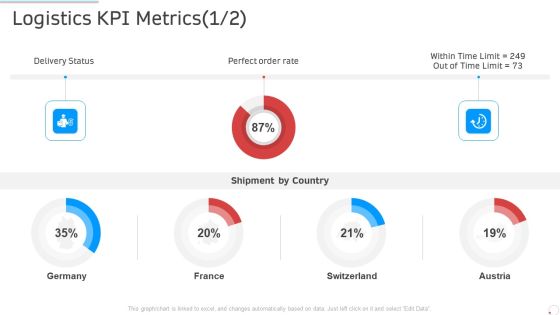
Logistics Kpi Metrics Austria Manufacturing Control Ppt Visuals PDF
Deliver an awe inspiring pitch with this creative logistics kpi metrics austria manufacturing control ppt visuals pdf bundle. Topics like logistics kpi metrics can be discussed with this completely editable template. It is available for immediate download depending on the needs and requirements of the user.

Project Status Kpi Metrics Manufacturing Control Ppt Ideas Portrait PDF
Deliver and pitch your topic in the best possible manner with this project status kpi metrics manufacturing control ppt ideas portrait pdf. Use them to share invaluable insights on project status kpi metrics and impress your audience. This template can be altered and modified as per your expectations. So, grab it now.

Ecommerce Management KPI Metrics Rate Ppt Infographic Template Shapes PDF
Presenting ecommerce management kpi metrics rate ppt infographic template shapes pdf to provide visual cues and insights. Share and navigate important information on five stages that need your due attention. This template can be used to pitch topics like average order value, target, revenue. In addition, this PPT design contains high-resolution images, graphics, etc, that are easily editable and available for immediate download.
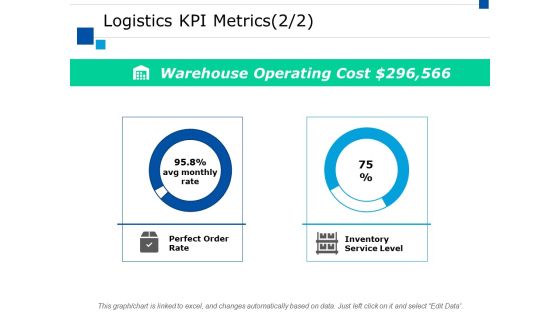
Logistics Kpi Metrics Ppt PowerPoint Presentation Inspiration Gridlines
This is a logistics kpi metrics ppt powerpoint presentation inspiration gridlines. This is a two stage process. The stages in this process are finance, marketing, management, investment, analysis.

Capital Investment Options Vendor Compliance Kpi Dashboard Designs PDF
Mentioned slide displays vendor compliance KPI dashboard. KPIs covered are top supplier by partner status, average procurement cycle time and average procurement cycle. Deliver an awe inspiring pitch with this creative Capital Investment Options Vendor Compliance Kpi Dashboard Designs PDF bundle. Topics like Average Procurement, Cycle Time, Confirmation, Order Placement can be discussed with this completely editable template. It is available for immediate download depending on the needs and requirements of the user.
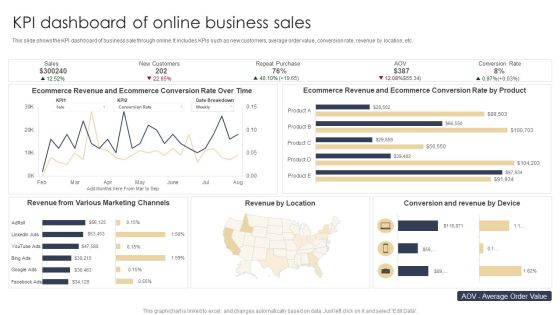
KPI Dashboard Of Online Business Sales Microsoft PDF
This slide shows the KPI dashboard of business sale through online. It includes KPIs such as new customers, average order value, conversion rate, revenue by location, etc. Showcasing this set of slides titled KPI Dashboard Of Online Business Sales Microsoft PDF. The topics addressed in these templates are Marketing Channels, Revenue, Location. All the content presented in this PPT design is completely editable. Download it and make adjustments in color, background, font etc. as per your unique business setting.

Kpi Management Strategy Tool Diagram Powerpoint Sample Download
This is a kpi management strategy tool diagram powerpoint sample download. This is a one stage process. The stages in this process are kpi management operation manual, strategy map.

B2B Lead Generation KPI Metrics Products Clipart PDF
Presenting b2b lead generation kpi metrics products clipart pdf to provide visual cues and insights. Share and navigate important information on four stages that need your due attention. This template can be used to pitch topics like kpi metrics. In addtion, this PPT design contains high resolution images, graphics, etc, that are easily editable and available for immediate download.

B2B Lead Generation KPI Metrics Social Ppt Ideas Example PDF
This is a b2b lead generation kpi metrics social ppt ideas example pdf template with various stages. Focus and dispense information on one stages using this creative set, that comes with editable features. It contains large content boxes to add your information on topics like kpi metrics. You can also showcase facts, figures, and other relevant content using this PPT layout. Grab it now.
 Home
Home