Key Performance Indicators
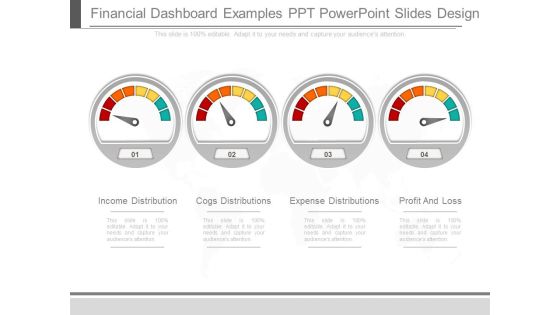
Financial Dashboard Examples Ppt Powerpoint Slides Design
This is a financial dashboard examples ppt powerpoint slides design. This is a four stage process. The stages in this process are income distribution, cogs distributions, expense distributions, profit and loss.

Manufacturing Dashboard Examples Ppt Slide Show
This is a manufacturing dashboard examples ppt slide show. This is a five stage process. The stages in this process are units per hour, effective rate, units until, time unit, status information.
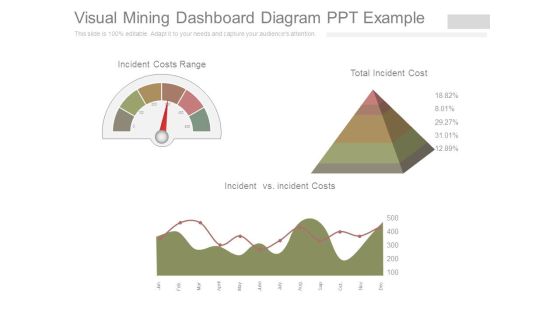
Visual Mining Dashboard Diagram Ppt Example
This is a visual mining dashboard diagram ppt example. This is a three stage process. The stages in this process are incident costs range, incident vs incident costs, total incident cost.

Business Object Dashboard Slide Good Ppt Example
This is a business object dashboard slide good ppt example. This is a seven stage process. The stages in this process are engineering, construction, finance, environment, safety, operations, maintenance.

Executive Dashboards Systems Example Of Ppt Presentation
This is a executive dashboards systems example of ppt presentation. This is a five stage process. The stages in this process are schedule management, resource management, document management, inventory management, meeting management.

Dashboards For Lead Scoring Powerpoint Topics
This is a dashboards for lead scoring powerpoint topics. This is a four stage process. The stages in this process are number of scoring rules, projects completed, adoption of lead scoring solutions chosen, number of dimensions.

Financial Highlights Growth Analysis Dashboard Powerpoint Slide
This is a financial highlights growth analysis dashboard powerpoint slide. This is a four stage process. The stages in this process are profit and loss, sales, operating expenses, operating income, net income, profitability.

Finance Dashboard Ppt PowerPoint Presentation Design Ideas
This is a finance dashboard ppt powerpoint presentation design ideas. This is a two stage process. The stages in this process are sales, operating expenses, operating income, net income.

Finance Dashboard Ppt PowerPoint Presentation Diagrams
This is a finance dashboard ppt powerpoint presentation diagrams. This is a four stage process. The stages in this process are increased efficiency, better business decision making, improved customer experience and engagement, achieved financial savings.
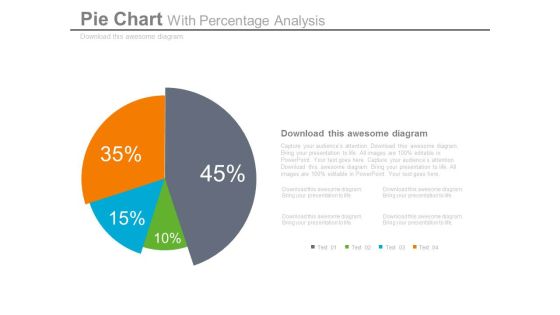
Pie Chart Dashboard Style For Percentage Analysis Powerpoint Slides
This dashboard PPT template contains graphics of pie chart. This dashboard PowerPoint template helps to display percentage analysis in a visual manner. Download this PPT slide for quick decision-making.

70 Dashboard Business Management Ppt PowerPoint Presentation Model Portfolio
This is a 70 dashboard business management ppt powerpoint presentation model portfolio. This is a four stage process. The stages in this process are dashboard, business, marketing, management, planning.

Dashboard Measuring Management Ppt PowerPoint Presentation Icon Background Designs
This is a dashboard measuring management ppt powerpoint presentation icon background designs. This is a three stage process. The stages in this process are dashboard, business, management, planning, strategy.

Creating Customer Personas For Customizing Customer Assessment Metrics On Company Structure PDF
This slide showcases various KPIs to analyze customers based on corporate level for evaluating customer overall experience with business. It showcases metrics such as overall customer satisfaction score, net promoter score, customer retention rate, customer acquisition cost, time to resolution, most common feedback, etc. There are so many reasons you need a Creating Customer Personas For Customizing Customer Assessment Metrics On Company Structure PDF. The first reason is you can not spend time making everything from scratch, Thus, Slidegeeks has made presentation templates for you too. You can easily download these templates from our website easily.

Saas Go To Market Strategy Analysis With Common Marketplace Metrics Brochure PDF
The slide includes a comparative analysis of the SaaS business model by using common marketplace metrics. Various KPIs involved are supply value proposition, payment, customer service, cost and refund policy. Pitch your topic with ease and precision using this Saas Go To Market Strategy Analysis With Common Marketplace Metrics Brochure PDF. This layout presents information on Customer Service, Payment, Liquidity. It is also available for immediate download and adjustment. So, changes can be made in the color, design, graphics or any other component to create a unique layout.

Empty Funds Finance PowerPoint Template 0610
Cash gauge on the dashboard approaching empty value

Four Steps Circular Infographic Powerpoint Slides
This innovative, stunningly beautiful dashboard has been designed for data visualization. It contains circular infographic design. This PowerPoint template helps to display your information in a useful, simple and orderly way.

Stopwatch For Speed Calculation Powerpoint Slides
This innovative, stunningly beautiful dashboard has been designed for speed calculation. It contains graphics of stopwatch. This PowerPoint template helps to display your information in a useful, simple and orderly way.
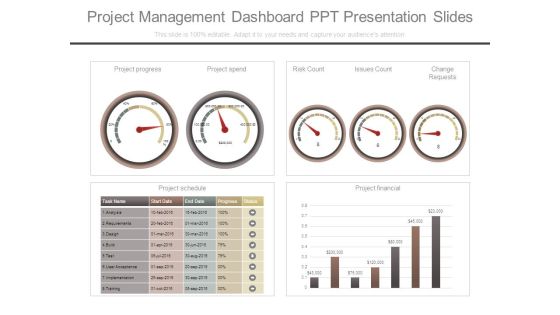
Project Management Dashboard Ppt Presentation Slides
This is a project management dashboard ppt presentation slides. This is a four stage process. The stages in this process are project progress, project spend, risk count, issues count, change requests, project schedule, project financial, task name, start date, end date, progress, status, analysis, requirements, design, build, test, user acceptance, implementation, training.

Digital Dashboard Resource Kit Ppt Powerpoint Slides Design
This is a digital dashboard resource kit ppt powerpoint slides design. This is a four stage process. The stages in this process are sales rate, progress, profits, safety.

High Low Risk Level Dashboard Powerpoint Slide Clipart
This is a high low risk level dashboard powerpoint slide clipart. This is a three stage process. The stages in this process are high, medium, low.

Dashboard For Risk Tolerance Levels Ppt Samples Download
This is a dashboard for risk tolerance levels ppt samples download. This is a three stage process. The stages in this process are low, middle, high, risk.

Dashboard For Risk Tolerance Analysis Good Ppt Example
This is a dashboard for risk tolerance analysis good ppt example. This is a three stage process. The stages in this process are low, medium, high, risk.

Dashboard For Product Quality Ppt PowerPoint Presentation Ideas
This is a dashboard for product quality ppt powerpoint presentation ideas. This is a five stage process. The stages in this process are bad, poor, average, good, excellent.

Creating Customer Personas For Customizing Customer Assessment Metrics On Individual Pictures PDF
This slide showcases various KPIs to analyze customers based on individual level for evaluating customer. It showcases metrics such as overall customer lifetime value, customer engagement, purchase frequency, average order value, customer segmentation, churn rate, customer feedback, demographic information and purchase history. Do you have to make sure that everyone on your team knows about any specific topic I yes, then you should give Creating Customer Personas For Customizing Customer Assessment Metrics On Individual Pictures PDF a try. Our experts have put a lot of knowledge and effort into creating this impeccable Creating Customer Personas For Customizing Customer Assessment Metrics On Individual Pictures PDF. You can use this template for your upcoming presentations, as the slides are perfect to represent even the tiniest detail. You can download these templates from the Slidegeeks website and these are easy to edit. So grab these today.
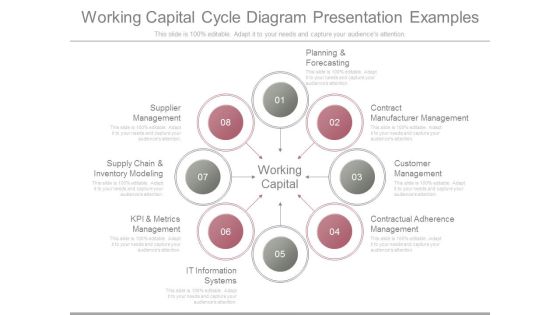
Working Capital Cycle Diagram Presentation Examples
This is a working capital cycle diagram presentation examples. This is a eight stage process. The stages in this process are planning and forecasting, contract manufacturer management, customer management, contractual adherence management, it information systems, kpi and metrics management, supply chain and inventory modeling, supplier management.
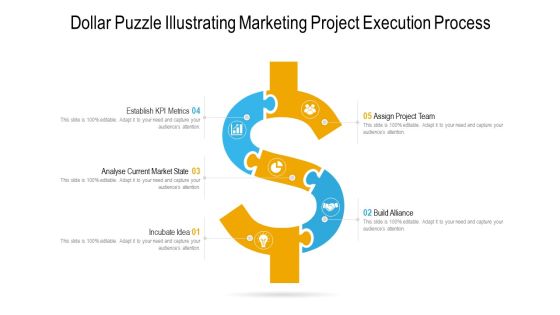
Dollar Puzzle Illustrating Marketing Project Execution Process Ppt PowerPoint Presentation Gallery Ideas PDF
Presenting dollar puzzle illustrating marketing project execution process ppt powerpoint presentation gallery ideas pdf. to dispense important information. This template comprises five stages. It also presents valuable insights into the topics including establish kpi metrics, analyse current market state, incubate idea. This is a completely customizable PowerPoint theme that can be put to use immediately. So, download it and address the topic impactfully.

Dashboard Meausrement Ppt PowerPoint Presentation Portfolio Visual Aids
Presenting this set of slides with name dashboard meausrement ppt powerpoint presentation portfolio visual aids. This is a stage process. The stages in this process are dashboard, marketing, management, investment, analysis. This is a completely editable PowerPoint presentation and is available for immediate download. Download now and impress your audience.

Metric To Measure Diversity Equity And Inclusion For Organization Elements PDF
This slide highlights various diversity and inclusion KPIs which help understand expertise and track the right metric to drive change. It provides information regarding recruitment, retention, advancement, representation and pay. Persuade your audience using this Metric To Measure Diversity Equity And Inclusion For Organization Elements PDF. This PPT design covers five stages, thus making it a great tool to use. It also caters to a variety of topics including Recruitment, Advancement, Representation. Download this PPT design now to present a convincing pitch that not only emphasizes the topic but also showcases your presentation skills.
Shipping Error Rate Tracking Metrics Tracker Structure PDF
This slide illustrates an order tracker to determine shipment delivery rate error. It also includes the details such as order id, shipping date, delivery status, etc. Showcasing this set of slides titled Shipping Error Rate Tracking Metrics Tracker Structure PDF. The topics addressed in these templates are Shipment Date, Successful Delivery, Error Type. All the content presented in this PPT design is completely editable. Download it and make adjustments in color, background, font etc. as per your unique business setting.

Dashboard Diagram For Finance And Strategic Analysis Powerpoint Slides
This PowerPoint template display graphics of clock with arrows around it and dollar symbol in center. You may use this PPT slide for financial and strategic analysis. This dashboard slide may useful for multilevel status report creation and approval process.

Alarm Clock Dashboard Design For Time Management Powerpoint Slides
This PowerPoint template has been designed with graphics of alarm clock. You may use this dashboard slide design for topics like time management. This PPT slide is powerful tool to describe your ideas.
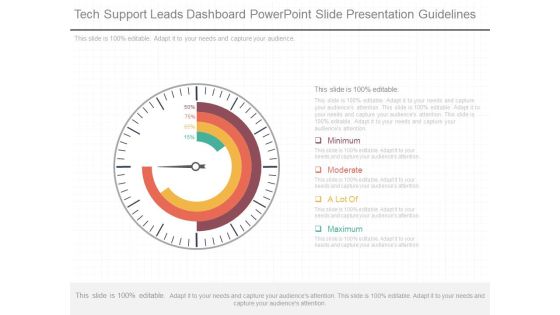
Tech Support Leads Dashboard Powerpoint Slide Presentation Guidelines
This is a tech support leads dashboard powerpoint slide presentation guidelines. This is a four stage process. The stages in this process are minimum, moderate, a lot of, maximum.

Bi Dashboard Design For Solutions Ppt Powerpoint Slides
This is a bi dashboard design for solutions ppt powerpoint slides. This is a four stage process. The stages in this process are total understand, total brands, total revenue, total sales.

Daily Executive Dashboards For Web Ppt Presentation Ideas
This is a daily executive dashboards for web ppt presentation ideas. This is a six stage process. The stages in this process are homepage, login, purchase ticket, email confirmation, ecommerce website, revenue per minute.

Dashboard Design And Development For Travel Diagram Background
This is a dashboard design and development for travel diagram background. This is a five stage process. The stages in this process are number of trips, sales, delayed flights, regional load, flight expense.

Dashboards For Effective Business Administration Powerpoint Slide Influencers
This is a dashboards for effective business administration powerpoint slide influencers. This is a four stage process. The stages in this process are customer, internal business processes, financial, learning and growth.
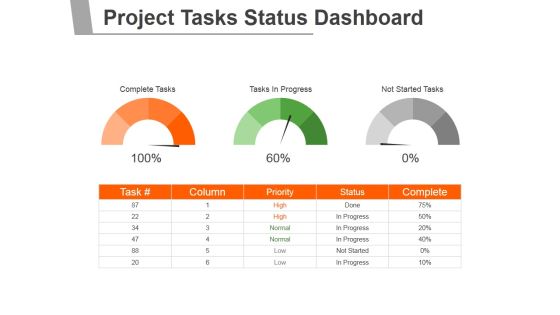
Project Tasks Status Dashboard Ppt PowerPoint Presentation Backgrounds
This is a project tasks status dashboard ppt powerpoint presentation backgrounds. This is a two stage process. The stages in this process are complete tasks, tasks in progress, not started tasks.
Project Tasks Status Dashboard Ppt PowerPoint Presentation File Graphics Download
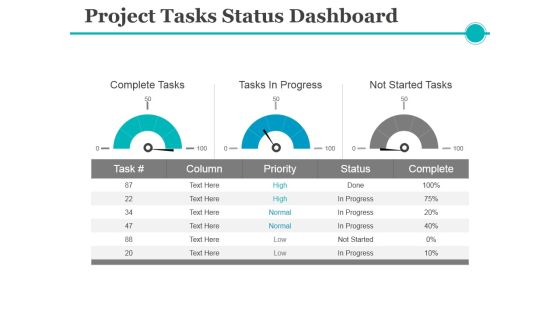
This is a project tasks status dashboard ppt powerpoint presentation file graphics download. This is a three stage process. The stages in this process are complete tasks, tasks in progress, not started tasks.
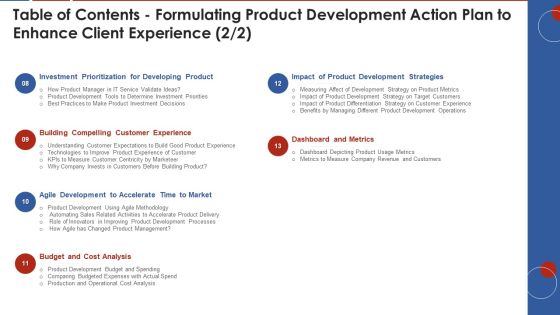
Table Of Contents Formulating Product Development Action Plan To Enhance Client Experience Metrics Themes PDF
Deliver and pitch your topic in the best possible manner with this table of contents formulating product development action plan to enhance client experience metrics themes pdf. Use them to share invaluable insights on investment prioritization, agile development, cost analysis, dashboard and metrics, development strategies and impress your audience. This template can be altered and modified as per your expectations. So, grab it now.

Sales Highlights Ideas Analysis Dashboard Powerpoint Slide Ideas
This is a sales highlights ideas analysis dashboard powerpoint slide ideas. This is a four stage process. The stages in this process are lead sources revenue share, opportunities total sales by probability, total sale amount, total sales by month, opportunity name, total sale amount.
Team Dynamics Skills Management Dashboard Ppt Images Gallery
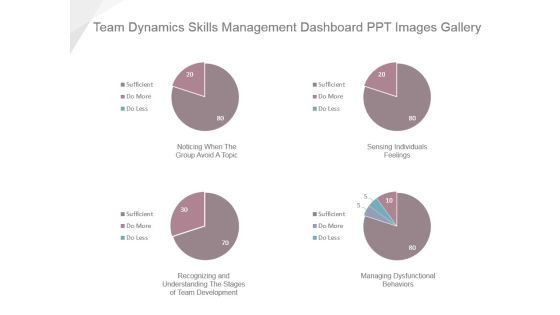
This is a team dynamics skills management dashboard ppt images gallery. This is a four stage process. The stages in this process are noticing when the group avoid a topic, sensing individuals feelings, recognizing and understanding the stages of team development, managing dysfunctional behaviors.

Five Year Financial Forecast And Essential Metrics Ppt Infographics Shapes PDF
This slide showcases five-year projection of the company to analyze its growth and financing needs and capital expenditures requirements. It also includes the KPIs such as number of customers, revenue , expenses and cashflow. Presenting Five Year Financial Forecast And Essential Metrics Ppt Infographics Shapes PDF to dispense important information. This template comprises five stages. It also presents valuable insights into the topics including Number Customers, Revenue, Expenses, Cash Flow, 2018 To 2022. This is a completely customizable PowerPoint theme that can be put to use immediately. So, download it and address the topic impactfully.

Metrics To Measure Efficiency Of Google Adwords Strategic Campaign Pictures PDF
This slide various marketing KPIs used to measure efficiency of google adwords campaign in company. It includes elements such as conversion rate, click through rate, cost per click, etc. Persuade your audience using this Metrics To Measure Efficiency Of Google Adwords Strategic Campaign Pictures PDF. This PPT design covers eight stages, thus making it a great tool to use. It also caters to a variety of topics including Conversion Rate, Click Through Rate, Cost Per Click . Download this PPT design now to present a convincing pitch that not only emphasizes the topic but also showcases your presentation skills.
Digital Sales Enhancement Metrics With Strategies Elements PDF
The following slide highlights five metrics which are important to track to increase online sales. The metrics included in slide are sales conversion rate, customer acquisition cost, average order value, customer lifetime value, and email opt-in rate and also methods to improve these metrics. Presenting Digital Sales Enhancement Metrics With Strategies Elements PDF to dispense important information. This template comprises five stages. It also presents valuable insights into the topics including Sales Conversion Rate, Customer Acquisition Cost, Average Order Value. This is a completely customizable PowerPoint theme that can be put to use immediately. So, download it and address the topic impactfully.

Digital Transformation Strategy Roadmap Marketing Dashboard Ppt PowerPoint Presentation Infographic Template Summary PDF
Presenting this set of slides with name digital transformation strategy roadmap marketing dashboard ppt powerpoint presentation infographic template summary pdf. This is a three stage process. The stages in this process are marketing dashboard. This is a completely editable PowerPoint presentation and is available for immediate download. Download now and impress your audience.

Dashboard Icon With Text Holders Ppt PowerPoint Presentation File Outfit PDF
Presenting this set of slides with name dashboard icon with text holders ppt powerpoint presentation file outfit pdf. This is a six stage process. The stages in this process are dashboard icon with text holders. This is a completely editable PowerPoint presentation and is available for immediate download. Download now and impress your audience.
Speedometer Dashboard Vector Icon Ppt PowerPoint Presentation File Designs Download PDF
Presenting this set of slides with name speedometer dashboard vector icon ppt powerpoint presentation file designs download pdf. This is a four stage process. The stages in this process are speedometer dashboard vector icon. This is a completely editable PowerPoint presentation and is available for immediate download. Download now and impress your audience.
Net Promoter Score Assessment Dashboard Icon Ppt PowerPoint Presentation File Icon PDF
Presenting this set of slides with name net promoter score assessment dashboard icon ppt powerpoint presentation file icon pdf. This is a one stage process. The stage in this process is net promoter score assessment dashboard icon. This is a completely editable PowerPoint presentation and is available for immediate download. Download now and impress your audience.

Major Metrics For Sales Pipeline Management Themes PDF
This slide shows the major metrics such as leads qualified, win rate, conversions, average order value, sales cycle length etc. that helps in sales pipeline management Deliver an awe inspiring pitch with this creative Major Metrics For Sales Pipeline Management Themes PDF bundle. Topics like Opportunities, Target, Sales, Average can be discussed with this completely editable template. It is available for immediate download depending on the needs and requirements of the user.

Project Priority And Status Dashboard Ppt PowerPoint Presentation Portfolio Design Templates
This is a project priority and status dashboard ppt powerpoint presentation portfolio design templates. This is a three stage process. The stages in this process are project management, project progress, project growth.

Pharmaceutical Quality Assurance And Control Dashboard Mockup PDF
This slide illustrates facts and figures related to production quality data of pharma drugs. It includes lead time of pharmaceutical drugs, production quality, quality metrics, etc. Showcasing this set of slides titled Pharmaceutical Quality Assurance And Control Dashboard Mockup PDF. The topics addressed in these templates are Quality Metrics, Production Quality, Control Dashboard. All the content presented in this PPT design is completely editable. Download it and make adjustments in color, background, font etc. as per your unique business setting.
Digital Sales Enhancement Metrics To Track Rules PDF
The following slide exhibits online sales metrics such as conversion rate, customer retention rate, average order value, cart abandonment rate, return on investment, time on website and bounce rate. The slide also include target and quarterly result of metrics. Showcasing this set of slides titled Digital Sales Enhancement Metrics To Track Rules PDF. The topics addressed in these templates are Conversion Rate, Customer Retention Rate, Cart Abandonment Rate. All the content presented in this PPT design is completely editable. Download it and make adjustments in color, background, font etc. as per your unique business setting.
Quality Management Dashboard Ppt PowerPoint Presentation Professional Gridlines
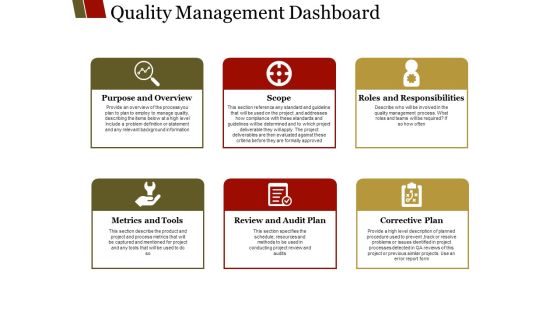
This is a quality management dashboard ppt powerpoint presentation professional gridlines. This is a six stage process. The stages in this process are scope, purpose and overview, metrics and tools, review and audit, plan corrective plan.

Quality Management Dashboard Ppt PowerPoint Presentation Infographics Graphics
This is a quality management dashboard ppt powerpoint presentation infographics graphics. This is a six stage process. The stages in this process are purpose and overview, scope, roles and responsibilities, metrics and tools, review and audit plan.
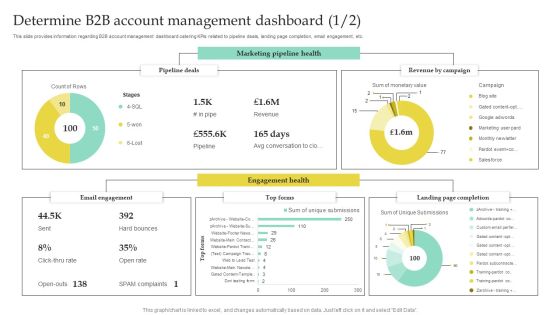
Determine B2B Account Management Dashboard Slides PDF
This slide provides information regarding B2B account management dashboard catering KPIs related to pipeline deals, landing page completion, email engagement, etc. Crafting an eye catching presentation has never been more straightforward. Let your presentation shine with this tasteful yet straightforward Determine B2B Account Management Dashboard Slides PDF template. It offers a minimalistic and classy look that is great for making a statement. The colors have been employed intelligently to add a bit of playfulness while still remaining professional. Construct the ideal Determine B2B Account Management Dashboard Slides PDF that effortlessly grabs the attention of your audience Begin now and be certain to wow your customers.

Shipping And Logistics Management Dashboard With Perfect Order Rate And Warehouse Background PDF
This slide covers KPIs to track the automation system of the company including warehouse operating costs, perfect order cost, on time shipment etc. Deliver and pitch your topic in the best possible manner with this Shipping And Logistics Management Dashboard With Perfect Order Rate And Warehouse Background PDF. Use them to share invaluable insights on Warehouse Operating Costs, Perfect Order Rate and impress your audience. This template can be altered and modified as per your expectations. So, grab it now.

Alternative Distribution Advertising Platform Lead Generation Dashboard Sample PDF
This infographic is used to track the multichannel marketing dashboard which covers lead breakdown, different social media channels, conversion metrics. Deliver and pitch your topic in the best possible manner with this alternative distribution advertising platform lead generation dashboard sample pdf. Use them to share invaluable insights on metrics, traffic, targets, analytics, media channels and impress your audience. This template can be altered and modified as per your expectations. So, grab it now.

Amalgamation Marketing Pitch Deck Lead Generation Dashboard Professional PDF
This infographic is used to track the multichannel marketing dashboard which covers lead breakdown, different social media channels, conversion metrics. Deliver and pitch your topic in the best possible manner with this amalgamation marketing pitch deck lead generation dashboard professional pdf. Use them to share invaluable insights on metrics, traffic, targets, analytics, media channels and impress your audience. This template can be altered and modified as per your expectations. So, grab it now.
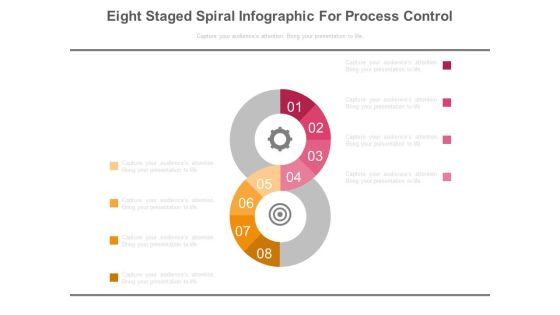
Eight Steps Dashboard Matrics Powerpoint Slides
This PowerPoint template eight number infographic chart. Download this PPT chart to depict target planning. This PowerPoint slide is of great help in the business sector to make realistic presentations and provides effective way of presenting your newer thoughts.

Service Strategy And Service Lifecycle Implementation Customer Service Metrics Ppt Ideas Templates PDF
Presenting this set of slides with name service strategy and service lifecycle implementation customer service metrics ppt ideas templates pdf. The topics discussed in these slides are customer service dashboard, resolution time channel, customer incidents, average waiting time, resolution, resolution time channel. This is a completely editable PowerPoint presentation and is available for immediate download. Download now and impress your audience.

Incorporating Real Time Marketing For Improved Consumer Real Time Content Marketing Result Dashboard Mockup PDF
The following slide depicts real time content marketing KPI dashboard to monitor traffic flow and manage promotional efforts. It includes elements such as visitors by channel, conversion rate, search, direct, sessions, average time engaged etc. This modern and well arranged Incorporating Real Time Marketing For Improved Consumer Real Time Content Marketing Result Dashboard Mockup PDF provides lots of creative possibilities. It is very simple to customize and edit with the Powerpoint Software. Just drag and drop your pictures into the shapes. All facets of this template can be edited with Powerpoint no extra software is necessary. Add your own material, put your images in the places assigned for them, adjust the colors, and then you can show your slides to the world, with an animated slide included.

Most Common Hr Metrics Ppt PowerPoint Presentation Model Visual Aids
This is a most common hr metrics ppt powerpoint presentation model visual aids. This is a six stage process. The stages in this process are workforce profile metrics, employee engagement metrics, recruitment metrics, competencies training metrics.
Strategies To Attract Customers And Lead Generation Dashboard For Tracking Facebook Retargeting Campaign Graphics PDF
This slide covers metrics for analysing the results of Facebook retargeting campaign. It includes KPIs such as ad spend, cost per click, click through rate, ad reach, post engagement, ad clicks, ad impressions, link clicks, etc. Deliver and pitch your topic in the best possible manner with this Strategies To Attract Customers And Lead Generation Dashboard For Tracking Facebook Retargeting Campaign Graphics PDF. Use them to share invaluable insights on Cost Per Click, Dashboard, Tracking Facebook Retargeting Campaign and impress your audience. This template can be altered and modified as per your expectations. So, grab it now.

Strategies To Attract Customers And Lead Generation Dashboard For Tracking Instagram Retargeting Campaign Elements PDF
This slide covers metrics for analyzing the results of the Instagram retargeting campaign. It includes KPIs such as amount spend, total reach, total impressions, website clicks, page likes, ad clicks, post reactions, etc. Deliver an awe inspiring pitch with this creative Strategies To Attract Customers And Lead Generation Dashboard For Tracking Instagram Retargeting Campaign Elements PDF bundle. Topics like Dashboard, Tracking Instagram Retargeting Campaign can be discussed with this completely editable template. It is available for immediate download depending on the needs and requirements of the user.
Strategies To Attract Customers And Lead Generation Dashboard For Tracking Twitter Retargeting Campaign Tracking Ideas PDF
This slide covers metrics for analysing the results of Twitter retargeting campaigns. It includes KPIs such as click through rate, impressions, conversion rate, cost, cost per click, etc. Deliver an awe inspiring pitch with this creative Strategies To Attract Customers And Lead Generation Dashboard For Tracking Twitter Retargeting Campaign Tracking Ideas PDF bundle. Topics like Dashboard, Tracking Twitter Retargeting, Campaign Tracking can be discussed with this completely editable template. It is available for immediate download depending on the needs and requirements of the user.

Cloud Dashboard For Tracking Project Sprints Ppt PowerPoint Presentation File Layouts PDF
The following slide depicts cloud dashboard for monitoring project sprints. It provides information about sprint blockers, resolved issues, under performers, sprint health, releases, sprint burndown, etc. If you are looking for a format to display your unique thoughts, then the professionally designed Cloud Dashboard For Tracking Project Sprints Ppt PowerPoint Presentation File Layouts PDF is the one for you. You can use it as a Google Slides template or a PowerPoint template. Incorporate impressive visuals, symbols, images, and other charts. Modify or reorganize the text boxes as you desire. Experiment with shade schemes and font pairings. Alter, share or cooperate with other people on your work. Download Cloud Dashboard For Tracking Project Sprints Ppt PowerPoint Presentation File Layouts PDF and find out how to give a successful presentation. Present a perfect display to your team and make your presentation unforgettable.
Leveraging Cloud For Project And Team Coordination Cloud Dashboard For Tracking Pictures PDF
The following slide depicts cloud dashboard for monitoring project sprints. It provides information about sprint blockers, resolved issues, under performers, sprint health, releases, sprint burndown, etc. Create an editable Leveraging Cloud For Project And Team Coordination Cloud Dashboard For Tracking Pictures PDF that communicates your idea and engages your audience. Whether you are presenting a business or an educational presentation, pre designed presentation templates help save time. Leveraging Cloud For Project And Team Coordination Cloud Dashboard For Tracking Pictures PDF is highly customizable and very easy to edit, covering many different styles from creative to business presentations. Slidegeeks has creative team members who have crafted amazing templates. So, go and get them without any delay.
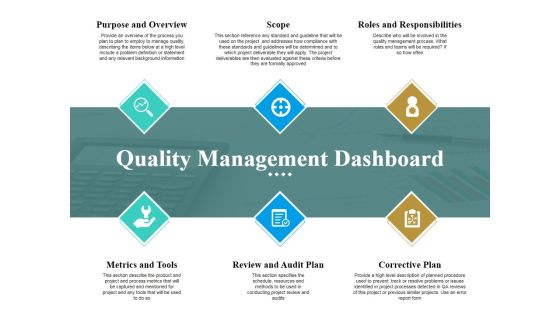
Quality Management Dashboard Ppt PowerPoint Presentation Outline Skills
This is a quality management dashboard ppt powerpoint presentation outline skills. This is a six stage process. The stages in this process are purpose and overview, scope, metrics and tools, review and audit plan, corrective plan.
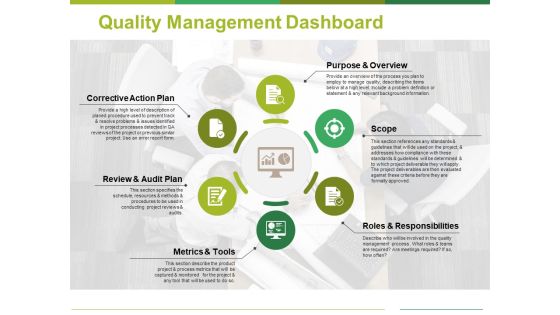
Quality Management Dashboard Ppt PowerPoint Presentation Styles Format Ideas
This is a quality management dashboard ppt powerpoint presentation styles format ideas. This is a six stage process. The stages in this process are scope, corrective action plan, metrics and tools, roles and responsibilities, purpose and overview.

Dashboard Template Formats PDF
Deliver an awe inspiring pitch with this creative dashboard template formats pdf bundle. Topics like dashboard template can be discussed with this completely editable template. It is available for immediate download depending on the needs and requirements of the user.

Dashboard Template Ideas PDF
Deliver an awe-inspiring pitch with this creative dashboard template ideas pdf. bundle. Topics like dashboard template can be discussed with this completely editable template. It is available for immediate download depending on the needs and requirements of the user.
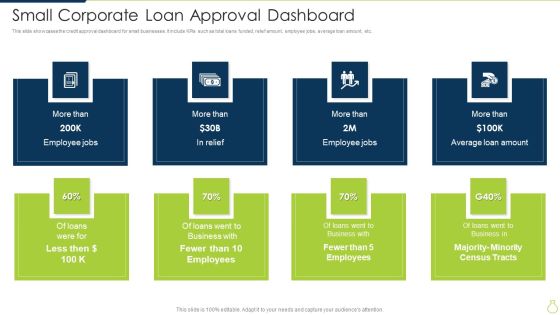
Small Corporate Loan Approval Dashboard Diagrams PDF
This slide showcases the credit approval dashboard for small businesses. It include KPIs such as total loans funded, relief amount, employee jobs, average loan amount, etc. Persuade your audience using this Small Corporate Loan Approval Dashboard Diagrams PDF. This PPT design covers eight stages, thus making it a great tool to use. It also caters to a variety of topics including Business, Loans, Census Tracts. Download this PPT design now to present a convincing pitch that not only emphasizes the topic but also showcases your presentation skills.

Vehicle Management System Dashboard Graphics PDF
This slide represents the dashboard to help fleet managers to monitor the vehicles and the drivers in real-time. It represents KPIs such as vehicle status, service reminders, open issues, inspections summary, service costs etc. Pitch your topic with ease and precision using this Vehicle Management System Dashboard Graphics PDF. This layout presents information on Vehicle Management System, Representing Maintenance Status. It is also available for immediate download and adjustment. So, changes can be made in the color, design, graphics or any other component to create a unique layout.

Setting Campaign Metrics Ppt PowerPoint Presentation Show Designs
This is a setting campaign metrics ppt powerpoint presentation show designs. This is a five stage process. The stages in this process are icons, business, marketing, management, success.

Online Consumer Engagement Digital Engagement Framework Metrics Demonstration PDF
This slide provides information regarding the framework which is developed in order to identify value creation opportunities for digital engagement. SDeliver and pitch your topic in the best possible manner with this online consumer engagement digital engagement framework metrics demonstration pdf. Use them to share invaluable insights on information, technology, processes, value and impress your audience. This template can be altered and modified as per your expectations. So, grab it now.

Evaluation Of Risk Metrics Powerpoint Slide Presentation Guidelines
This is a evaluation of risk metrics powerpoint slide presentation guidelines. This is a five stage process. The stages in this process are business, management, strategy, marketing, diagram.
Setting Campaign Metrics Ppt PowerPoint Presentation Inspiration Slide
This is a setting campaign metrics ppt powerpoint presentation inspiration slide. This is a five stage process. The stages in this process are business, icons, strategy, marketing.

Circle Diagram With Team Icon Powerpoint Slides
This PowerPoint template has been designed with circle diagram and team icons. You may download this PPT slide to display team planning and strategy. This PowerPoint template helps to display your information in a useful, simple and orderly way.

Cash Conversion Cycle Diagram Example Of Ppt Presentation
This is a cash conversion cycle diagram example of ppt presentation. This is a four stage process. The stages in this process are order to cash, forecast to fulfill, purchase to pay, cash conversion cycle.
Set And Track Metrics Powerpoint Slide Background Picture
This is a set and track metrics powerpoint slide background picture. This is a five stage process. The stages in this process are business, success, management, strategy, icons.

Cost And Income Optimization Price Optimization Dashboard Microsoft PDF
This slide covers the details of price optimization which focuses on price changes, leader, distribution, and benchmark. Deliver an awe inspiring pitch with this creative cost and income optimization price optimization dashboard microsoft pdf bundle. Topics like basic metric, additional metric, price appliance, portfolio under management, average shelf price can be discussed with this completely editable template. It is available for immediate download depending on the needs and requirements of the user.
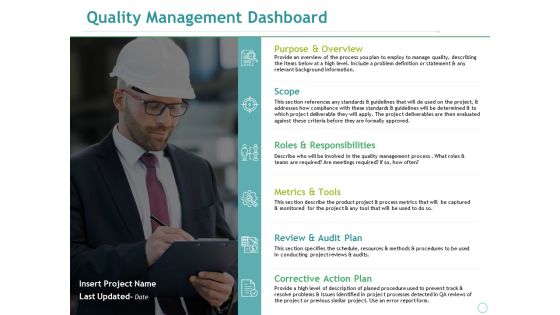
Quality Management Dashboard Ppt PowerPoint Presentation Ideas Template
This is a quality management dashboard ppt powerpoint presentation ideas template. This is a six stage process. The stages in this process are scope, metrics and tools, review and audit plan, corrective action plan, roles and responsibilities.
Quality Management Dashboard Ppt PowerPoint Presentation Icon Images
This is a quality management dashboard ppt powerpoint presentation icon images. This is a six stage process. The stages in this process are purpose and overview, scope, roles and responsibilities, metrics and tools, review and audit plan.

Human Resource Metrics Ppt PowerPoint Presentation Complete Deck With Slides
This is a human resource metrics ppt powerpoint presentation complete deck with slides. This is a one stage process. The stages in this process are human resources, business, planning, marketing, metrics.
Operational Excellence Metrics Ppt PowerPoint Presentation Complete Deck With Slides
This is a operational excellence metrics ppt powerpoint presentation complete deck with slides. This is a one stage process. The stages in this process are operational, excellence, metrics, business, technology.
Effective Company Event Communication Plan Dashboard For Tracking Active Number Microsoft PDF
This slide covers metrics for analyzing the number of most active event participants. It includes KPIs such as check-in status, contract roles, top industries, contract by country, top 5 job functions, etc. Deliver and pitch your topic in the best possible manner with this Effective Company Event Communication Plan Dashboard For Tracking Active Number Microsoft PDF Use them to share invaluable insights on Marketing, Management Less, Attendance and impress your audience. This template can be altered and modified as per your expectations. So, grab it now.
Effective Company Event Communication Tactics Dashboard For Tracking Active Number Of Attendances Demonstration PDF
This slide covers metrics for analyzing the number of most active event participants. It includes KPIs such as check-in status, contract roles, top industries, contract by country, top 5 job functions, etc. Deliver and pitch your topic in the best possible manner with this Effective Company Event Communication Tactics Dashboard For Tracking Active Number Of Attendances Demonstration PDF. Use them to share invaluable insights on Attendance, Exhibitors, Management and impress your audience. This template can be altered and modified as per your expectations. So, grab it now.

Effective Company Event Communication Tactics Dashboard For Tracking Event Revenue And Registrations Graphics PDF
This slide covers metrics for analyzing the event revenue and registrations. It includes KPIs such as gross revenue, gross revenue from promos, total refund, total registration, visits to purchase conversion, check-in- status, etc. Deliver and pitch your topic in the best possible manner with this Effective Company Event Communication Tactics Dashboard For Tracking Event Revenue And Registrations Graphics PDF. Use them to share invaluable insights on Gross Revenue, Registration Analysis, Purchase Conversion and impress your audience. This template can be altered and modified as per your expectations. So, grab it now.

Consumer Retargeting Techniques Dashboard For Tracking Facebook Retargeting Campaign Ideas PDF
This slide covers metrics for analysing the results of Facebook retargeting campaign. It includes KPIs such as ad spend, cost per click, click-through rate, ad reach, post engagement, ad clicks, ad impressions, link clicks, etc. Deliver an awe inspiring pitch with this creative Consumer Retargeting Techniques Dashboard For Tracking Facebook Retargeting Campaign Ideas PDF bundle. Topics like Cost Thousand, Cost Per, Through Rate can be discussed with this completely editable template. It is available for immediate download depending on the needs and requirements of the user.

Consumer Retargeting Techniques Dashboard For Tracking Instagram Retargeting Campaign Rules PDF
This slide covers metrics for analyzing the results of the Instagram retargeting campaign. It includes KPIs such as amount spend, total reach, total impressions, website clicks, page likes, ad clicks, post reactions, etc.Deliver and pitch your topic in the best possible manner with this Consumer Retargeting Techniques Dashboard For Tracking Instagram Retargeting Campaign Rules PDF. Use them to share invaluable insights on Total Impressions, Post Reactions, Total Amount and impress your audience. This template can be altered and modified as per your expectations. So, grab it now.
Retargeting Strategies To Improve Sales Dashboard For Tracking Facebook Retargeting Campaign Background PDF
This slide covers metrics for analysing the results of Facebook retargeting campaign. It includes KPIs such as ad spend, cost per click, click-through rate, ad reach, post engagement, ad clicks, ad impressions, link clicks, etc. Want to ace your presentation in front of a live audience Our Retargeting Strategies To Improve Sales Dashboard For Tracking Facebook Retargeting Campaign Background PDF can help you do that by engaging all the users towards you.. Slidegeeks experts have put their efforts and expertise into creating these impeccable powerpoint presentations so that you can communicate your ideas clearly. Moreover, all the templates are customizable, and easy-to-edit and downloadable. Use these for both personal and commercial use.

Retargeting Strategies To Improve Sales Dashboard For Tracking Instagram Retargeting Campaign Mockup PDF
This slide covers metrics for analyzing the results of the Instagram retargeting campaign. It includes KPIs such as amount spend, total reach, total impressions, website clicks, page likes, ad clicks, post reactions, etc. There are so many reasons you need a Retargeting Strategies To Improve Sales Dashboard For Tracking Instagram Retargeting Campaign Mockup PDF. The first reason is you can not spend time making everything from scratch, Thus, Slidegeeks has made presentation templates for you too. You can easily download these templates from our website easily.
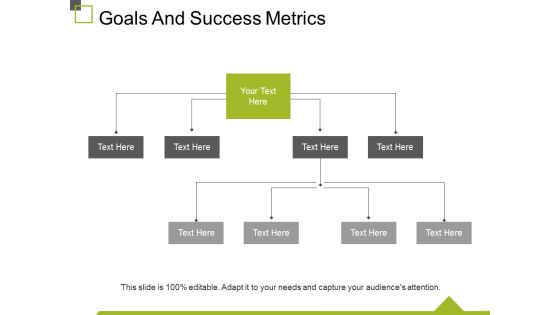
Goals And Success Metrics Ppt PowerPoint Presentation Show Slideshow
This is a goals and success metrics ppt powerpoint presentation show slideshow. This is a four stage process. The stages in this process are metrics, success, business, marketing, chart.
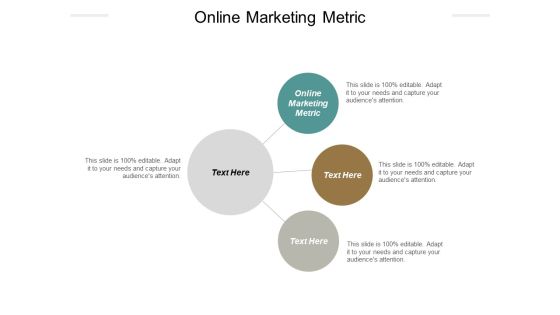
Online Marketing Metric Ppt PowerPoint Presentation Infographics Portrait Cpb
This is a online marketing metric ppt powerpoint presentation infographics portrait cpb. This is a three stage process. The stages in this process are online marketing metric, business, management, marketing.

Online Store Promotions Metrics Ppt PowerPoint Presentation Gallery Template
This is a online store promotions metrics ppt powerpoint presentation gallery template. This is a five stage process. The stages in this process are online store promotions metrics, business, management, marketing.

Table Of Contnes Enhancing Client Experience By Evaluating Kpis Rules PDF
This modern and well-arranged Table Of Contnes Enhancing Client Experience By Evaluating Kpis Rules PDF provides lots of creative possibilities. It is very simple to customize and edit with the Powerpoint Software. Just drag and drop your pictures into the shapes. All facets of this template can be edited with Powerpoint, no extra software is necessary. Add your own material, put your images in the places assigned for them, adjust the colors, and then you can show your slides to the world, with an animated slide included.

Targeted Marketing Campaigns To Improve Buyers Experience Kpis To Measure Personalized Marketing Results Information PDF
This modern and well arranged Targeted Marketing Campaigns To Improve Buyers Experience Kpis To Measure Personalized Marketing Results Information PDF provides lots of creative possibilities. It is very simple to customize and edit with the Powerpoint Software. Just drag and drop your pictures into the shapes. All facets of this template can be edited with Powerpoint no extra software is necessary. Add your own material, put your images in the places assigned for them, adjust the colors, and then you can show your slides to the world, with an animated slide included.

Most Common Hr Metrics Ppt PowerPoint Presentation Summary Example
This is a most common hr metrics ppt powerpoint presentation summary example. This is a six stage process. The stages in this process are turnover absence metrics, competencies training metrics, employee productivity metrics, workforce profile metrics, employee engagement metrics, recruitment metrics.
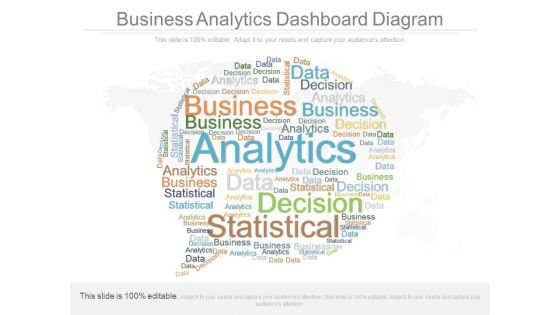
Business Analytics Dashboard Diagram
This is a business analytics dashboard diagram. This is a one stage process. The stages in this process are analytics, decision, data, business, statistics.
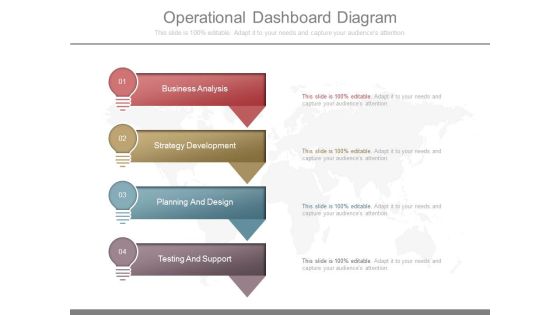
Operational Dashboard Diagram
This is a operational dashboard diagram. This is a four stage process. The stages in this process are business analysis, strategy development, planning and design, testing and support.

Positioning Metrics For Freelance Content Marketing Slides PDF
The following slide highlights the positioning metrics for freelance content marketing. It showcases search metrics, brand metrics, reputation metrics, follower growth, keyword value, pr metrics, reach and competitor metrics to monitor the positioning of content. Showcasing this set of slides titled Positioning Metrics For Freelance Content Marketing Slides PDF. The topics addressed in these templates are Keyword Growth, Pr Metrics, Brand Metrics. All the content presented in this PPT design is completely editable. Download it and make adjustments in color, background, font etc. as per your unique business setting.
Workforce Productivity Tracking Report Dashboard Background PDF
The given below slide depicts the KPIs of work stream status to assess progress and stagnation. It includes elements such as budget, risk, action plan, work stream timeline, highlights etc. Showcasing this set of slides titled Workforce Productivity Tracking Report Dashboard Background PDF. The topics addressed in these templates are High Technology Turnover, Workforce Health Safety Risk, Plan Employee Training. All the content presented in this PPT design is completely editable. Download it and make adjustments in color, background, font etc. as per your unique business setting.

Multi Channel Marketing Strategy Dashboard Slides PDF
This slide showcases marketing channels instrument board. The purpose of this template is evaluate progress and improve decision making. It includes elements such as marketing channel type digital marketing, free marketing, paid marketing and traditional marketing, main KPIS, click revenue. Pitch your topic with ease and precision using this Multi Channel Marketing Strategy Dashboard Slides PDF. This layout presents information on Bounce Rate, Conversion Rate, Marketing Channel Type. It is also available for immediate download and adjustment. So, changes can be made in the color, design, graphics or any other component to create a unique layout.

Success Metrics To Assess Customer Relationship Transformation Formats PDF
This slide provides information regarding the customer relationship metrics in order to access CRM program success. Get a simple yet stunning designed Success Metrics To Assess Customer Relationship Transformation Formats PDF. It is the best one to establish the tone in your meetings. It is an excellent way to make your presentations highly effective. So, download this PPT today from Slidegeeks and see the positive impacts. Our easy to edit Success Metrics To Assess Customer Relationship Transformation Formats PDF can be your go to option for all upcoming conferences and meetings. So, what are you waiting for Grab this template today.

Success Metrics To Assess Customer Relationship Transformation Microsoft PDF
This slide provides information regarding the customer relationship metrics in order to access CRM program success. Crafting an eye-catching presentation has never been more straightforward. Let your presentation shine with this tasteful yet straightforward Success Metrics To Assess Customer Relationship Transformation Microsoft PDF template. It offers a minimalistic and classy look that is great for making a statement. The colors have been employed intelligently to add a bit of playfulness while still remaining professional. Construct the ideal Success Metrics To Assess Customer Relationship Transformation Microsoft PDF that effortlessly grabs the attention of your audience Begin now and be certain to wow your customers
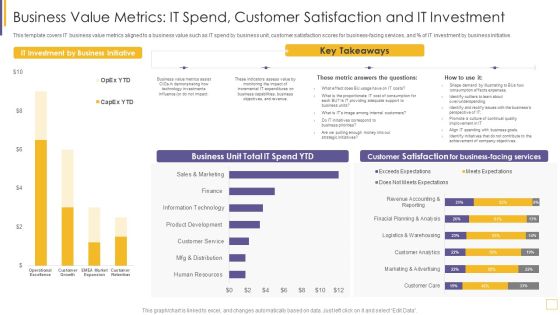
Guidelines For Exhibiting Business Value Of Information And Technology Business Value Metrics Brochure PDF
This template covers IT business value metrics aligned to a business value such as IT spend by business unit, customer satisfaction scores for business facing services, and percentage of IT investment by business initiative. Deliver an awe inspiring pitch with this creative guidelines for exhibiting business value of information and technology business value metrics brochure pdf bundle. Topics like metric, costs, internal customers, strategic can be discussed with this completely editable template. It is available for immediate download depending on the needs and requirements of the user.
Project Tracking Issue Tracker Dashboard Rules PDF
The following slide highlights the project tracking issues in project management to determine and resolve them quickly. It includes metrics such as issue summary, priorities, responsible head, reporting and closing date etc. Showcasing this set of slides titled Project Tracking Issue Tracker Dashboard Rules PDF. The topics addressed in these templates are Inappropriate Supplies, Project, Tracker Dashboard. All the content presented in this PPT design is completely editable. Download it and make adjustments in color, background, font etc. as per your unique business setting.

Workforce Growth And Improvement Metrics To Track Effectiveness Of Mentoring Programme Infographics PDF
This slide showcases metrics that can help organization to track the success and effectiveness and mentoring programme. It include KPIs related to engagement, programme progress and business objectives. Welcome to our selection of the Workforce Growth And Improvement Metrics To Track Effectiveness Of Mentoring Programme Infographics PDF. These are designed to help you showcase your creativity and bring your sphere to life. Planning and Innovation are essential for any business that is just starting out. This collection contains the designs that you need for your everyday presentations. All of our PowerPoints are 100 percent editable, so you can customize them to suit your needs. This multi-purpose template can be used in various situations. Grab these presentation templates today.

Kpis To Measure Information Security Risk Management Information Security Risk Administration Mockup PDF
This slide showcases KPIs that can help organization to measure the impact of cybersecurity risk management programme. It showcases estimated figures before and after implementation of plan.This modern and well-arranged Kpis To Measure Information Security Risk Management Information Security Risk Administration Mockup PDF provides lots of creative possibilities. It is very simple to customize and edit with the Powerpoint Software. Just drag and drop your pictures into the shapes. All facets of this template can be edited with Powerpoint no extra software is necessary. Add your own material, put your images in the places assigned for them, adjust the colors, and then you can show your slides to the world, with an animated slide included.

Kpis To Track Impact Of Ecommerce Website Sales Growth Strategies Pictures PDF
This slide showcases KPIs that can help organization to track the impact of sales growth strategies on ecommerce website. It includes conversion rate, net profit, customer retention rate, average order value, number of orders, cart abandonment rate etc. Present like a pro with Kpis To Track Impact Of Ecommerce Website Sales Growth Strategies Pictures PDF Create beautiful presentations together with your team, using our easy to use presentation slides. Share your ideas in real time and make changes on the fly by downloading our templates. So whether you are in the office, on the go, or in a remote location, you can stay in sync with your team and present your ideas with confidence. With Slidegeeks presentation got a whole lot easier. Grab these presentations today.

Supply Chain Management Operational Metrics Non Financial Measures Structure PDF
Presenting supply chain management operational metrics non financial measures structure pdf. to provide visual cues and insights. Share and navigate important information on five stages that need your due attention. This template can be used to pitch topics like backorder level, order to delivery lead time, supply chain lead time. In addtion, this PPT design contains high resolution images, graphics, etc, that are easily editable and available for immediate download.

Digital Marketing Toolkit Business To Business Marketing Transformation Success Metrics Sample PDF
This slide covers the B2B marketing transformation success metrics such as influenced pipelines, overall numbers of engaged accounts, marketing qualified accounts, individual campaign and channel metrics etc. If you are looking for a format to display your unique thoughts, then the professionally designed Digital Marketing Toolkit Business To Business Marketing Transformation Success Metrics Sample PDF is the one for you. You can use it as a Google Slides template or a PowerPoint template. Incorporate impressive visuals, symbols, images, and other charts. Modify or reorganize the text boxes as you desire. Experiment with shade schemes and font pairings. Alter, share or cooperate with other people on your work. Download Digital Marketing Toolkit Business To Business Marketing Transformation Success Metrics Sample PDF and find out how to give a successful presentation. Present a perfect display to your team and make your presentation unforgettable.

Maslow Pyramid For Online Marketing And Sales Pyramid Kpis Portrait PDF
Presenting Maslow Pyramid For Online Marketing And Sales Pyramid Kpis Portrait PDF to dispense important information. This template comprises four stages. It also presents valuable insights into the topics including Loyal KPIs, Sales KPIs, Online Advertising KPIs, Traffic KPIs. This is a completely customizable PowerPoint theme that can be put to use immediately. So, download it and address the topic impactfully.
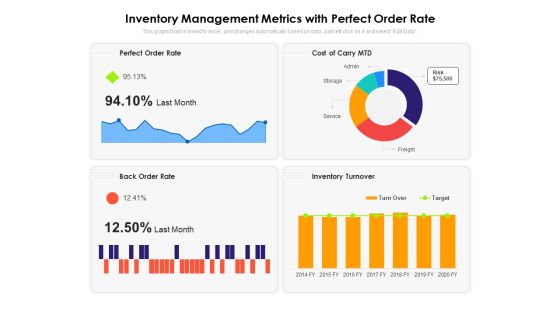
Inventory Management Metrics With Perfect Order Rate Ppt PowerPoint Presentation Pictures Elements PDF
Presenting this set of slides with name inventory management metrics with perfect order rate ppt powerpoint presentation pictures elements pdf. The topics discussed in these slides are perfect order rate, cost of carry mtd, back order rate, inventory turnover. This is a completely editable PowerPoint presentation and is available for immediate download. Download now and impress your audience.

Customer Service Delivery And Management Dashboard With Revenue Brochure PDF
The purpose of this slide is to monitor and evaluate service delivery KPIs to improve the customer support process. The major KPIs included are total requests, percentage of requests answered, total revenue, and support cost. Pitch your topic with ease and precision using this Customer Service Delivery And Management Dashboard With Revenue Brochure PDF. This layout presents information on Customer Service Delivery, Management Dashboard With Revenue. It is also available for immediate download and adjustment. So, changes can be made in the color, design, graphics or any other component to create a unique layout.

Success Metrics To Assess Consumer Service Strategy Pictures PDF
This slide provides information regarding the customer relationship metrics in order to access CRM program success. This is a Success Metrics To Assess Consumer Service Strategy Pictures PDF template with various stages. Focus and dispense information on seven stages using this creative set, that comes with editable features. It contains large content boxes to add your information on topics like Increased Up Sale, Increased Referrals, Customer Lifetime Value. You can also showcase facts, figures, and other relevant content using this PPT layout. Grab it now.

Most Common Hr Metrics Ppt PowerPoint Presentation Portfolio Gallery
This is a most common hr metrics ppt powerpoint presentation portfolio gallery. This is a six stage process. The stages in this process are turnover absence metrics, competencies training metrics, employee productivity metrics.

SCM Metrics For Area Wise Order Fulfillment Ppt PowerPoint Presentation Portfolio Maker PDF
Presenting this set of slides with name scm metrics for area wise order fulfillment ppt powerpoint presentation portfolio maker pdf. The topics discussed in these slides are perfect order rate, warehouser operating cost, on time shipments, total shipment by country. This is a completely editable PowerPoint presentation and is available for immediate download. Download now and impress your audience.
Shipping Tracking Metrics Icon For Tracking Order Delivery Delays Pictures PDF
Pitch your topic with ease and precision using this Shipping Tracking Metrics Icon For Tracking Order Delivery Delays Pictures PDF. This layout presents information on Tracking Order, Delivery Delays. It is also available for immediate download and adjustment. So, changes can be made in the color, design, graphics or any other component to create a unique layout.

Brand Valuation Scorecard With Advertising Metrics Elements PDF
Deliver an awe inspiring pitch with this creative Brand Valuation Scorecard With Advertising Metrics Elements PDF bundle. Topics like Brand Metrics, Advertising Metrics, Purchase Metrics can be discussed with this completely editable template. It is available for immediate download depending on the needs and requirements of the user.
 Home
Home