Key Performance Indicators

Periodic Business Performance Metrics Scorecard Ideas PDF
The mentioned slide showcases how well organizations KPI have performed in overall four quarters of the year. It track and assess quarterly performance of employees,revenue generation,customer satisfaction, cash flow etc. Pitch your topic with ease and precision using this Periodic Business Performance Metrics Scorecard Ideas PDF. This layout presents information on Employee Performance, Revenue Generation, Customer Satisfaction. It is also available for immediate download and adjustment. So, changes can be made in the color, design, graphics or any other component to create a unique layout.
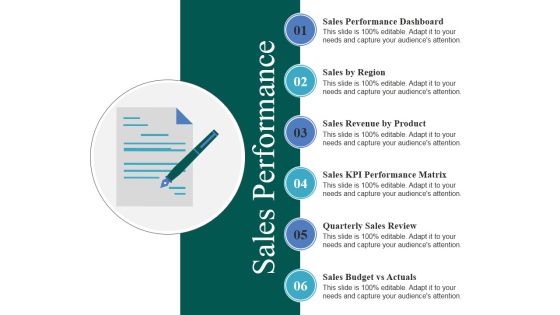
Sales Performance Ppt PowerPoint Presentation Infographics Visuals
This is a sales performance ppt powerpoint presentation infographics visuals. This is a six stage process. The stages in this process are sales by region, sales revenue by product, sales kpi performance matrix, quarterly sales review, sales budget vs actuals.

Dashboards For Measuring Business Performance Ppt Icon
This is a dashboards for measuring business performance ppt icon. This is a three stage process. The stages in this process are dashboard, measuring, management, speedometer, icons, strategy.

Dashboard For Marketing Executives Performance Analysis
This is a dashboard for marketing executives performance analysis. This is a three stage process. The stages in this process are business, marketing, dashboard, analysis, finance.
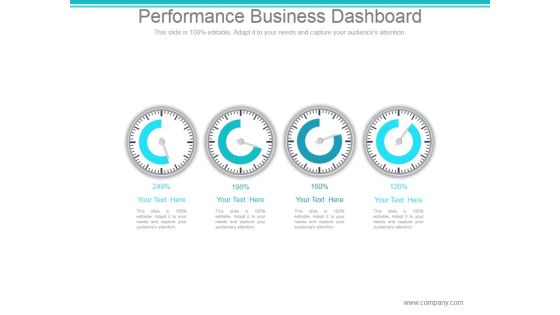
Performance Business Dashboard Ppt PowerPoint Presentation Visuals
This is a performance business dashboard ppt powerpoint presentation visuals. This is a four stage process. The stages in this process are dashboard, speedometer, report, business, marketing.

Performance Dashboard Ppt PowerPoint Presentation Background Image
This is a performance dashboard ppt powerpoint presentation background image. This is a four stage process. The stages in this process are business, marketing, management, dashboard, finance.

Performance Dashboard Ppt PowerPoint Presentation Template
This is a performance dashboard ppt powerpoint presentation template. This is a six stage process. The stages in this process are business, strategy, loop, process, dashboard.
Performance Dashboard Ppt PowerPoint Presentation Show
This is a performance dashboard ppt powerpoint presentation show. This is a one stage process. The stages in this process are business, dashboard, measure, management, marketing.
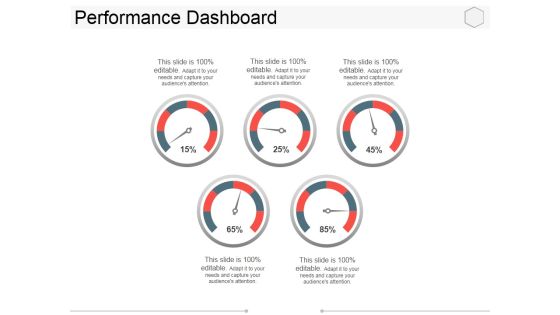
Performance Dashboard Ppt PowerPoint Presentation Layouts Styles
This is a performance dashboard ppt powerpoint presentation layouts styles. This is a five stage process. The stages in this process are process, measurement, dashboard, business, marketing.

Client Attrition Performance Administration Kpis Topics PDF
This slide shows various KPI to manage and track customer performance. It includes customer attrition rate, retention rate, repeat customer rate, purchase frequency, etc. Pitch your topic with ease and precision using this Client Attrition Performance Administration Kpis Topics PDF. This layout presents information on Customer Retention Rate, Repeat Customer Rate, Purchase Frequency. It is also available for immediate download and adjustment. So, changes can be made in the color, design, graphics or any other component to create a unique layout.

Corporate Performance Management Dashboard Ppt Powerpoint Topics
This is a corporate performance management dashboard ppt powerpoint topics. This is a eight stage process. The stages in this process are analysis, reporting, dashboards, financial consolidation, budgeting, forecasting, detailed planning, operational planning, corporate performance management.

Employee Performance Increment Management Dashboard Summary PDF
The slide shows a dashboard for successful management of employee performance appraisal. Showcasing this set of slides titled Employee Performance Increment Management Dashboard Summary PDF. The topics addressed in these templates are Employee Performance Increment, Management Dashboard. All the content presented in this PPT design is completely editable. Download it and make adjustments in color, background, font etc. as per your unique business setting.
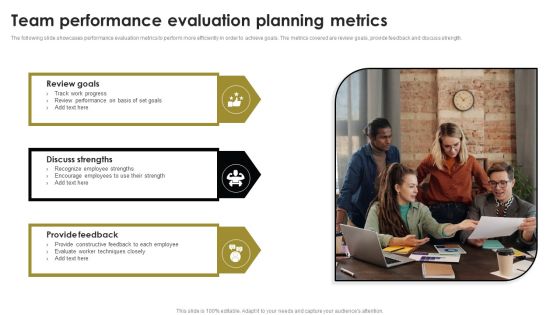
Team Performance Evaluation Planning Metrics Ideas PDF
The following slide showcases performance evaluation metrics to perform more efficiently in order to achieve goals. The metrics covered are review goals, provide feedback and discuss strength. Persuade your audience using this Team Performance Evaluation Planning Metrics Ideas PDF. This PPT design covers three stages, thus making it a great tool to use. It also caters to a variety of topics including Discuss Strengths, Review Goals, Provide Feedback. Download this PPT design now to present a convincing pitch that not only emphasizes the topic but also showcases your presentation skills.
Fb Advertising Campaign Performance Metrics Icons PDF
The following slide showcases performance metrics to assess a companys behavior, actions, and performance. It includes results, cost per impression and frequency. Presenting Fb Advertising Campaign Performance Metrics Icons PDF to dispense important information. This template comprises three stages. It also presents valuable insights into the topics including Cost Per Impression, Frequency, Results. This is a completely customizable PowerPoint theme that can be put to use immediately. So, download it and address the topic impactfully.

Business Software Performance Metric Icon Demonstration PDF
Presenting Business Software Performance Metric Icon Demonstration PDF to dispense important information. This template comprises Three stages. It also presents valuable insights into the topics including Business Software, Performance, Metric Icon. This is a completely customizable PowerPoint theme that can be put to use immediately. So, download it and address the topic impactfully.
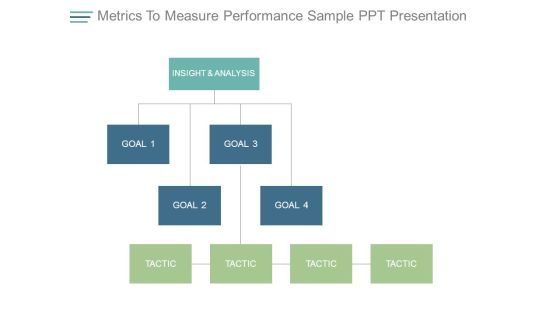
Metrics To Measure Performance Sample Ppt Presentation
This is a metrics to measure performance sample ppt presentation. This is a three stage process. The stages in this process are insight and analysis, goal, tactic.
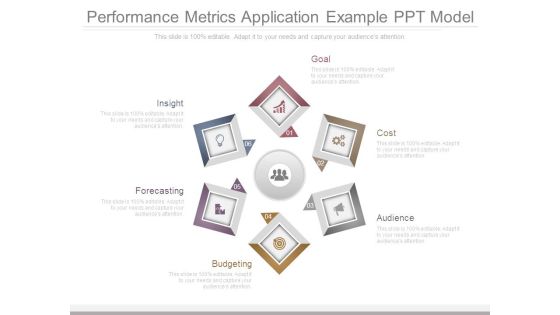
Performance Metrics Application Example Ppt Model
This is a performance metrics application example ppt model. This is a six stage process. The stages in this process are goal, cost, audience, budgeting, forecasting, insight.
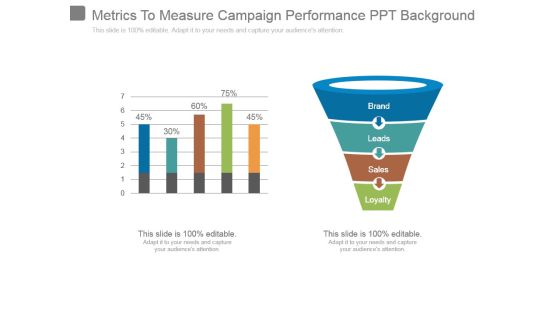
Metrics To Measure Campaign Performance Ppt Background
This is a metrics to measure campaign performance ppt background. This is a two stage process. The stages in this process are brand, leads, sales, loyalty.
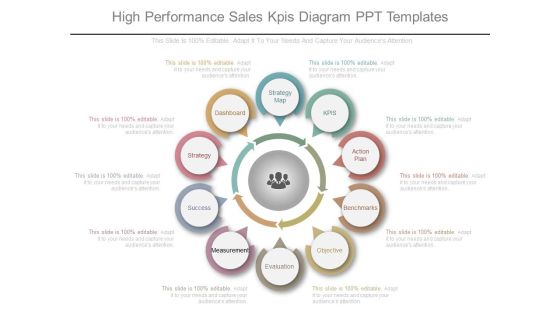
High Performance Sales Kpis Diagram Ppt Templates
This is a high performance sales kpis diagram ppt templates. This is a ten stage process. The stages in this process are strategy map, kpis, action plan, benchmarks, objective, evaluation, measurement, success, strategy, dashboard.

Business Performance Management Systems Ppt Design Templates
This is a business performance management systems ppt design templates. This is a five stage process. The stages in this process are people, process, strategy, kpi, accountability.

Agency Performance Dashboard Sample Of Ppt
This is a agency performance dashboard sample of ppt. This is a four stage process. The stages in this process are tra score, brand safety, view ability, ad fraud, industry snapshot.

Dashboards For Visualizing Performance Powerpoint Layout
This is a dashboards for visualizing performance powerpoint layout. This is a four stage process. The stages in this process are tra score, view ability, ad fraud, brand safety, industry snapshot.
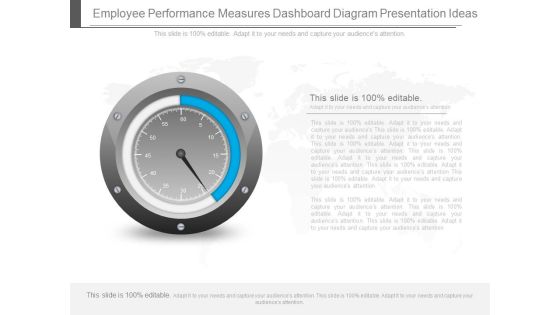
Employee Performance Measures Dashboard Diagram Presentation Ideas
This is a employee performance measures dashboard diagram presentation ideas. This is a one stage process. The stages in this process are business, marketing, dashboard, measuring.
Loyalty Program Performance Tracking Dashboard Topics PDF
This slide covers the KPI dashboard for analyzing customer loyalty campaign results. It includes metrics such as revenue, liability, NQP accrued, transaction count, members, redemption ratio, etc. Deliver an awe inspiring pitch with this creative Loyalty Program Performance Tracking Dashboard Topics PDF bundle. Topics like Loyalty Program Performance, Tracking Dashboard can be discussed with this completely editable template. It is available for immediate download depending on the needs and requirements of the user.
Referral Program Performance Tracking Dashboard Summary PDF
This slide covers the KPI dashboard for analyzing referral campaign results. It includes metrics such as total revenue generated, monthly recurring revenue, new customers, clicks, cancelled customers, paying customers, etc. Deliver and pitch your topic in the best possible manner with this Referral Program Performance Tracking Dashboard Summary PDF. Use them to share invaluable insights on Referral Program Performance, Tracking Dashboard and impress your audience. This template can be altered and modified as per your expectations. So, grab it now.

Dashboard For Tracking Website Performance Professional PDF
This slide covers the KPI dashboard for analyzing the company website. It includes metrics such as conversions, conversion rate, sessions, stickiness, bounce rate, engagement, etc. Deliver and pitch your topic in the best possible manner with this Dashboard For Tracking Website Performance Professional PDF. Use them to share invaluable insights on Dashboard For Tracking, Website Performance and impress your audience. This template can be altered and modified as per your expectations. So, grab it now.
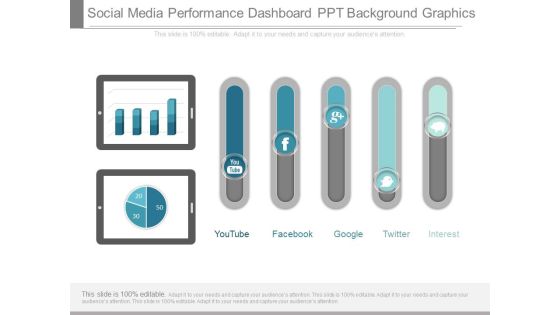
Social Media Performance Dashboard Ppt Background Graphics
This is a social media performance dashboard ppt background graphics. This is a seven stage process. The stages in this process are youtube, facebook, google, twitter, pinterest.
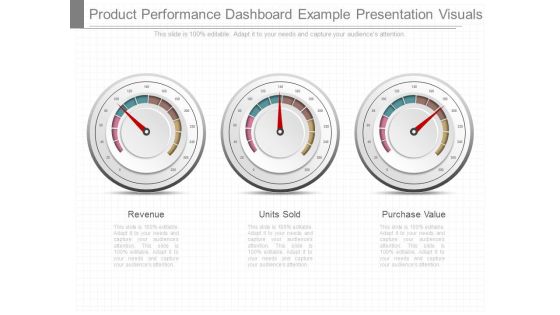
Product Performance Dashboard Example Presentation Visuals
This is a product performance dashboard example presentation visuals. This is a three stage process. The stages in this process are revenue, units sold, purchase value.

Business Performance Dashboard Analysis Diagram Powerpoint Slides
This is a business performance dashboard analysis diagram powerpoint slides. This is a three stage process. The stages in this process are measure, business, management, presentation, process.

Employee Performance Information Chart Powerpoint Slides
This dashboard template contains employee picture with percentage slides. This dashboard PowerPoint template conveys employees performance in a visual manner. Download this PPT slide for quick decision-making.
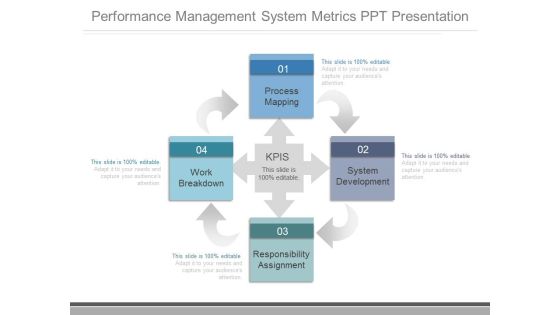
Performance Management System Metrics Ppt Presentation
This is a performance management system metrics ppt presentation. This is a four stage process. The stages in this process are process mapping, work breakdown, responsibility assignment, system development, kpis.
Software Development Performance Metric Icon Brochure PDF
Showcasing this set of slides titled Software Development Performance Metric Icon Brochure PDF. The topics addressed in these templates are Software Development, Performance, Metric Icon. All the content presented in this PPT design is completely editable. Download it and make adjustments in color, background, font etc. as per your unique business setting.

Marketing Performance Measures Diagram Ppt Example
This is a marketing performance measures diagram ppt example. This is a four stage process. The stages in this process are low, moderate, good, maximum.
Devops Performance Assessment Metrics Icons PDF
This is a devops performance assessment metrics icons pdf template with various stages. Focus and dispense information on four stages using this creative set, that comes with editable features. It contains large content boxes to add your information on topics like devops performance assessment metrics. You can also showcase facts, figures, and other relevant content using this PPT layout. Grab it now.
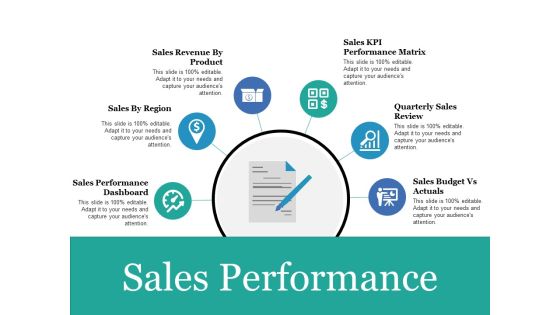
Sales Performance Ppt PowerPoint Presentation Portfolio Show
This is a sales performance ppt powerpoint presentation portfolio show. This is a six stage process. The stages in this process are sales performance dashboard, sales by region, sales revenue by product, quarterly sales review, sales budget vs actuals.

Performance Dashboard Template Ppt PowerPoint Presentation Topics
This is a performance dashboard template ppt powerpoint presentation topics. This is a four stage process. The stages in this process are business, strategy, marketing, analysis, success, growth strategy, dashboard.
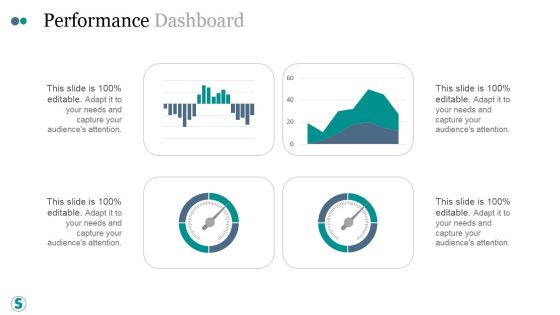
Performance Dashboard Ppt PowerPoint Presentation Summary
This is a performance dashboard ppt powerpoint presentation summary. This is a one stage process. The stages in this process are business, strategy, marketing, analysis, success, growth strategy, dashboard.

Business Metrics And Performance Diagram Presentation Images
This is a business metrics and performance diagram presentation images. This is a six stage process. The stages in this process are expense management, customer satisfaction, net income, revenue attainment, business metrics, turnover, productivity.

Personnel Performance Management System Types Sample PDF
This slide mentions various types of employee performance management systems. It includes KPI measurement, 360-degree appraisal, employee self assessment system and general performance review system. Persuade your audience using this Personnel Performance Management System Types Sample PDF. This PPT design covers four stages, thus making it a great tool to use. It also caters to a variety of topics including KPI Measurement System, General Performance, Review System. Download this PPT design now to present a convincing pitch that not only emphasizes the topic but also showcases your presentation skills.
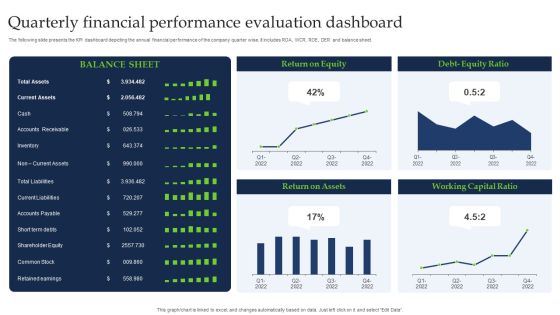
Quarterly Financial Performance Evaluation Dashboard Guidelines PDF
The following slide presents the KPI dashboard depicting the annual financial performance of the company quarter wise. It includes ROA, WCR, ROE, DER and balance sheet. Pitch your topic with ease and precision using this Quarterly Financial Performance Evaluation Dashboard Guidelines PDF. This layout presents information on Current Assets, Shareholder Equity, Common Stock. It is also available for immediate download and adjustment. So, changes can be made in the color, design, graphics or any other component to create a unique layout.

Application Performance Dashboard Ppt Icon Template PDF
This slide covers application performance in market KPIs and metrics such as impressions, clicks, searches for app, conversion rate etc. This Application Performance Dashboard Ppt Icon Template PDF from Slidegeeks makes it easy to present information on your topic with precision. It provides customization options, so you can make changes to the colors, design, graphics, or any other component to create a unique layout. It is also available for immediate download, so you can begin using it right away. Slidegeeks has done good research to ensure that you have everything you need to make your presentation stand out. Make a name out there for a brilliant performance.

Investment Performance Measurement Dashboard Ppt Sample
This is an investment performance measurement dashboard ppt sample. This is a three stage process. The stages in this process are infrastructure, property, credit opportunities.

Vendor Performance Dashboard Reports Ppt Powerpoint Images
This is a vendor performance dashboard reports ppt powerpoint images. This is a two stage process. The stages in this process are trends of complaints, count by category.

Team Members Performance Dashboard Powerpoint Slide Backgrounds
This is a team members performance dashboard powerpoint slide backgrounds. This is a four stage process. The stages in this process are ceo, general manager, marketing, developer.

Retail Stock Performance Management Dashboard Designs PDF
This slide shows retail inventory performance management dashboard for giving detailed information of different types of retail garment products. It include metric such as purchase order details, total products sold and products returned etc. Showcasing this set of slides titled Retail Stock Performance Management Dashboard Designs PDF. The topics addressed in these templates are Retail Stock Performance, Management Dashboard. All the content presented in this PPT design is completely editable. Download it and make adjustments in color, background, font etc. as per your unique business setting.
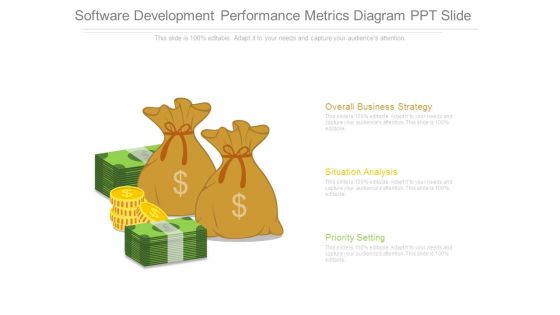
Software Development Performance Metrics Diagram Ppt Slide
This is a software development performance metrics diagram ppt slide. This is a three stage process. The stages in this process are overall business strategy, situation analysis, priority setting.

Partners Performance Assessment Dashboard Graphics PDF
This slide provides information regarding the dashboard for partners performance assessment in terms of revenue generated, etc. Deliver an awe-inspiring pitch with this creative partners performance assessment dashboard graphics pdf. bundle. Topics like revenue generated, pipeline, pipeline or close can be discussed with this completely editable template. It is available for immediate download depending on the needs and requirements of the user.

Devops Team Performance Monitoring Dashboard Infographics PDF
Deliver an awe inspiring pitch with this creative devops team performance monitoring dashboard infographics pdf bundle. Topics like devops team performance monitoring dashboard can be discussed with this completely editable template. It is available for immediate download depending on the needs and requirements of the user.
Call Centre Performance Evaluation Dashboard Icons PDF
Showcasing this set of slides titled call centre performance evaluation dashboard icons pdf. The topics addressed in these templates are call centre performance evaluation dashboard. All the content presented in this PPT design is completely editable. Download it and make adjustments in color, background, font etc. as per your unique business setting.

Product Sales Performance Evaluation Dashboard Graphics PDF
Pitch your topic with ease and precision using this product sales performance evaluation dashboard graphics pdf. This layout presents information on product sales performance evaluation dashboard. It is also available for immediate download and adjustment. So, changes can be made in the color, design, graphics or any other component to create a unique layout.
Acquisition Integration Performance Dashboard Icon Clipart PDF
Pitch your topic with ease and precision using this Acquisition Integration Performance Dashboard Icon Clipart PDF This layout presents information on Acquisition Integration, Performance, Dashboard Icon It is also available for immediate download and adjustment. So, changes can be made in the color, design, graphics or any other component to create a unique layout.

Manpower Performance Analytics Dashboard Icon Designs PDF
Persuade your audience using this Manpower Performance Analytics Dashboard Icon Designs PDF. This PPT design covers four stages, thus making it a great tool to use. It also caters to a variety of topics including Manpower Performance, Analytics Dashboard, Icon. Download this PPT design now to present a convincing pitch that not only emphasizes the topic but also showcases your presentation skills.

Executive Dashboards Showing Performance Icon Demonstration PDF
Persuade your audience using this Executive Dashboards Showing Performance Icon Demonstration PDF. This PPT design covers Three stages, thus making it a great tool to use. It also caters to a variety of topics including Executive Dashboards, Showing Performance Icon. Download this PPT design now to present a convincing pitch that not only emphasizes the topic but also showcases your presentation skills.
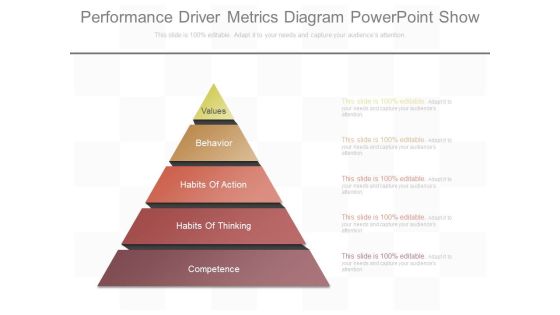
Performance Driver Metrics Diagram Powerpoint Show
This is a performance driver metrics diagram powerpoint show. This is a five stage process. The stages in this process are values, behavior, habits of action, habits of thinking, competence.

Defacto Performance Management Plan Ppt Example
This is a defacto performance management plan ppt example. This is a five stage process. The stages in this process are model, goals, plan, kpis, analyze.

Company Financials Performance Tracking Dashboard Brochure PDF
This slide illustrates KPI dashboard that can be used by organizations to track their financial performance on company basis. Kpis covered in the slide are contract status, revenue, cost of goods, overdue and task status. Showcasing this set of slides titled Company Financials Performance Tracking Dashboard Brochure PDF. The topics addressed in these templates are Report Shortcut, Revenue Cost, Overdue Task. All the content presented in this PPT design is completely editable. Download it and make adjustments in color, background, font etc. as per your unique business setting.

Business Intelligence Performance Dashboard Ppt Powerpoint Slides
This is a business intelligence performance dashboard ppt powerpoint slides. This is a six stage process. The stages in this process are total revenue, detailed profit of top product line, part capacity allocation, market share, customer satisfaction, quality notification.

Ppc Campaign Performance Measuring Dashboard Background PDF
Mentioned slide displays KPI dashboard that can be used to track the performance of PPC campaign. Metrics covered are AD cost, clicks, impressions, CTR and cost per conversion.The best PPT templates are a great way to save time, energy, and resources. Slidegeeks have 100 precent editable powerpoint slides making them incredibly versatile. With these quality presentation templates, you can create a captivating and memorable presentation by combining visually appealing slides and effectively communicating your message. Download Ppc Campaign Performance Measuring Dashboard Background PDF from Slidegeeks and deliver a wonderful presentation.

Vendor Performance Measurement Dashboard Brochure PDF
Mentioned slide portray vendor performance measurement dashboard. It covers KPIs such as defect rate, on time supplies, supplier availability and lead time. Deliver an awe inspiring pitch with this creative vendor performance measurement dashboard brochure pdf bundle. Topics like supplier defect rate, supplier availability, lead time can be discussed with this completely editable template. It is available for immediate download depending on the needs and requirements of the user.

Vendor Performance Measurement Dashboard Inspiration PDF
Mentioned slide portray vendor performance measurement dashboard. It covers KPIs such as defect rate, on time supplies, supplier availability and lead time. Deliver and pitch your topic in the best possible manner with this vendor performance measurement dashboard inspiration pdf. Use them to share invaluable insights on supplier defect rate, supplier availability, lead time and impress your audience. This template can be altered and modified as per your expectations. So, grab it now.

 Home
Home