Key Performance Indicators

Business Diagram Dashboard Design For Data Management Marketing Diagram
Be The Doer With Our Business Diagram Dashboard Design For Data Management Marketing Diagram Powerpoint Templates. Put Your Thoughts Into Practice.

Consulting Diagram Dashboard Business Information Chart Business Diagram
Get The Domestics Right With Our Consulting Diagram Dashboard Business Information Chart Business Diagram Powerpoint Templates. Create The Base For Thoughts To Grow.
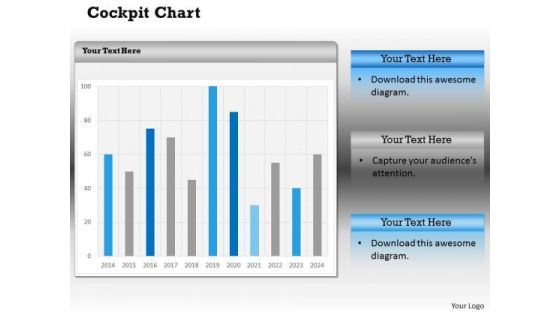
Consulting Diagram Dashboard Design For Quantitative Information Marketing Diagram
Doll Up Your Thoughts With Our Consulting Diagram Dashboard Design For Quantitative Information Marketing Diagram Powerpoint Templates. They Will Make A Pretty Picture.
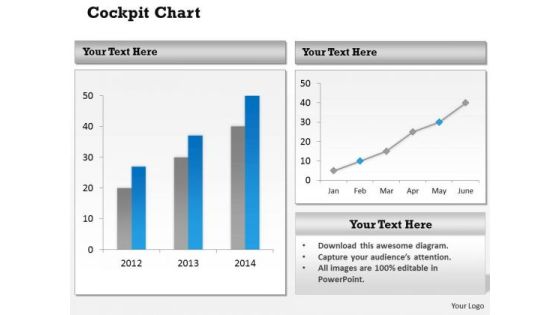
Consulting Diagram Dashboard Design With Data Structure Marketing Diagram
Establish The Dominance Of Your Ideas. Our Consulting Diagram Dashboard Design With Data Structure Marketing Diagram Powerpoint Templates Will Put Them On Top.
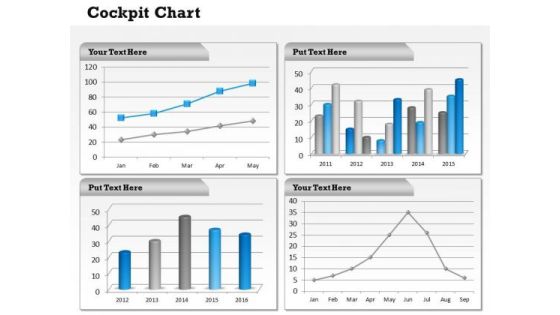
Consulting Diagram Dashboard Layout For Business Reporting Sales Diagram
Dominate Proceedings With Your Ideas. Our Consulting Diagram Dashboard Layout For Business Reporting Sales Diagram Powerpoint Templates Will Empower Your Thoughts.
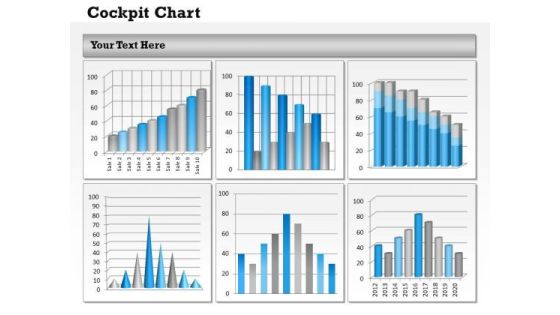
Consulting Diagram Dashboard To Visualize Business Data Consulting Diagram
Establish Your Dominion With Our Consulting Diagram Dashboard To Visualize Business Data Consulting Diagram Powerpoint Templates. Rule The Stage With Your Thoughts.
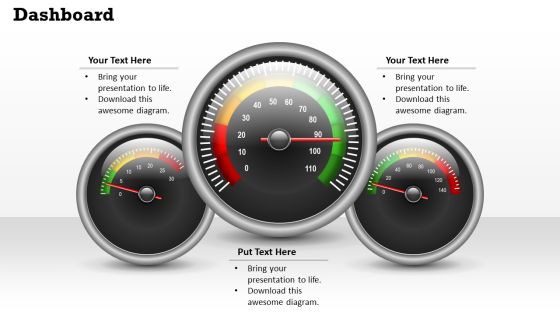
Marketing Diagram Dashboard To Compare Data Sales Diagram
Be A Donor Of Great Ideas. Display Your Charity On Our Marketing Diagram Dashboard To Compare Data Sales Diagram Powerpoint Templates.

Mba Models And Frameworks Dashboard Layout Business Design Sales Diagram
Open Up Doors That Lead To Success. Our MBA Models And Frameworks Dashboard Layout Business Design Sales Diagram Powerpoint Templates Provide The Handles.

Mba Models And Frameworks Dashboard To Compare Information Business Diagram
Our MBA Models And Frameworks Dashboard To compare Information Business Diagram Powerpoint Templates Abhor Doodling. They Never Let The Interest Flag.

Sales Diagram Dashboard For Quantitative Business Data Consulting Diagram
Deliver The Right Dose With Our Sales Diagram Dashboard For Quantitative Business Data Consulting Diagram Powerpoint Templates. Your Ideas Will Get The Correct Illumination.
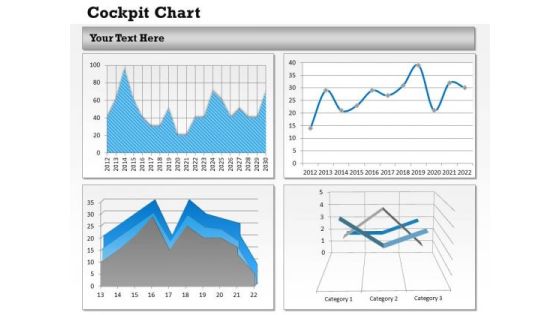
Strategic Management Dashboard Layout For Business Business Cycle Diagram
Knock On The Door To Success With Our Strategic Management Dashboard Layout For Business Business Cycle Diagram Powerpoint Templates. Be Assured Of Gaining Entry.
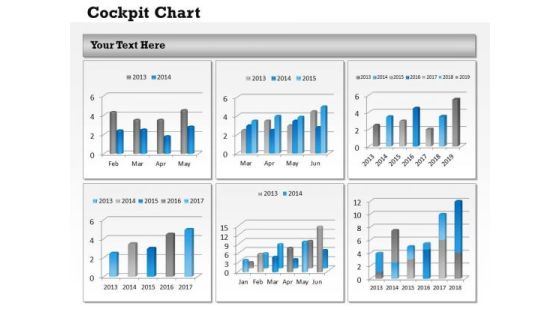
Business Cycle Diagram Display Data In Dashboard Layout Business Diagram
Analyze Ailments On Our Business Cycle Diagram Display Data In Dashboard Layout Business Diagram Powerpoint Templates. Bring Out The Thinking Doctor In You. Dock Your Thoughts With Our Business Cycle Diagram Display Data In Dashboard Layout Business Diagram Powerpoint Templates. They Will Launch Them Into Orbit.
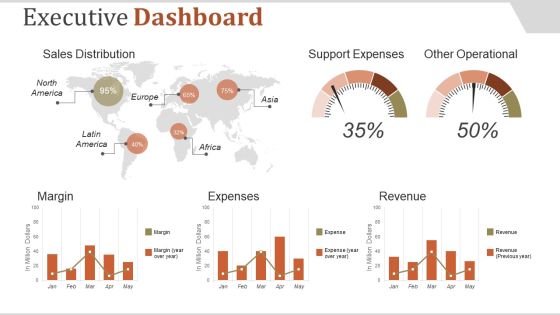
Executive Dashboard Ppt PowerPoint Presentation Introduction
This is a executive dashboard ppt powerpoint presentation introduction. This is a five stage process. The stages in this process are sales distribution, support expenses, other operational, margin, expenses.
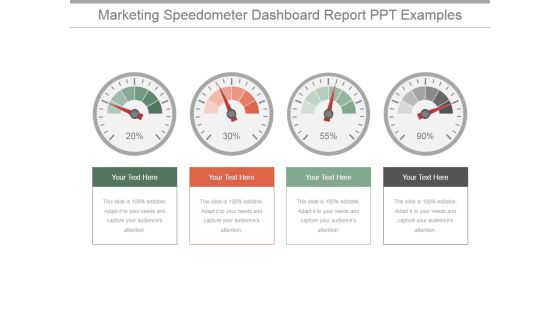
Marketing Speedometer Dashboard Report Ppt PowerPoint Presentation Designs Download
This is a marketing speedometer dashboard report ppt powerpoint presentation designs download. This is a four stage process. The stages in this process are dashboard, measurement, percentage, business, finance.

Dashboard Ppt PowerPoint Presentation Introduction Ppt PowerPoint Presentation Pictures
This is a dashboard ppt powerpoint presentation introduction ppt powerpoint presentation pictures. This is a three stage process. The stages in this process are business, strategy, marketing, success, dashboard.

Global Sales Plan Dashboard The Strategic Conversation Presentation Design
This is a global sales plan dashboard the strategic conversation presentation design. This is a five stage process. The stages in this process are business, process and flows, success.

Dashboard Employee Value Proposition Ppt PowerPoint Presentation Inspiration Topics
This is a dashboard employee value proposition ppt powerpoint presentation inspiration topics. This is a three stage process. The stages in this process are business, management, strategy, analysis, marketing.

Marketing Pipeline Analysis Framework And Metrics Brochure PDF
The mentioned slide showcases a five step framework through which businesses can set goals and understand customer journey. It includes acquisition, activation, retention, revenue and referral and KPIs. Presenting Marketing Pipeline Analysis Framework And Metrics Brochure PDF to dispense important information. This template comprises five stages. It also presents valuable insights into the topics including Acquisition, Retention, Referral. This is a completely customizable PowerPoint theme that can be put to use immediately. So, download it and address the topic impactfully.

Introducing CRM Framework Within Organization Content Ppt PowerPoint Presentation Inspiration Portrait PDF
Presenting this set of slides with name introducing crm framework within organization content ppt powerpoint presentation inspiration portrait pdf. This is a five stage process. The stages in this process are introduction, analytical crm, crm operations, crm technology, implementation and applications, kpi metrics and dashboard. This is a completely editable PowerPoint presentation and is available for immediate download. Download now and impress your audience.
Risk Levels Dashboard Ppt PowerPoint Presentation Icon Files
Presenting this set of slides with name risk levels dashboard ppt powerpoint presentation icon files. This is a one stage process. The stages in this process are hazard symbol, risk icon, risk management icon. This is a completely editable PowerPoint presentation and is available for immediate download. Download now and impress your audience.

Customer Service Metrics With Benchmark And Actual Progress Template PDF
This slide showcases comparison of benchmark and actual progress of customer service metrics. It also showcases improvement strategies in case of deviation in any week. Presenting Customer Service Metrics With Benchmark And Actual Progress Template PDF to dispense important information. This template comprises three stages. It also presents valuable insights into the topics including Customer Service Kpis, Customer Satisfaction Score, Strategies. This is a completely customizable PowerPoint theme that can be put to use immediately. So, download it and address the topic impactfully.

Sales Dashboard Template 2 Ppt PowerPoint Presentation Introduction
This is a sales dashboard template 2 ppt powerpoint presentation introduction. This is a four stage process. The stages in this process are total sales by month, lead sources revenue share, win loss ratio, opportunities total sales by probability.

Marketing Success Metrics Analysing Quality Scores To Determine Relevance Of Ad Themes PDF
This slide covers a brief introduction to quality score KPI along with improvement strategies such as using ad group and keyword structure, writing relevant and compelling ad copies, using ad formats and dynamic headlines. Crafting an eye-catching presentation has never been more straightforward. Let your presentation shine with this tasteful yet straightforward Marketing Success Metrics Analysing Quality Scores To Determine Relevance Of Ad Themes PDF template. It offers a minimalistic and classy look that is great for making a statement. The colors have been employed intelligently to add a bit of playfulness while still remaining professional. Construct the ideal Marketing Success Metrics Analysing Quality Scores To Determine Relevance Of Ad Themes PDF that effortlessly grabs the attention of your audience Begin now and be certain to wow your customers.

Marketing Success Metrics Analyzing Backlinks For Improved Search Engine Ranking Summary PDF
This slide covers an overview of backlinks KPI to identify count as one of the most important google ranking factors. It also includes improvement strategies such as finding backlink opportunities with top referral sources, guest blogging, and writing testimonials. Formulating a presentation can take up a lot of effort and time, so the content and message should always be the primary focus. The visuals of the PowerPoint can enhance the presenters message, so our Marketing Success Metrics Analyzing Backlinks For Improved Search Engine Ranking Summary PDF was created to help save time. Instead of worrying about the design, the presenter can concentrate on the message while our designers work on creating the ideal templates for whatever situation is needed. Slidegeeks has experts for everything from amazing designs to valuable content, we have put everything into Marketing Success Metrics Analyzing Backlinks For Improved Search Engine Ranking Summary PDF.

Sample Business Asset Valuation Dashboard Guide To Asset Cost Estimation Professional PDF
Following slide displays KPI dashboard for business asset valuation. KPIs covered are number of assets across production line, expected development cost and productivity index.Are you in need of a template that can accommodate all of your creative concepts This one is crafted professionally and can be altered to fit any style. Use it with Google Slides or PowerPoint. Include striking photographs, symbols, depictions, and other visuals. Fill, move around, or remove text boxes as desired. Test out color palettes and font mixtures. Edit and save your work, or work with colleagues. Download Sample Business Asset Valuation Dashboard Guide To Asset Cost Estimation Professional PDF and observe how to make your presentation outstanding. Give an impeccable presentation to your group and make your presentation unforgettable.

Kpis For E Commerce Project Management Ppt Styles Outline PDF
Mentioned slide showcase various KPIs which can be used by a firm for e-Commerce project management. Total sales, number of orders, total customers, number of items, shopping cart abandonment rate and conversion rate are the KPIs highlighted in the slide. Showcasing this set of slides titled Kpis For E Commerce Project Management Ppt Styles Outline PDF. The topics addressed in these templates are Total Number Order, Number Customer, Total Number Items. All the content presented in this PPT design is completely editable. Download it and make adjustments in color, background, font etc. as per your unique business setting.
Net Promoter Score Dashboard Post It Notes Ppt Inspiration Show PDF
Presenting net promoter score dashboard post it notes ppt inspiration show pdf to provide visual cues and insights. Share and navigate important information three stages that need your due attention. This template can be used to pitch topics like post it notes. In addtion, this PPT design contains high-resolution images, graphics, etc, that are easily editable and available for immediate download.

Trust Dashboard With Low Medium High Levels Ppt PowerPoint Presentation Ideas Infographics
Presenting this set of slides with name trust dashboard with low medium high levels ppt powerpoint presentation ideas infographics. This is a three stage process. The stages in this process are building trust, opportunity and handshake, partnership. This is a completely editable PowerPoint presentation and is available for immediate download. Download now and impress your audience.

Sales Process Management To Boost Business Effectiveness Metrics To Gauge The Health Of Sales Pipeline Formats PDF
This slide shows comparison of sales pipeline metrics Number of deals in sales pipeline, average deal size, win rate etc. of company with the industry average.Deliver an awe inspiring pitch with this creative Sales Process Management To Boost Business Effectiveness Metrics To Gauge The Health Of Sales Pipeline Formats PDF bundle. Topics like Probability To Close, Average Length, Average Deal can be discussed with this completely editable template. It is available for immediate download depending on the needs and requirements of the user.

Marketing Success Metrics Analyzing Open Email Rate To Improve User Engagement Demonstration PDF
This slide covers the overview of open email rate KPI to identify the effectiveness of your subject line and user engagement. It also includes strategies to increase available rates, such as creating eye-catching email subject lines, concentrating on deliverability, determining the best time to send emails, etc. Are you searching for a Marketing Success Metrics Analyzing Open Email Rate To Improve User Engagement Demonstration PDF that is uncluttered, straightforward, and original Its easy to edit, and you can change the colors to suit your personal or business branding. For a presentation that expresses how much effort youve put in, this template is ideal With all of its features, including tables, diagrams, statistics, and lists, its perfect for a business plan presentation. Make your ideas more appealing with these professional slides. Download Marketing Success Metrics Analyzing Open Email Rate To Improve User Engagement Demonstration PDF from Slidegeeks today.
Nps Reports And Dashboard Post It Notes Ppt Slides Influencers PDF
This is a nps reports and dashboard post it notes ppt slides influencers pdf template with various stages. Focus and dispense information on six stages using this creative set, that comes with editable features. It contains large content boxes to add your information on topics like post it notes. You can also showcase facts, figures, and other relevant content using this PPT layout. Grab it now.

Advertising Programs Management Techniques Kpis To Track Success Of Seasonal Marketing Campaign Formats PDF
This slide showcases the crucial metrics to be tracked for seasonal marketing campaigns. The KPIs covered are ROI, clickthrough rate, cost per acquisition, average order value and return on advertising spends. Want to ace your presentation in front of a live audience Our Advertising Programs Management Techniques Kpis To Track Success Of Seasonal Marketing Campaign Formats PDF can help you do that by engaging all the users towards you. Slidegeeks experts have put their efforts and expertise into creating these impeccable powerpoint presentations so that you can communicate your ideas clearly. Moreover, all the templates are customizable, and easy to edit and downloadable. Use these for both personal and commercial use.

Marketing Success Metrics Analyzing Keyword Ranking For Driving More Website Traffic Sample PDF
This slide covers an overview of keyword ranking KPI to identify your websites position in the serps for a particular keyword. It also includes improvement strategies such as publishing relevant, authoritative content, adding metadata, and using alt tags. Explore a selection of the finest Marketing Success Metrics Analyzing Keyword Ranking For Driving More Website Traffic Sample PDF here. With a plethora of professionally designed and pre-made slide templates, you can quickly and easily find the right one for your upcoming presentation. You can use our Marketing Success Metrics Analyzing Keyword Ranking For Driving More Website Traffic Sample PDF to effectively convey your message to a wider audience. Slidegeeks has done a lot of research before preparing these presentation templates. The content can be personalized and the slides are highly editable. Grab templates today from Slidegeeks.

Balance Scorecard Index Dashboard Ppt Slides
This is a balance scorecard index dashboard ppt slides. This is a one stage process. The stages in this process are sales by month, gross revenue, customer retention, executive scorecard, measures, status, trend, financial, option, customer, internal processes, learning and growth.
Metrics Scorecard With Internal Objectives And Customer Satisfaction Icons PDF
The purpose of this slide is to showcase different KPIs for company business. Information covered in this slide is related to financial status, business growth, internal objectives and customer satisfaction. Showcasing this set of slides titled Metrics Scorecard With Internal Objectives And Customer Satisfaction Icons PDF. The topics addressed in these templates are Financial Status, Customer Satisfaction, Internal Objectives. All the content presented in this PPT design is completely editable. Download it and make adjustments in color, background, font etc. as per your unique business setting.

Digital Marketing Toolkit Marketing Campaigns Transformation Success Metrics Rules PDF
This slide covers the campaign success KPIs such as user acquisition, new users and sessions, user behaviour such as bounce rate, page sessions, average session duration, conversion rate, completion and value for organic, social, direct and referral traffic. Make sure to capture your audiences attention in your business displays with our gratis customizable Digital Marketing Toolkit Marketing Campaigns Transformation Success Metrics Rules PDF. These are great for business strategies, office conferences, capital raising or task suggestions. If you desire to acquire more customers for your tech business and ensure they stay satisfied, create your own sales presentation with these plain slides.

Marketing Success Metrics Analyzing Email Click Through Rate For Better Campaign Mockup PDF
This slide covers an overview of email click-through rate KPI to identify total email recipients who clicked on one or more links attached in the email. It also includes strategies to increase the email click-through rate, such as incorporating compelling calls to action, using A or B email testing, collecting recipient feedback, etc. Welcome to our selection of the Marketing Success Metrics Analyzing Email Click Through Rate For Better Campaign Mockup PDF. These are designed to help you showcase your creativity and bring your sphere to life. Planning and Innovation are essential for any business that is just starting out. This collection contains the designs that you need for your everyday presentations. All of our PowerPoints are 100 percent editable, so you can customize them to suit your needs. This multi-purpose template can be used in various situations. Grab these presentation templates today.

Marketing Success Metrics Analyzing Landing Page Views To Drive More Web Traffic Slides PDF
This slide covers an overview of page view kpi to identify which pages drive the most traffic and which are underperforming. it also includes improvement strategies such as push notifications, yes or yes campaigns, and popups for related articles. The Marketing Success Metrics Analyzing Landing Page Views To Drive More Web Traffic Slides PDF is a compilation of the most recent design trends as a series of slides. It is suitable for any subject or industry presentation, containing attractive visuals and photo spots for businesses to clearly express their messages. This template contains a variety of slides for the user to input data, such as structures to contrast two elements, bullet points, and slides for written information. Slidegeeks is prepared to create an impression.
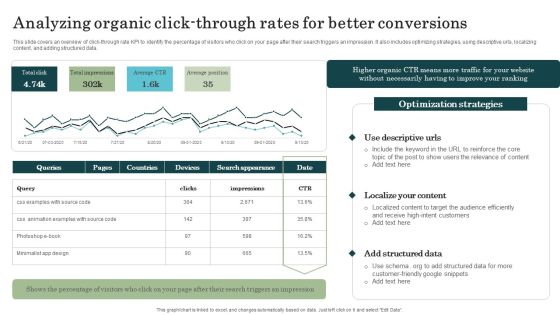
Marketing Success Metrics Analyzing Organic Click Through Rates For Better Diagrams PDF
This slide covers an overview of click-through rate KPI to identify the percentage of visitors who click on your page after their search triggers an impression. It also includes optimizing strategies, using descriptive urls, localizing content, and adding structured data. Welcome to our selection of the Marketing Success Metrics Analyzing Organic Click Through Rates For Better Diagrams PDF. These are designed to help you showcase your creativity and bring your sphere to life. Planning and Innovation are essential for any business that is just starting out. This collection contains the designs that you need for your everyday presentations. All of our PowerPoints are 100 percent editable, so you can customize them to suit your needs. This multi-purpose template can be used in various situations. Grab these presentation templates today.

Brand Awareness Strategy Kpis To Measure Brand Awareness Structure PDF
This slide showcases kpis that can help organization to track the success of brand awareness marketing campaign. It showcases impact on kpis after running marketing campaigns for increase awareness about brand. This modern and well-arranged Brand Awareness Strategy Kpis To Measure Brand Awareness Structure PDF provides lots of creative possibilities. It is very simple to customize and edit with the Powerpoint Software. Just drag and drop your pictures into the shapes. All facets of this template can be edited with Powerpoint, no extra software is necessary. Add your own material, put your images in the places assigned for them, adjust the colors, and then you can show your slides to the world, with an animated slide included.
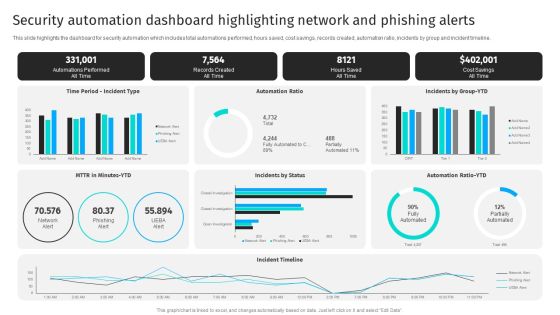
Security Automation Dashboard Highlighting Network And Phishing Alerts Professional PDF
This slide highlights the dashboard for security automation which includes total automations performed, hours saved, cost savings, records created, automation ratio, incidents by group and incident timeline.Get a simple yet stunning designed Security Automation Dashboard Highlighting Network And Phishing Alerts Professional PDF. It is the best one to establish the tone in your meetings. It is an excellent way to make your presentations highly effective. So, download this PPT today from Slidegeeks and see the positive impacts. Our easy-to-edit Security Automation Dashboard Highlighting Network And Phishing Alerts Professional PDF can be your go-to option for all upcoming conferences and meetings. So, what are you waiting for Grab this template today.

Seasonal Advertising Campaign Kpis To Track Success Of Seasonal Marketing Campaign Summary PDF
This slide showcases the crucial metrics to be tracked for seasonal marketing campaigns. The KPIs covered are ROI, clickthrough rate, cost per acquisition, average order value and return on advertising spends. There are so many reasons you need a Seasonal Advertising Campaign Kpis To Track Success Of Seasonal Marketing Campaign Summary PDF. The first reason is you can not spend time making everything from scratch, Thus, Slidegeeks has made presentation templates for you too. You can easily download these templates from our website easily.

Dashboard Procurement Analysis Formats PDF
This slide covers the procurement analysis dashboard including KPIs including total invoices, discount savings, etc. Deliver an awe inspiring pitch with this creative Dashboard Procurement Analysis Formats PDF bundle. Topics like Total Invoice, Discount Savings, Invoice Discount can be discussed with this completely editable template. It is available for immediate download depending on the needs and requirements of the user.

Maslow Pyramid For Online Marketing Kpis Structure PDF
The slide shows Maslow pyramid for online marketing KPIs. It highlights Loyalty , Sales, online advertising and traffic KPIs. Presenting Maslow Pyramid For Online Marketing Kpis Structure PDF to dispense important information. This template comprises four stages. It also presents valuable insights into the topics including Loyalty Kpis, Sales Kpis, Online Advertising Kpis. This is a completely customizable PowerPoint theme that can be put to use immediately. So, download it and address the topic impactfully.

Spa Marketing Strategy Boost Reservations Enhance Revenue Kpis To Measure Influencer Marketing Professional PDF
The following slide showcases various metrics to analyze impact of influencer marketing campaign and make data-driven decisions. It showcases KPIs such as reach, engagement, conversion rate. Traffic, sales, social media followers and brand mentions. Make sure to capture your audiences attention in your business displays with our gratis customizable Spa Marketing Strategy Boost Reservations Enhance Revenue Kpis To Measure Influencer Marketing Professional PDF. These are great for business strategies, office conferences, capital raising or task suggestions. If you desire to acquire more customers for your tech business and ensure they stay satisfied, create your own sales presentation with these plain slides.

KPIS Marketing Department Ppt PowerPoint Presentation Slides Master Slide Cpb
This is a kpis marketing department ppt powerpoint presentation slides master slide cpb. This is a three stage process. The stages in this process are kpis marketing department.

Software Application Marketing Data Analytics Report Mockup PDF
This slide shows app marketing analytics dashboard to gauge how well the marketing efforts are performing. It includes parameters like non organic content, organic content attribution,reengegement. Showcasing this set of slides titled Software Application Marketing Data Analytics Report Mockup PDF. The topics addressed in these templates are Software Application, Marketing Data, Analytics Report. All the content presented in this PPT design is completely editable. Download it and make adjustments in color, background, font etc. as per your unique business setting.

Marketing Success Metrics Analyzing Blog Views Visits To Increase Organic Traffic Icons PDF
This slide covers blog view KPI to identify how many unique visitors have viewed your blogs. It also includes strategies to improve blog page views, create viral content, use FAB strategy to create content, and create evergreen list posts. Coming up with a presentation necessitates that the majority of the effort goes into the content and the message you intend to convey. The visuals of a PowerPoint presentation can only be effective if it supplements and supports the story that is being told. Keeping this in mind our experts created Marketing Success Metrics Analyzing Blog Views Visits To Increase Organic Traffic Icons PDF to reduce the time that goes into designing the presentation. This way, you can concentrate on the message while our designers take care of providing you with the right template for the situation.
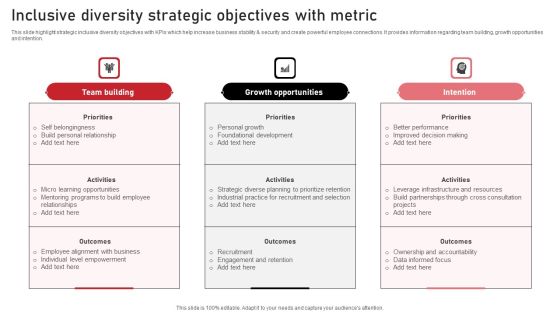
Inclusive Diversity Strategic Objectives With Metric Elements PDF
This slide highlight strategic inclusive diversity objectives with KPIs which help increase business stability and security and create powerful employee connections. It provides information regarding team building, growth opportunities and intention. Pitch your topic with ease and precision using this Inclusive Diversity Strategic Objectives With Metric Elements PDF. This layout presents information on Team Building, Growth Opportunities, Intention. It is also available for immediate download and adjustment. So, changes can be made in the color, design, graphics or any other component to create a unique layout.

Table Of Content Enhancing Hospital Software System Metrics Pictures PDF
Deliver an awe inspiring pitch with this creative table of content enhancing hospital software system metrics pictures pdf bundle. Topics like risk management framework, management system, dashboards and metrics can be discussed with this completely editable template. It is available for immediate download depending on the needs and requirements of the user.

Three Major Kpis For Expenditure Assessment Microsoft PDF
This slide shows positive impact of spend analytics on business supply chain by determining improvement areas. It include benefits such as reduce maverick purchasing, supply base reduction, optimize working capital, minimize delivery delays, reduce supply chain disturbances etc. Presenting Three Major Kpis For Expenditure Assessment Microsoft PDF to dispense important information. This template comprises Three stages. It also presents valuable insights into the topics including Requisition To Order Time, Pre Approved Spend, Realized Saving. This is a completely customizable PowerPoint theme that can be put to use immediately. So, download it and address the topic impactfully.
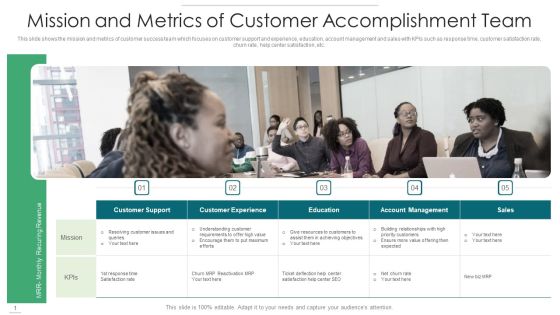
Mission And Metrics Of Customer Accomplishment Team Demonstration PDF
This slide shows the mission and metrics of customer success team which focuses on customer support and experience, education, account management and sales with KPIs such as response time, customer satisfaction rate, churn rate, help center satisfaction, etc. Presenting mission and metrics of customer accomplishment team demonstration pdf to dispense important information. This template comprises five stages. It also presents valuable insights into the topics including customer support, customer experience, education, account management, sales. This is a completely customizable PowerPoint theme that can be put to use immediately. So, download it and address the topic impactfully.

Metrics To Measure Brand Image For Corporates Professional PDF
This slide showcases the best KPIs to monitor the brand reputation for corporates and helps in optimizing brand strategy. It includes metrics such as sentiment analysis, PR shares, share of voice and online reviews. Persuade your audience using this Metrics To Measure Brand Image For Corporates Professional PDF. This PPT design covers Five stages, thus making it a great tool to use. It also caters to a variety of topics including Sentiment Analysis, Share Of Voice, Online Reviews. Download this PPT design now to present a convincing pitch that not only emphasizes the topic but also showcases your presentation skills.

Lead Generation Digital Promotion Success Metrics Portrait PDF
The slide highlights the KPIs to measure success rate of the lead generation campaign for predicting future sales. Various metrics included are marketing qualified leads, sales and time on site. Persuade your audience using this Lead Generation Digital Promotion Success Metrics Portrait PDF. This PPT design covers Three stages, thus making it a great tool to use. It also caters to a variety of topics including Marketing Qualified Leads, Sales. Download this PPT design now to present a convincing pitch that not only emphasizes the topic but also showcases your presentation skills.

SMART Goal Metrics For Maintenance Framework Inspiration PDF
The following slide showcases the SMART maintenance KPIs to achieve and improve goals. It includes metrics such as reducing downtime, optimizing labor time, achieving inventory precision, decreasing power consumption, lowering rework requests etc. Persuade your audience using this SMART Goal Metrics For Maintenance Framework Inspiration PDF. This PPT design covers five stages, thus making it a great tool to use. It also caters to a variety of topics including Specific, Measurable, Attainable, Realistic, Timely. Download this PPT design now to present a convincing pitch that not only emphasizes the topic but also showcases your presentation skills.

Sales Diagram Dashbaord Design To Communicate Effectively Marketing Diagram
Get Out Of The Dock With Our Sales Diagram Dashboard Design To Communicate Effectively Marketing Diagram Powerpoint Templates. Your Mind Will Be Set Free.

Strategy Diagram Dashbaord Design To Communicate Effectively Strategic Management
Document Your Views On Our Strategy Diagram Dashboard Design To Communicate Effectively Strategic Management Powerpoint Templates. They Will Create A Strong Impression.

Customer Satisfaction Metrics With NPR And Customer Effort Score Ppt Icon Graphics Tutorials PDF
The slide carries a dashboard to evaluate customer experience for bringing advancement in existing products. Various KPIs used to measure customer experience are NPS Net Promoter Score and CES Customer Effort Score. Showcasing this set of slides titled Customer Satisfaction Metrics With NPR And Customer Effort Score Ppt Icon Graphics Tutorials PDF. The topics addressed in these templates are Net Promoter Score, Customer Effort Score, Product Service Reviews. All the content presented in this PPT design is completely editable. Download it and make adjustments in color, background, font etc. as per your unique business setting.
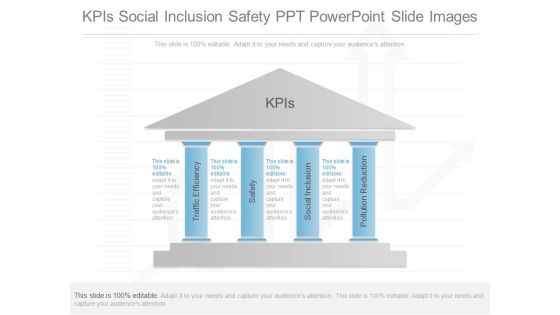
Kpis Social Inclusion Safety Ppt Powerpoint Slide Images
This is a kpis social inclusion safety ppt powerpoint slide images. This is a four stage process. The stages in this process are traffic efficiency, safety, social inclusion, pollution reduction, kpis.

Channel Kpis Template 1 Ppt PowerPoint Presentation Infographic Template Elements
This is a channel kpis template 1 ppt powerpoint presentation infographic template elements. This is a four stage process. The stages in this process are channel kpis, sales density, personnel cost, real estate cost, inventory turnover.

Channel Kpis Template 2 Ppt PowerPoint Presentation Show Designs
This is a channel kpis template 2 ppt powerpoint presentation show designs. This is a four stage process. The stages in this process are channel kpis, inspiration, evaluation, purchase, stationary pos.

Business Diagram Dashbaord Design To Communicate Effectively Marketing Diagram
Analyze Ailments On Our Business Diagram Dashboard Design To Communicate Effectively Marketing Diagram Powerpoint Templates. Bring Out The Thinking Doctor In You. Dock Your Thoughts With Our Business Diagram Dashboard Design To Communicate Effectively Marketing Diagram Powerpoint Templates. They Will Launch Them Into Orbit.
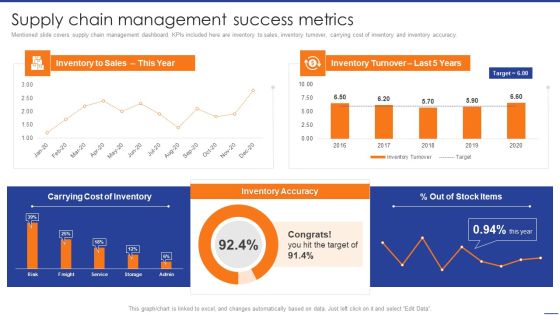
Digital Transformation Of Supply Supply Chain Management Success Metrics Download PDF
Mentioned slide covers supply chain management dashboard. KPIs included here are inventory to sales, inventory turnover, carrying cost of inventory and inventory accuracy. Slidegeeks is here to make your presentations a breeze with Digital Transformation Of Supply Supply Chain Management Success Metrics Download PDF With our easy-to-use and customizable templates, you can focus on delivering your ideas rather than worrying about formatting. With a variety of designs to choose from, youre sure to find one that suits your needs. And with animations and unique photos, illustrations, and fonts, you can make your presentation pop. So whether youre giving a sales pitch or presenting to the board, make sure to check out Slidegeeks first.

Advance IT Service Delivery Kpis For Human Resource Service Delivery Guidelines PDF
This slide depicts the KPIs for human resource service delivery with the help of AI and how some of these KPIs will be analyzed automatically through AI. Deliver and pitch your topic in the best possible manner with this advance it service delivery kpis for human resource service delivery guidelines pdf. Use them to share invaluable insights on human resource executives, employee development dashboard, workforce demographics dashboard and impress your audience. This template can be altered and modified as per your expectations. So, grab it now.

Parameters Of Growth And Development Powerpoint Slides
Dashboard design has been displayed in this business slide. This business diagram helps to exhibit parameters of growth and development. Download this PowerPoint template to build an exclusive presentation.
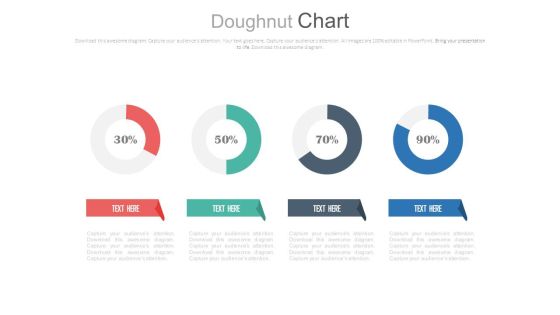
Four Circle Chart With Percentage Ratios Powerpoint Slides
This PowerPoint template has been designed with graphics of four circles and percentage ratios. You may use this dashboard slide design for topics like profit growth and financial planning. This PPT slide is powerful tool to describe your ideas.

Linear Circles Percentage Analysis Charts Powerpoint Slides
This PowerPoint template has been designed with graphics of three circles and percentage ratios. You may use this dashboard slide design for topics like profit growth and financial planning. This PPT slide is powerful tool to describe your ideas.
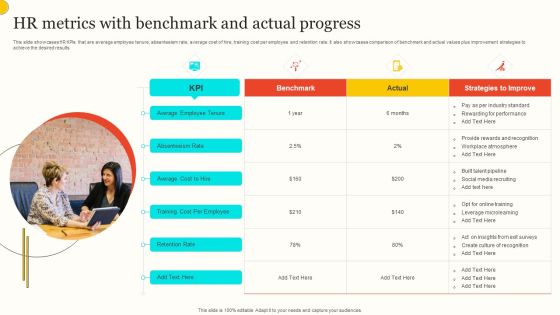
HR Metrics With Benchmark And Actual Progress Background PDF
This slide showcases HR KPIs that are average employee tenure, absenteeism rate, average cost of hire, training cost per employee and retention rate. It also showcases comparison of benchmark and actual values plus improvement strategies to achieve the desired results. Presenting HR Metrics With Benchmark And Actual Progress Background PDF to dispense important information. This template comprises one stages. It also presents valuable insights into the topics including Average Employee Tenure, Absenteeism Rate, Average Cost Hire. This is a completely customizable PowerPoint theme that can be put to use immediately. So, download it and address the topic impactfully.

Effective Metric To Measure Supplier Diversity Themes PDF
This slide showcases various KPIs used to measure supplier diversity which helps build inclusive supply chains. It provides information regarding diverse spend and count, cost and revenue impact, deals won and lost, market share and diverse supplier. Persuade your audience using this Effective Metric To Measure Supplier Diversity Themes PDF. This PPT design covers five stages, thus making it a great tool to use. It also caters to a variety of topics including Market Share, Diverse Suppliers, Impact. Download this PPT design now to present a convincing pitch that not only emphasizes the topic but also showcases your presentation skills.
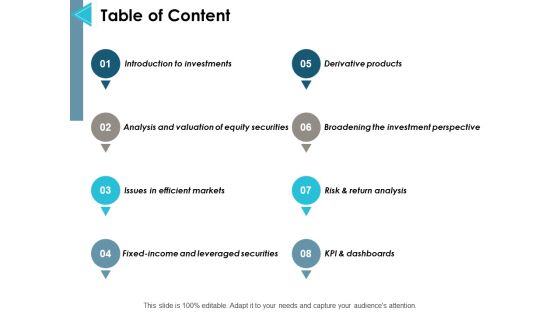
Table Of Content Ppt PowerPoint Presentation Gallery Graphic Tips
This is a table of content ppt powerpoint presentation gallery graphic tips. This is a eight stage process. The stages in this process are introduction to investments, risk and return analysis, issues in efficient markets, kpi and dashboards, management.
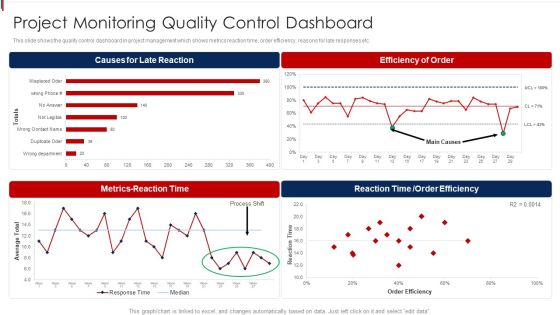
Project Monitoring Quality Control Dashboard Clipart PDF
This slide shows the quality control dashboard in project management which shows metrics reaction time, order efficiency, reasons for late responses etc Showcasing this set of slides titled Project Monitoring Quality Control Dashboard Clipart PDF. The topics addressed in these templates are Causes Late Reaction, Metrics Reaction Time, Efficiency Of Order. All the content presented in this PPT design is completely editable. Download it and make adjustments in color, background, font etc. as per your unique business setting.

Gamification Strategy For Business Promotion Gamification Dashboard Graphics PDF
Apps are using badges and leaderboards to boost healthy competition and encourage users to make the most of the apps.Deliver and pitch your topic in the best possible manner with this Gamification Strategy For Business Promotion Gamification Dashboard Graphics PDF. Use them to share invaluable insights on Leaderboard, Active Vs Sedentary, Calories Burned and impress your audience. This template can be altered and modified as per your expectations. So, grab it now.
Organization Demand Administration Kpis And Priorities Icons PDF
The below slide showcases the KPIs to enhance forecast accuracy and gain competitive advantage in demand management. It mainly constitutes of techniques, KPIs and priorities. Showcasing this set of slides titled Organization Demand Administration Kpis And Priorities Icons PDF. The topics addressed in these templates are Techniques To Advance, Demand Management. All the content presented in this PPT design is completely editable. Download it and make adjustments in color, background, font etc. as per your unique business setting.

Client Acquisition Through Marketing Campaign Kpis To Track Success Of Seasonal Marketing Campaign Themes PDF
This slide showcases the crucial metrics to be tracked for seasonal marketing campaigns. The KPIs covered are ROI, clickthrough rate, cost per acquisition, average order value and return on advertising spends. Crafting an eye catching presentation has never been more straightforward. Let your presentation shine with this tasteful yet straightforward Client Acquisition Through Marketing Campaign Kpis To Track Success Of Seasonal Marketing Campaign Themes PDF template. It offers a minimalistic and classy look that is great for making a statement. The colors have been employed intelligently to add a bit of playfulness while still remaining professional. Construct the ideal Client Acquisition Through Marketing Campaign Kpis To Track Success Of Seasonal Marketing Campaign Themes PDF that effortlessly grabs the attention of your audience Begin now and be certain to wow your customers.

Web Marketing Kpis Diagram Sample Of Ppt Presentation
This is a web marketing kpis diagram sample of ppt presentation. This is a four stage process. The stages in this process are system, synergy, site, scope.

Kpis For Lean Content Marketing Powerpoint Slide Themes
This is a kpis for lean content marketing powerpoint slide themes. This is a four stage process. The stages in this process are volume, amplification, traffic, leads.
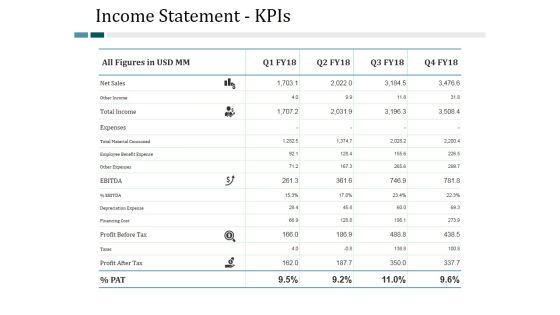
Income Statement Kpis Ppt PowerPoint Presentation Slides Show
This is a income statement kpis ppt powerpoint presentation slides show. This is a four stage process. The stages in this process are business, management, analysis, finance, strategy.

Channel Kpis Ppt PowerPoint Presentation Infographic Template Topics
This is a channel kpis ppt powerpoint presentation infographic template topics. This is a four stage process. The stages in this process are business, timeline, strategy, finance, planning.

Cash Flow Statement Kpis Ppt PowerPoint Presentation Clipart
This is a cash flow statement kpis ppt powerpoint presentation clipart. This is a four stage process. The stages in this process are business, marketing, finance, graph, strategy.

Balance Sheet Kpis Ppt PowerPoint Presentation File Picture
This is a balance sheet kpis ppt powerpoint presentation file picture. This is a four stage process. The stages in this process are business, marketing, finance, graph, cagr.

Business Growth Kpis Ppt PowerPoint Presentation File Good
This is a business growth kpis ppt powerpoint presentation file good. This is a five stage process. The stages in this process are cost reduction strategies.

Balance Sheet Kpis Ppt Powerpoint Presentation Outline Shapes
This is a balance sheet kpis ppt powerpoint presentation outline shapes. This is a four stage process. The stages in this process are business, management, planning, strategy, marketing.

P And L Kpis Ppt Powerpoint Presentation Styles
This is a p and l kpis ppt powerpoint presentation styles. This is a four stage process. The stages in this process are finance, marketing, management, investment, analysis.
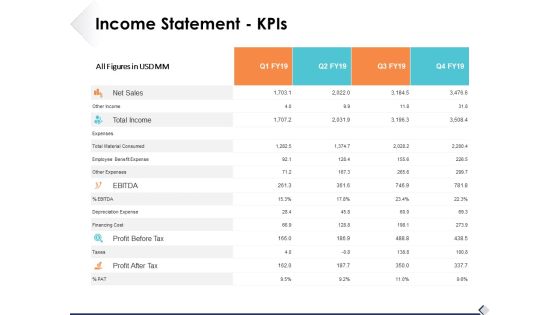
Income Statement Kpis Ppt PowerPoint Presentation Professional Template
This is a income statement kpis ppt powerpoint presentation professional template. This is a four stage process. The stages in this process are business, management, strategy, analysis, icons.

Balance Sheet Kpis Ppt PowerPoint Presentation Summary Layouts
This is a balance sheet kpis ppt powerpoint presentation summary layouts. This is a four stage process. The stages in this process are business, icons, management, strategy, analysis.
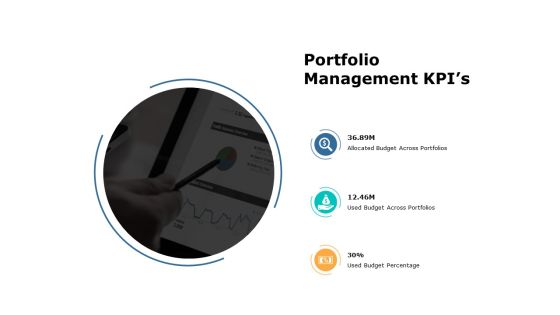
Portfolio Management Kpis Ppt PowerPoint Presentation Summary Gallery
This is a portfolio management kpis ppt powerpoint presentation summary gallery. This is a three stage process. The stages in this process are marketing, business, management.
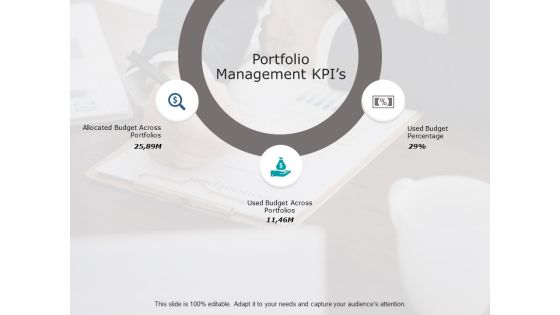
Portfolio Management Kpis Ppt PowerPoint Presentation Infographic Template Smartart
This is a portfolio management kpis ppt powerpoint presentation infographic template smartart. This is a three stage process. The stages in this process are business, management, marketing, process.
Online Advertising KPIS Ppt PowerPoint Presentation Infographics Cpb
Presenting this set of slides with name online advertising kpis ppt powerpoint presentation infographics cpb. This is a three stage process. The stages in this process are online advertising kpis. This is a completely editable PowerPoint presentation and is available for immediate download. Download now and impress your audience.
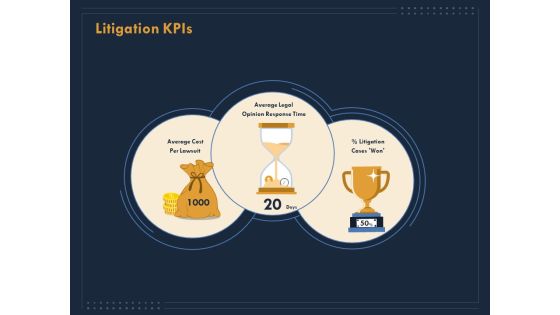
Enterprise Review Litigation Kpis Ppt Gallery Graphics Download PDF
Presenting enterprise review litigation kpis ppt gallery graphics download pdf to provide visual cues and insights. Share and navigate important information on three stages that need your due attention. This template can be used to pitch topics like litigation kpis. In addtion, this PPT design contains high resolution images, graphics, etc, that are easily editable and available for immediate download.
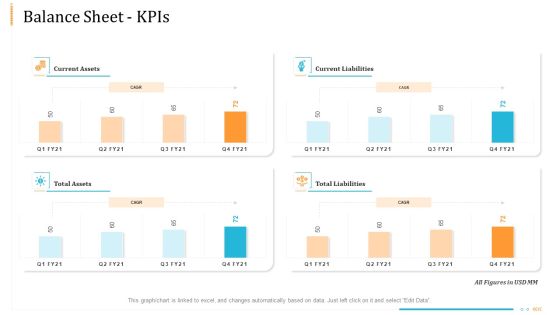
Enterprise Examination And Inspection Balance Sheet Kpis Designs PDF
Deliver and pitch your topic in the best possible manner with this enterprise examination and inspection balance sheet KPIs designs pdf. Use them to share invaluable insights on current assets, total liabilities, balance sheet KPIs and impress your audience. This template can be altered and modified as per your expectations. So, grab it now.
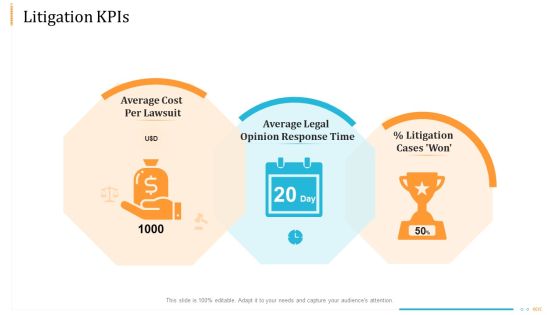
Enterprise Examination And Inspection Litigation Kpis Guidelines PDF
This is a enterprise examination and inspection litigation KPIs guidelines pdf template with various stages. Focus and dispense information on three stages using this creative set, that comes with editable features. It contains large content boxes to add your information on topics like litigation KPIs. You can also showcase facts, figures, and other relevant content using this PPT layout. Grab it now.
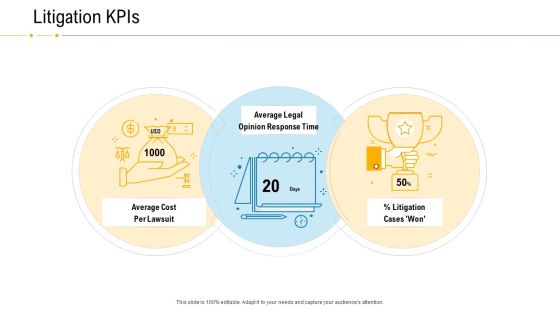
Financial Due Diligence For Business Organization Litigation Kpis Professional PDF
Presenting financial due diligence for business organization litigation kpis professional pdf to provide visual cues and insights. Share and navigate important information on three stages that need your due attention. This template can be used to pitch topics like litigation kpis. In addtion, this PPT design contains high resolution images, graphics, etc, that are easily editable and available for immediate download.
Employee Competency Management With Kpis Icon Slides PDF
Persuade your audience using this employee competency management with kpis icon slides pdf. This PPT design covers four stages, thus making it a great tool to use. It also caters to a variety of topics including employee competency management with kpis icon. Download this PPT design now to present a convincing pitch that not only emphasizes the topic but also showcases your presentation skills.
Quarterly Employee Engagement Analysis Kpis Icon Themes PDF
Persuade your audience using this Quarterly Employee Engagement Analysis Kpis Icon Themes PDF. This PPT design covers three stages, thus making it a great tool to use. It also caters to a variety of topics including Quarterly Employee Engagement, Analysis Kpis Icon. Download this PPT design now to present a convincing pitch that not only emphasizes the topic but also showcases your presentation skills.

Employee Development Program Assessment Kpis Icon Ppt Ideas Shapes PDF
Showcasing this set of slides titled Employee Development Program Assessment Kpis Icon Ppt Ideas Shapes PDF. The topics addressed in these templates are Employee Development, Program Assessment, Kpis Icon. All the content presented in this PPT design is completely editable. Download it and make adjustments in color, background, font etc. as per your unique business setting.

E Mail Marketing Campaign Outcomes Kpis Result Analysis Mockup PDF
Showcasing this set of slides titled E Mail Marketing Campaign Outcomes Kpis Result Analysis Mockup PDF. The topics addressed in these templates are Marketing Campaign, Outcomes Kpis, Result Analysis. All the content presented in this PPT design is completely editable. Download it and make adjustments in color, background, font etc. as per your unique business setting.

Icons Sldie Enhancing Client Experience By Evaluating Kpis Graphics PDF
Help your business to create an attention-grabbing presentation using our Icons Sldie Enhancing Client Experience By Evaluating Kpis Graphics PDF set of slides. The slide contains innovative icons that can be flexibly edited. Choose this Icons Sldie Enhancing Client Experience By Evaluating Kpis Graphics PDF template to create a satisfactory experience for your customers. Go ahead and click the download button.
Icon For Comparing Industrial Sector On Similar Kpis Template PDF
Presenting Icon For Comparing Industrial Sector On Similar Kpis Template PDF to dispense important information. This template comprises three stages. It also presents valuable insights into the topics including Comparing Industrial, Sector Similar Kpis. This is a completely customizable PowerPoint theme that can be put to use immediately. So, download it and address the topic impactfully.
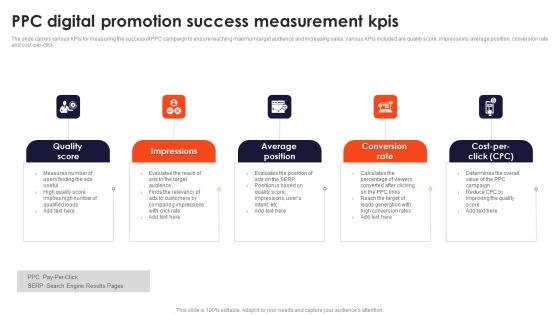
PPC Digital Promotion Success Measurement Kpis Pictures PDF
The slide carries various KPIs for measuring the success of PPC campaign to ensure reaching maximum target audience and increasing sales. Various KPIs included are quality score, impressions, average position, conversion rate and cost-per-click. Presenting PPC Digital Promotion Success Measurement Kpis Pictures PDF to dispense important information. This template comprises Five stages. It also presents valuable insights into the topics including Quality Score, Impressions, Average Position. This is a completely customizable PowerPoint theme that can be put to use immediately. So, download it and address the topic impactfully.

Growth Stage In Product Lifecycle With Tracking Kpis Diagrams PDF
This slide covers summary of growth stage in PLC to provide insights on KPIs essential for tracking product. It includes tracking KPIs. Want to ace your presentation in front of a live audience Our Growth Stage In Product Lifecycle With Tracking Kpis Diagrams PDF can help you do that by engaging all the users towards you. Slidegeeks experts have put their efforts and expertise into creating these impeccable powerpoint presentations so that you can communicate your ideas clearly. Moreover, all the templates are customizable, and easy to edit and downloadable. Use these for both personal and commercial use.

Kpis To Measure Personalized Website Marketing Campaign Results Download PDF
This slide showcases KPIs that can help organization in measure the results of personalized website marketing campaigns. KPIs include number of sessions, bounce rate, average session duration, number of signups, visit to signup rate and sales generated There are so many reasons you need a Kpis To Measure Personalized Website Marketing Campaign Results Download PDF. The first reason is you can not spend time making everything from scratch, Thus, Slidegeeks has made presentation templates for you too. You can easily download these templates from our website easily.
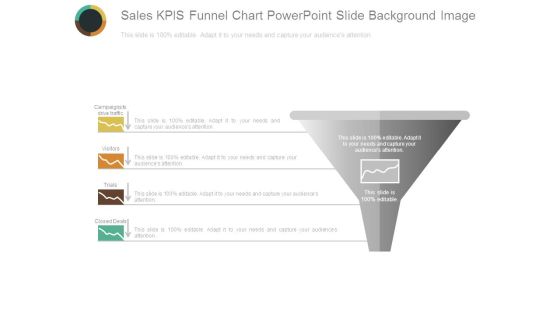
Sales Kpis Funnel Chart Powerpoint Slide Background Image
This is a sales kpis funnel chart powerpoint slide background image. This is a one stage process. The stages in this process are campaigns to drive traffic, visitors, trials, closed deals, sales.

Kpis For Media Campaigns Evaluation Ppt PowerPoint Presentation Deck
This is a kpis for media campaigns evaluation ppt powerpoint presentation deck. This is a three stage process. The stages in this process are traffic, engagement, conversion, website visitors.

Pandl Kpis Tabular Form Ppt PowerPoint Presentation Visual Aids
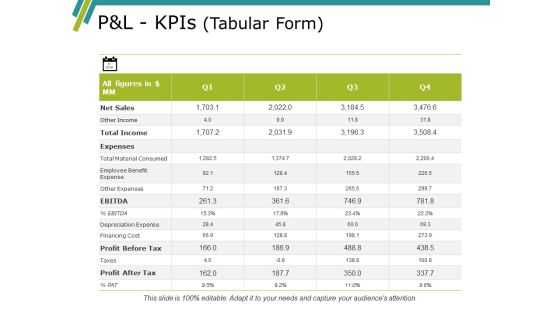
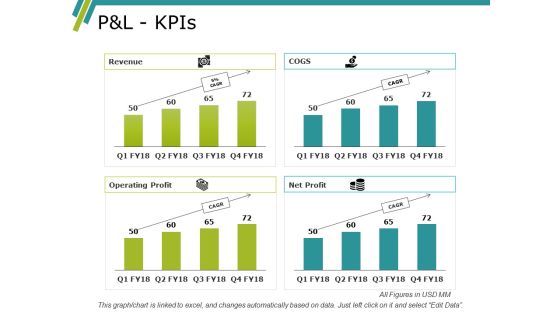
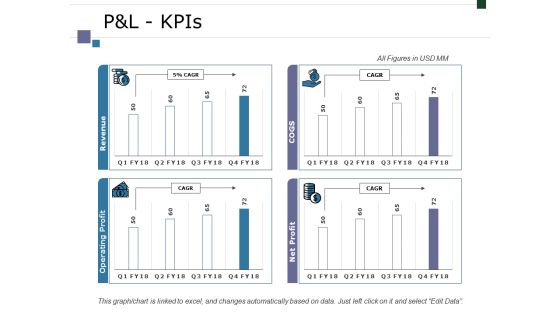
This is a pandl kpis tabular form ppt powerpoint presentation visual aids. This is a four stage process. The stages in this process are revenue, cogs, operating profit, net profit.

Cash Flow Statement Kpis Ppt PowerPoint Presentation Deck
This is a cash flow statement kpis ppt powerpoint presentation deck. This is a four stage process. The stages in this process are operations, financing activities, investing activities, net increase in cash.

Balance Sheet Kpis Ppt PowerPoint Presentation Model Example Topics
This is a balance sheet kpis ppt powerpoint presentation model example topics. This is a four stage process. The stages in this process are shareholders equity, trade payables, other current liabilities, short term provisions, current liabilities, total liabilities.
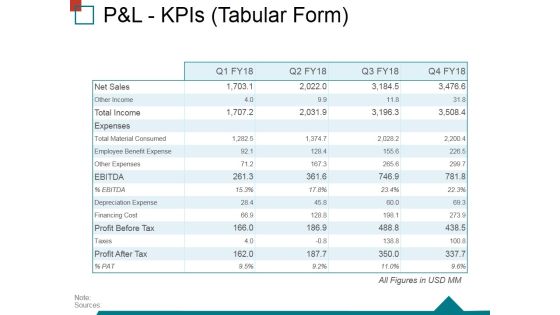
Pandl Kpis Tabular Form Ppt PowerPoint Presentation Ideas Structure
This is a pandl kpis tabular form ppt powerpoint presentation ideas structure. This is a four stage process. The stages in this process are operating profit, revenue, cogs, net profit.

Customer Service Kpis Template 1 Ppt PowerPoint Presentation Gallery Mockup
This is a customer service kpis template 1 ppt powerpoint presentation gallery mockup. This is a ten stage process. The stages in this process are brand description, employee productivity measurement, comparison with business rival.

Customer Service Kpis Template 2 Ppt PowerPoint Presentation Show Structure
This is a customer service kpis template 2 ppt powerpoint presentation show structure. This is a four stage process. The stages in this process are tickets by week, tickets by group, tickets by time of the day, tickets by medium.

Balance Sheet Kpis Template 2 Ppt PowerPoint Presentation Ideas Graphics
This is a balance sheet kpis template 2 ppt powerpoint presentation ideas graphics. This is a four stage process. The stages in this process are current assets, current liabilities, total assets, total liabilities.

Balance Sheet Kpis Template 3 Ppt PowerPoint Presentation Slides Brochure
This is a balance sheet kpis template 3 ppt powerpoint presentation slides brochure. This is a four stage process. The stages in this process are current assets, current liabilities, total liabilities, total assets.

Balance Sheet Kpis Tabular Form Ppt PowerPoint Presentation Professional Display
This is a balance sheet kpis tabular form ppt powerpoint presentation professional display. This is a four stage process. The stages in this process are current assets, current liabilities, total assets, total liabilities.

Balance Sheet Kpis Template Ppt PowerPoint Presentation Slides Inspiration
This is a balance sheet kpis template ppt powerpoint presentation slides inspiration. This is a four stage process. The stages in this process are shareholders equity, short term borrowings, trade payables, other current liabilities.

Balance Sheet Kpis Ppt PowerPoint Presentation Infographics Example File
This is a balance sheet kpis ppt powerpoint presentation infographics example file. This is a four stage process. The stages in this process are current investments, inventories, trade receivables, cash and bank balances, current assets.
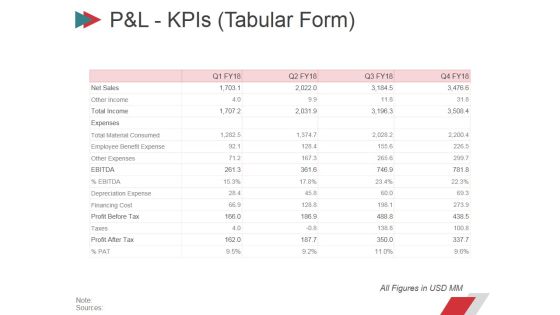
Pandl Kpis Tabular Form Ppt PowerPoint Presentation Summary Layout
This is a pandl kpis tabular form ppt powerpoint presentation summary layout. This is a four stage process. The stages in this process are revenue, cogs, operating profit, net profit.

Balance Sheet Kpis Template 1 Ppt PowerPoint Presentation Diagram Ppt
This is a balance sheet kpis template 1 ppt powerpoint presentation diagram ppt. This is a four stage process. The stages in this process are non current investments, current investments, inventories, trade receivables, trade receivables.

Balance Sheet Kpis Template 2 Ppt PowerPoint Presentation Portfolio Portrait
This is a balance sheet kpis template 2 ppt powerpoint presentation portfolio portrait. This is a four stage process. The stages in this process are shareholders equity, non current liabilities, short term borrowings, trade payables, other current liabilities.

Balance Sheet Kpis Template 2 Ppt PowerPoint Presentation Portfolio Example
This is a balance sheet kpis template 2 ppt powerpoint presentation portfolio example. This is a four stage process. The stages in this process are non current investments, long term loans and advances, other non current assets, current investments, inventories.

Balance Sheet Kpis Continued Ppt PowerPoint Presentation Templates
This is a balance sheet kpis continued ppt powerpoint presentation templates. This is a four stage process. The stages in this process are long term loans and advances, current investments, inventories, trade receivables, cash and bank balances.

Balance Sheet Kpis Tabular Form Ppt PowerPoint Presentation Infographics Good
This is a balance sheet kpis tabular form ppt powerpoint presentation infographics good. This is a four stage process. The stages in this process are current assets, current liabilities, total assets, total liabilities.

Balance Sheet Kpis Ppt PowerPoint Presentation Portfolio Microsoft
This is a balance sheet kpis ppt powerpoint presentation portfolio microsoft. This is a four stage process. The stages in this process are shareholders equity, non current liabilities, short term borrowings, trade payables, other current liabilities.

Pandl Kpis Tabular Form Ppt PowerPoint Presentation File Design Templates
This is a pandl kpis tabular form ppt powerpoint presentation file design templates. This is a four stage process. The stages in this process are revenue, cogs, operating profit, net profit.

Pandl Kpis Ppt PowerPoint Presentation Infographic Template Layout
This is a pandl kpis ppt powerpoint presentation infographic template layout. This is a four stage process. The stages in this process are net sales, other income, total income, expenses, total material consumed.

Balance Sheet Kpis Ppt PowerPoint Presentation Ideas Graphics Pictures
This is a balance sheet kpis ppt powerpoint presentation ideas graphics pictures. This is a four stage process. The stages in this process are trade payables, other current liabilities, short term provisions, current liabilities, total liabilities.
Pandl Kpis Tabular Form Ppt PowerPoint Presentation Gallery Icon
This is a pandl kpis tabular form ppt powerpoint presentation gallery icon. This is a four stage process. The stages in this process are revenue, cogs, operating profit, net profit.

P And L Kpis Ppt PowerPoint Presentation Portfolio Slide
This is a p and l kpis ppt powerpoint presentation portfolio slide. This is a four stage process. The stages in this process are ebitda, profit before tax, profit after tax, expenses, net sales.

Channel Kpis Template Ppt PowerPoint Presentation Show Portfolio
This is a channel kpis template ppt powerpoint presentation show portfolio. This is a four stage process. The stages in this process are sales density, personnel cost, real estate cost, inventory turnover.

Balance Sheet Kpis Ppt PowerPoint Presentation Infographics Inspiration
This is a balance sheet kpis ppt powerpoint presentation infographics inspiration. This is a four stage process. The stages in this process are shareholders equity, trade payables, other current liabilities, current liabilities.
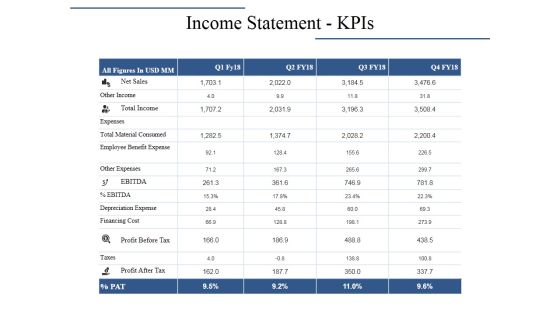
Income Statement Kpis Ppt PowerPoint Presentation Layouts Graphics Pictures
This is a income statement kpis ppt powerpoint presentation layouts graphics pictures. This is a four stage process. The stages in this process are net sales, total income, other income, profit before tax, expenses.

Balance Sheet Kpis Ppt PowerPoint Presentation Show Designs
This is a balance sheet kpis ppt powerpoint presentation show designs. This is a four stage process. The stages in this process are shareholders equity, non current liabilities, trade payables, total liabilities.
Income Statement Kpis Ppt PowerPoint Presentation Icon Background Images
This is a income statement kpis ppt powerpoint presentation icon background images. This is a four stage process. The stages in this process are net sales, other income, expenses, other expenses, total material consumed.

Balance Sheet Kpis Ppt PowerPoint Presentation Gallery Brochure
This is a balance sheet kpis ppt powerpoint presentation gallery brochure. This is a four stage process. The stages in this process are shareholders equity, non current liabilities, short term borrowings, trade payables, other current liabilities.

Income Statement Kpis Ppt PowerPoint Presentation Styles Clipart Images
This is a income statement kpis ppt powerpoint presentation styles clipart images. This is a four stage process. The stages in this process are net sales, other income, total income, expenses, total material consumed.

Cash Flow Statement Kpis Ppt PowerPoint Presentation File Styles
This is a cash flow statement kpis ppt powerpoint presentation file styles. This is a four stage process. The stages in this process are management, business, marketing, compere, strategy.

Cash Flow Statement Kpis Template 1 Ppt PowerPoint Presentation Templates
This is a cash flow statement kpis template 1 ppt powerpoint presentation templates. This is a four stage process. The stages in this process are cash flow from operations, cash flow from investing activities, cash flow from financing activities.

Cash Flow Statement Kpis Ppt PowerPoint Presentation Summary Graphics
This is a cash flow statement kpis ppt powerpoint presentation summary graphics. This is a four stage process. The stages in this process are business, compare sheet, management, analysis, strategy.
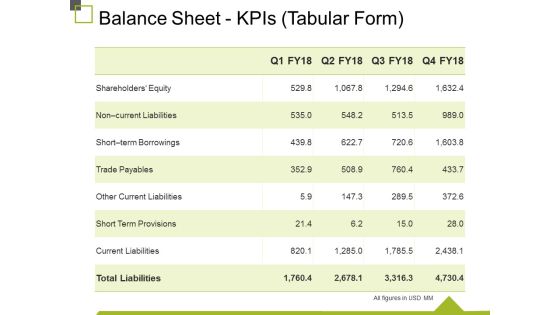
Balance Sheet Kpis Tabular Form Ppt PowerPoint Presentation Gallery Example
This is a balance sheet kpis tabular form ppt powerpoint presentation gallery example. This is a four stage process. The stages in this process are trade payables, other current liabilities, short term provisions, current liabilities, total liabilities.

Balance Sheet Kpis Ppt PowerPoint Presentation Visual Aids Inspiration
This is a balance sheet kpis ppt powerpoint presentation visual aids inspiration. This is a four stage process. The stages in this process are current assets, current liabilities, total liabilities, total assets, business.

Cash Flow Statement Kpis Ppt PowerPoint Presentation Ideas Graphics
This is a cash flow statement kpis ppt powerpoint presentation ideas graphics. This is a four stage process. The stages in this process are operation, financing activities, net increase in cash, investing activities, business.
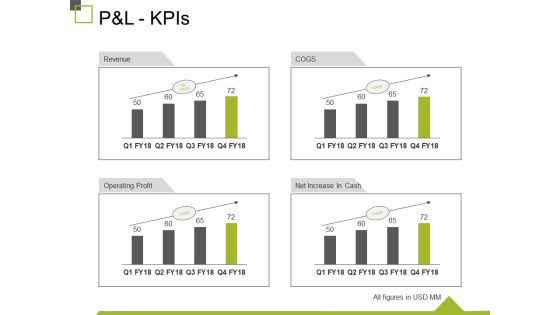
P And L Kpis Ppt PowerPoint Presentation Show Design Inspiration
This is a p and l kpis ppt powerpoint presentation show design inspiration. This is a four stage process. The stages in this process are revenue, operating profit, cogs, net increase in cash, business.

Balance Sheet Kpis Template 1 Ppt PowerPoint Presentation Gallery Visuals
This is a balance sheet kpis template 1 ppt powerpoint presentation gallery visuals. This is a four stage process. The stages in this process are business, table, management, analysis, success.

Balance Sheet Kpis Template 2 Ppt PowerPoint Presentation Ideas Show
This is a balance sheet kpis template 2 ppt powerpoint presentation ideas show. This is a four stage process. The stages in this process are current assets, total assets, total liabilities, current liabilities.
Balance Sheet Kpis Tabular Form Ppt PowerPoint Presentation Show Icons
This is a balance sheet kpis tabular form ppt powerpoint presentation show icons. This is a four stage process. The stages in this process are current assets, total assets, total liabilities, current liabilities.

Balance Sheet Kpis Ppt PowerPoint Presentation Styles Clipart
This is a balance sheet kpis ppt powerpoint presentation styles clipart. This is a four stage process. The stages in this process are current liabilities, short term provisions, other current liabilities, trade payables, shareholders equity.

Pandl Kpis Tabular Form Ppt PowerPoint Presentation Pictures Visual Aids
This is a pandl kpis tabular form ppt powerpoint presentation pictures visual aids. This is a four stage process. The stages in this process are revenue, operating profit, cogs, net profit.
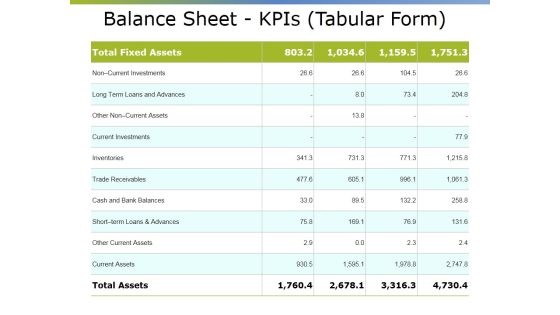
Balance Sheet Kpis Tabular Form Ppt PowerPoint Presentation Outline Gridlines
This is a balance sheet kpis tabular form ppt powerpoint presentation outline gridlines. This is a four stage process. The stages in this process are long term loans and advances, current investments, inventories, trade receivables, cash and bank balances.

Balance Sheet Kpis Template 1 Ppt PowerPoint Presentation Gallery Ideas
This is a balance sheet kpis template 1 ppt powerpoint presentation gallery ideas. This is a four stage process. The stages in this process are total fixed assets, non current investments, long term loans and advances, current investments, inventories.

Balance Sheet Kpis Template Ppt PowerPoint Presentation Summary Portfolio
This is a balance sheet kpis template ppt powerpoint presentation summary portfolio. This is a four stage process. The stages in this process are current liabilities, short term provisions, other current liabilities, trade payables, total liabilities.

Balance Sheet Kpis Ppt PowerPoint Presentation Layouts Design Ideas
This is a balance sheet kpis ppt powerpoint presentation layouts design ideas. This is a four stage process. The stages in this process are current assets, current liabilities, total assets, total liabilities.
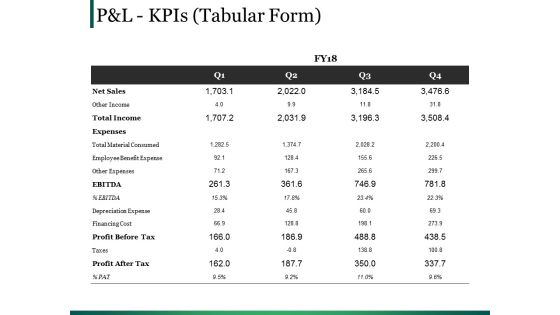
Pandl Kpis Template 1 Ppt PowerPoint Presentation Infographics Tips
This is a pandl kpis template 1 ppt powerpoint presentation infographics tips. This is a four stage process. The stages in this process are ebitda, total income, table, cost, management.
Pandl Kpis Template Ppt PowerPoint Presentation Model Icon
This is a pandl kpis template ppt powerpoint presentation model icon. This is a four stage process. The stages in this process are revenue, cogs, operating profit, net profit.

Balance Sheet Kpis Ppt PowerPoint Presentation Infographics Good
This is a balance sheet kpis ppt powerpoint presentation infographics good. This is a four stage process. The stages in this process are current assets, current liabilities, total assets, total liabilities.
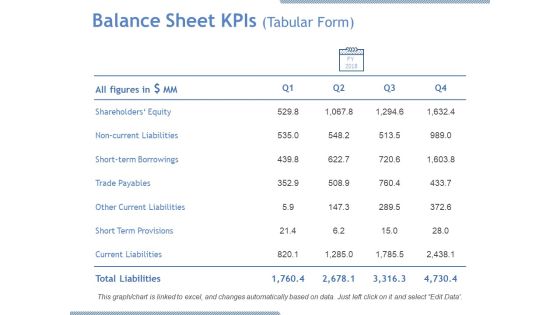
Balance Sheet Kpis Tabular Form Ppt PowerPoint Presentation Gallery Examples
This is a balance sheet kpis tabular form ppt powerpoint presentation gallery examples. This is a four stage process. The stages in this process are shareholders equity, trade payables, short term provisions, current liabilities, total liabilities.

Balance Sheet Kpis Ppt PowerPoint Presentation Infographic Template Inspiration
This is a balance sheet kpis ppt powerpoint presentation infographic template inspiration. This is a four stage process. The stages in this process are current assets, current liabilities, total assets, total liabilities.

Cash Flow Statement Kpis Ppt PowerPoint Presentation Model Samples
This is a cash flow statement kpis ppt powerpoint presentation model samples. This is a four stage process. The stages in this process are operations, financing activities, investing activities, increase in cash.

Litigation Kpis Ppt PowerPoint Presentation Layouts Clipart Images
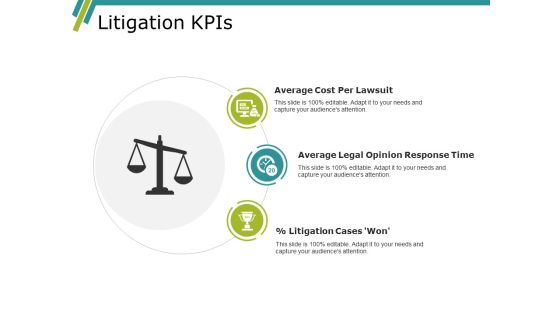
This is a litigation kpis ppt powerpoint presentation layouts clipart images. This is a three stage process. The stages in this process are average cost per lawsuit, litigation cases won, average legal opinion response time.

P And L Kpis Ppt PowerPoint Presentation Designs Download
This is a p and l kpis ppt powerpoint presentation designs download. This is a four stage process. The stages in this process are revenue, cogs, operating profit, net profit.

Balance Sheet Kpis Template Ppt PowerPoint Presentation Gallery Inspiration
This is a balance sheet kpis template ppt powerpoint presentation gallery inspiration. This is a four stage process. The stages in this process are all figures in, non current liabilities, short term borrowings, trade payables, other current liabilities.

Balance Sheet Kpis Ppt PowerPoint Presentation Inspiration Information
This is a balance sheet kpis ppt powerpoint presentation inspiration information. This is a four stage process. The stages in this process are long term loans and advances, current investments, inventories, trade receivables.

Cash Flow Statement Kpis Template Ppt PowerPoint Presentation Pictures Diagrams
This is a cash flow statement kpis template ppt powerpoint presentation pictures diagrams. This is a four stage process. The stages in this process are operations, financing activities, investing activities, net increase in cash.
Pandl Kpis Template Ppt PowerPoint Presentation Gallery Summary
This is a pandl kpis template ppt powerpoint presentation gallery summary. This is a four stage process. The stages in this process are revenue, cogs, operating profit, net profit.
Pandl Kpis Ppt PowerPoint Presentation Slides Designs Download
This is a pandl kpis ppt powerpoint presentation slides designs download. This is a four stage process. The stages in this process are net sales, table, planning, cost, management.
Litigation Kpis Ppt PowerPoint Presentation Layouts Graphics Template
This is a litigation kpis ppt powerpoint presentation layouts graphics template. This is a three stage process. The stages in this process are average cost per lawsuit, average legal opinion response time, litigation cases.

Balance Sheet Kpis Tabular Formcont Ppt PowerPoint Presentation Infographics Visuals
This is a balance sheet kpis tabular formcont ppt powerpoint presentation infographics visuals. This is a four stage process. The stages in this process are noncurrent, investments, long term loans and advances, current investments, inventories.

Balance Sheet Kpis Ppt PowerPoint Presentation Infographic Template Designs
This is a balance sheet kpis ppt powerpoint presentation infographic template designs. This is a four stage process. The stages in this process are business, marketing, finance, graph, strategy.

Pandl Kpis Tabular Form Ppt PowerPoint Presentation Outline Background
This is a pandl kpis tabular form ppt powerpoint presentation outline background. This is a four stage process. The stages in this process are net sales, expenses, ebitda, profit before tax, profit after tax.
Pandl Kpis Ppt PowerPoint Presentation Infographic Template Graphics Tutorials
This is a pandl kpis ppt powerpoint presentation infographic template graphics tutorials. This is a four stage process. The stages in this process are business, marketing, finance, graph, strategy.

Balance Sheet Kpis Continue Ppt PowerPoint Presentation Slides File Formats
This is a balance sheet kpis continue ppt powerpoint presentation slides file formats. This is a four stage process. The stages in this process are balance sheet, finance, marketing, strategy, business.

Balance Sheet Kpis Template 1 Ppt PowerPoint Presentation Pictures Grid
This is a balance sheet kpis template 1 ppt powerpoint presentation pictures grid. This is a four stage process. The stages in this process are current assets, current liabilities, total assets, total liabilities.

Balance Sheet Kpis Template 2 Ppt PowerPoint Presentation Portfolio Icons
This is a balance sheet kpis template 2 ppt powerpoint presentation portfolio icons. This is a four stage process. The stages in this process are balance sheet, finance, marketing, strategy, business.
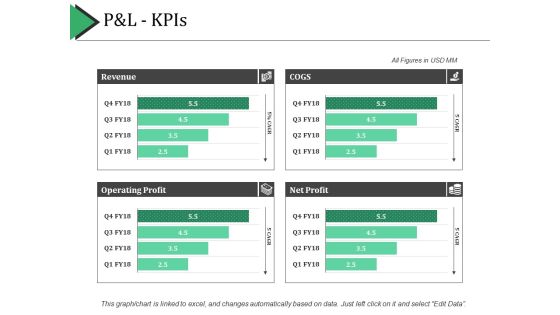
P And L Kpis Ppt PowerPoint Presentation Show Example Introduction
This is a p and l kpis ppt powerpoint presentation show example introduction. This is a four stage process. The stages in this process are revenue, cogs, net profit, operating profit.

Balance Sheet Kpis Ppt PowerPoint Presentation Model Layout Ideas
This is a balance sheet kpis ppt powerpoint presentation model layout ideas. This is a four stage process. The stages in this process are current assets, current liabilities, total assets, total liabilities.
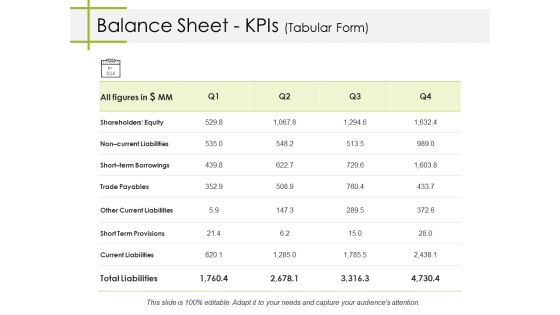
Balance Sheet Kpis Tabular Form Ppt PowerPoint Presentation Pictures Gridlines
This is a balance sheet kpis tabular form ppt powerpoint presentation pictures gridlines. This is a four stage process. The stages in this process are trade payables, other current liabilities, short term provisions, current liabilities, short term borrowings.

Balance Sheet Kpis Ppt PowerPoint Presentation Summary Designs Download
This is a balance sheet kpis ppt powerpoint presentation summary designs download. This is a four stage process. The stages in this process are current assets, current liabilities, total liabilities, operating profit, business.

Cash Flow Statement Kpis Ppt PowerPoint Presentation Styles Themes
This is a cash flow statement kpis ppt powerpoint presentation styles themes. This is a four stage process. The stages in this process are business, operations, operating profit, total liabilities, current liabilities.
Pandl Kpis Tabular Form Ppt PowerPoint Presentation Icon
This is a pandl kpis tabular form ppt powerpoint presentation icon. This is a four stage process. The stages in this process are business, net sales, total income, expenses, profit before tax, profit after tax.

Cash Flow Statement Kpis Ppt PowerPoint Presentation Pictures Graphics
This is a cash flow statement kpis ppt powerpoint presentation pictures graphics. This is a four stage process. The stages in this process are business, marketing, graph, finance, strategy.
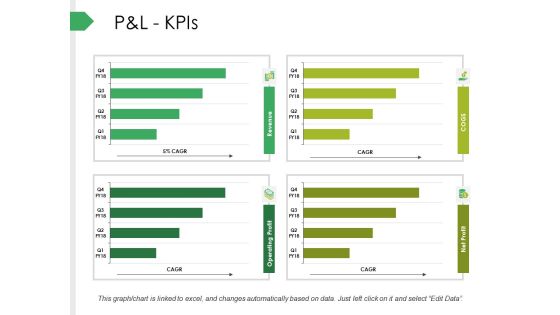
P And L Kpis Ppt PowerPoint Presentation Infographics Background
This is a p and l kpis ppt powerpoint presentation infographics background. This is a four stage process. The stages in this process are net sales, expenses, ebitda, profit before tax, profit after tax.

Balance Sheet Kpis Template 1 Ppt PowerPoint Presentation Show Inspiration
This is a balance sheet kpis template 1 ppt powerpoint presentation show inspiration. This is a four stage process. The stages in this process are business, marketing, graph, current liabilities, total liabilities.

Balance Sheet Kpis Template 2 Ppt PowerPoint Presentation Gallery Example
This is a balance sheet kpis template 2 ppt powerpoint presentation gallery example. This is a four stage process. The stages in this process are business, marketing, graph, current liabilities, total liabilities.
 Home
Home