Key Performance Indicators
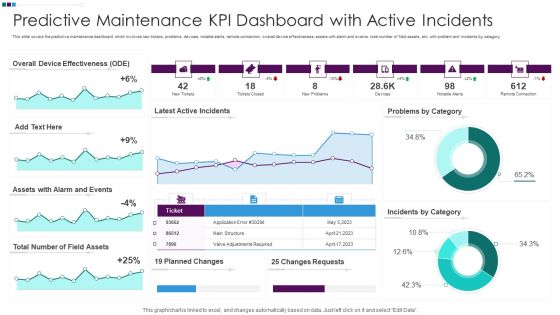
Predictive Maintenance KPI Dashboard With Active Incidents Ppt Slides Backgrounds PDF
This slide covers the predictive maintenance dashboard which involves new tickets, problems, devices, notable alerts, remote connection, overall device effectiveness, assets with alarm and events, total number of field assets, etc. with problem and incidents by category. Showcasing this set of slides titled Predictive Maintenance KPI Dashboard With Active Incidents Ppt Slides Backgrounds PDF. The topics addressed in these templates are Overall Device Effectiveness, Assets Alarm Events, Total Number Field. All the content presented in this PPT design is completely editable. Download it and make adjustments in color, background, font etc. as per your unique business setting.
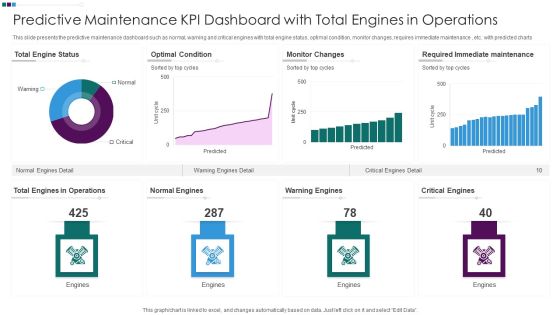
Predictive Maintenance KPI Dashboard With Total Engines In Operations Ppt Professional Inspiration PDF
This slide presents the predictive maintenance dashboard such as normal, warning and critical engines with total engine status, optimal condition, monitor changes, requires immediate maintenance , etc. with predicted charts. Pitch your topic with ease and precision using this Predictive Maintenance KPI Dashboard With Total Engines In Operations Ppt Professional Inspiration PDF. This layout presents information on Total Engine Status, Optimal Condition Monitor, Changes Warning Engines, Required Immediate Maintenance. It is also available for immediate download and adjustment. So, changes can be made in the color, design, graphics or any other component to create a unique layout.
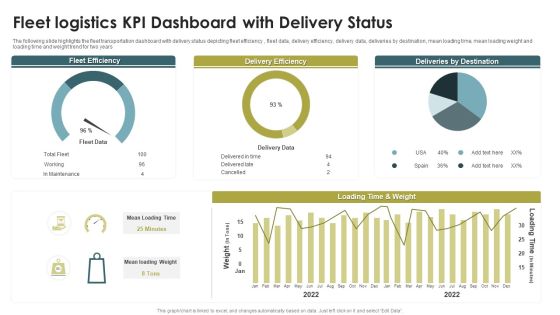
Fleet Logistics KPI Dashboard With Delivery Status Ppt Model Guide PDF
The following slide highlights the fleet transportation dashboard with delivery status depicting fleet efficiency , fleet data, delivery efficiency, delivery data, deliveries by destination, mean loading time, mean loading weight and loading time and weight trend for two years. Pitch your topic with ease and precision using this Fleet Logistics KPI Dashboard With Delivery Status Ppt Model Guide PDF. This layout presents information on Fleet Efficiency, Delivery Efficiency, Deliveries By Destination. It is also available for immediate download and adjustment. So, changes can be made in the color, design, graphics or any other component to create a unique layout.
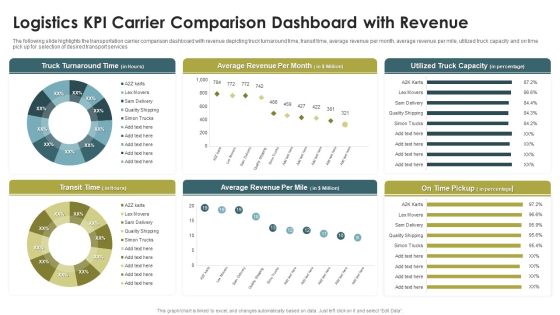
Logistics KPI Carrier Comparison Dashboard With Revenue Ppt Infographics Portfolio PDF
The following slide highlights the transportation carrier comparison dashboard with revenue depicting truck turnaround time, transit time, average revenue per month, average revenue per mile, utilized truck capacity and on time pick up for selection of desired transport services. Pitch your topic with ease and precision using this Logistics KPI Carrier Comparison Dashboard With Revenue Ppt Infographics Portfolio PDF. This layout presents information on Truck Turnaround Time, Average Revenue, Per Month, Transit Time. It is also available for immediate download and adjustment. So, changes can be made in the color, design, graphics or any other component to create a unique layout.

Dashboard For International Logistics KPI Via Third Party Carriers Rules PDF
The following slide highlights the dashboard for international transportation via third party carriers illustrating total shipment, payment method, revenue, shipment status and shipment details such as company, tracking id, Item, weight, address, payment, status to monitor the transportation. Showcasing this set of slides titled Dashboard For International Logistics KPI Via Third Party Carriers Rules PDF. The topics addressed in these templates are Total Shipment, Payment Method, Revenue, 20. All the content presented in this PPT design is completely editable. Download it and make adjustments in color, background, font etc. as per your unique business setting.

Dashboard For Logistics KPI Management System Of Logistics Company Infographics PDF
The following slide highlights the dashboard for transportation management system of logistics company illustrating shipment status of 30 days, shipment by carrier, on time shipment, average shipment cost, carrier efficiency and shipment count. Pitch your topic with ease and precision using this Dashboard For Logistics KPI Management System Of Logistics Company Infographics PDF. This layout presents information on Shipment Status, Shipment By Carrier, On Time Shipment. It is also available for immediate download and adjustment. So, changes can be made in the color, design, graphics or any other component to create a unique layout.
KPI Dashboard For Tracking Consumer Journey Touchpoints Consumer Contact Point Guide Template PDF
This slide covers a touchpoint dashboard with different customer journey stages. It also includes a detailed evaluation of each stage on the basis of experience, importance, etc. Take your projects to the next level with our ultimate collection of KPI Dashboard For Tracking Consumer Journey Touchpoints Consumer Contact Point Guide Template PDF. Slidegeeks has designed a range of layouts that are perfect for representing task or activity duration, keeping track of all your deadlines at a glance. Tailor these designs to your exact needs and give them a truly corporate look with your own brand colors they well make your projects stand out from the rest.

System Deployment Project Customer Relationship Management Software Kpi Dashboard Rules PDF
This slide represents the dashboard showing details related to customer relationship management software. It includes details related to outbound sales, contracts closed, average contract value etc. Present like a pro with System Deployment Project Customer Relationship Management Software Kpi Dashboard Rules PDF Create beautiful presentations together with your team, using our easy-to-use presentation slides. Share your ideas in real-time and make changes on the fly by downloading our templates. So whether youre in the office, on the go, or in a remote location, you can stay in sync with your team and present your ideas with confidence. With Slidegeeks presentation got a whole lot easier. Grab these presentations today.

Strategic Plan For Enterprise Customer Relationship Management Software KPI Dashboard Infographics PDF
This slide represents the dashboard showing details related to customer relationship management software. It includes details related to outbound sales, contracts closed, average contract value etc. Present like a pro with Strategic Plan For Enterprise Customer Relationship Management Software KPI Dashboard Infographics PDF Create beautiful presentations together with your team, using our easy-to-use presentation slides. Share your ideas in real-time and make changes on the fly by downloading our templates. So whether youre in the office, on the go, or in a remote location, you can stay in sync with your team and present your ideas with confidence. With Slidegeeks presentation got a whole lot easier. Grab these presentations today.

KPI Dashboard To Assess Deals In Mergers And Acquisitions Strategy Rules PDF
Following slide showcases dashboard for mergers and acquisitions to measure effects of milestones to confirm integration plan accordingly. It presents information related to deals by types, country, etc. Pitch your topic with ease and precision using this KPI Dashboard To Assess Deals In Mergers And Acquisitions Strategy Rules PDF. This layout presents information on Status, Strategy, Minority Equity Stake. It is also available for immediate download and adjustment. So, changes can be made in the color, design, graphics or any other component to create a unique layout.
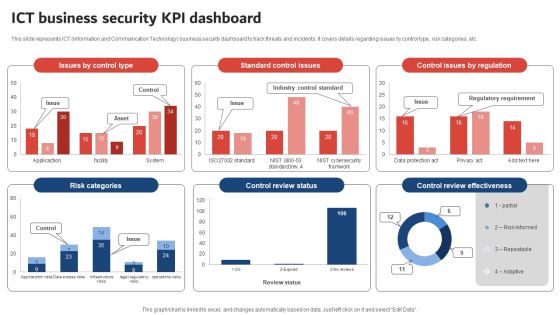
Execution Of ICT Strategic Plan ICT Business Security KPI Dashboard Designs PDF
This slide represents ICT Information and Communication Technology business security dashboard to track threats and incidents. It covers details regarding issues by control type, risk categories, etc. Boost your pitch with our creative Execution Of ICT Strategic Plan ICT Business Security KPI Dashboard Designs PDF. Deliver an awe inspiring pitch that will mesmerize everyone. Using these presentation templates you will surely catch everyones attention. You can browse the ppts collection on our website. We have researchers who are experts at creating the right content for the templates. So you do not have to invest time in any additional work. Just grab the template now and use them.

KPI Dashboard To Track First Time Leads Ppt PowerPoint Presentation File Pictures PDF
The following slide showcases dashboard which can help businesses assess information about newly generated leads. It provides information about leads, permissions gained by source, revenue, sales closed, MailChimp, email, ads, etc. Take your projects to the next level with our ultimate collection of KPI Dashboard To Track First Time Leads Ppt PowerPoint Presentation File Pictures PDF. Slidegeeks has designed a range of layouts that are perfect for representing task or activity duration, keeping track of all your deadlines at a glance. Tailor these designs to your exact needs and give them a truly corporate look with your own brand colors they will make your projects stand out from the rest.

Automating Supply Chain Dashboard For Tracking Impact Of Warehouse House Automation Graphics PDF
This slide covers the dashboard with after automation warehouse overview. It include KPIs such as autonomous robots status, robotic arms status, battery level, performance, time to return, etc. Deliver and pitch your topic in the best possible manner with this Automating Supply Chain Dashboard For Tracking Impact Of Warehouse House Automation Graphics PDF. Use them to share invaluable insights on Autonomous Robot, Robotic Arms, Systems Engineer and impress your audience. This template can be altered and modified as per your expectations. So, grab it now.
Warehouse Automation Deployment Dashboard For Tracking Impact Of Warehouse House Infographics PDF
This slide covers the dashboard with after automation warehouse overview. It include KPIs such as autonomous robots status, robotic arms status, battery level, performance, time to return, etc. Deliver and pitch your topic in the best possible manner with this Warehouse Automation Deployment Dashboard For Tracking Impact Of Warehouse House Infographics PDF. Use them to share invaluable insights on Autonomous Robot, Systems Engineer, Warehouse Manager and impress your audience. This template can be altered and modified as per your expectations. So, grab it now.
KPIS Metrics Ppt PowerPoint Presentation Inspiration Graphics Cpb
Presenting this set of slides with name kpis metrics ppt powerpoint presentation inspiration graphics cpb. This is a two stage process. The stages in this process are kpis metrics. This is a completely editable PowerPoint presentation and is available for immediate download. Download now and impress your audience.

CRM Kpis Metrics Ppt Outline Background Designs PDF
This is a crm kpis metrics ppt outline background designs pdf template with various stages. Focus and dispense information on one stages using this creative set, that comes with editable features. It contains large content boxes to add your information on topics like kpis metrics. You can also showcase facts, figures, and other relevant content using this PPT layout. Grab it now.

Customer Relationship Management Action Plan Kpis Metrics Topics PDF
This is a customer relationship management action plan kpis metrics topics pdf template with various stages. Focus and dispense information on one stages using this creative set, that comes with editable features. It contains large content boxes to add your information on topics like KPIs Metrics. You can also showcase facts, figures, and other relevant content using this PPT layout. Grab it now.

Customer Relationship Management Action Plan Kpis Metrics Mockup PDF
Presenting customer relationship management action plan kpis metrics mockup pdf to provide visual cues and insights. Share and navigate important information on one stage that need your due attention. This template can be used to pitch topics like kpis metrics. In addtion, this PPT design contains high resolution images, graphics, etc, that are easily editable and available for immediate download.
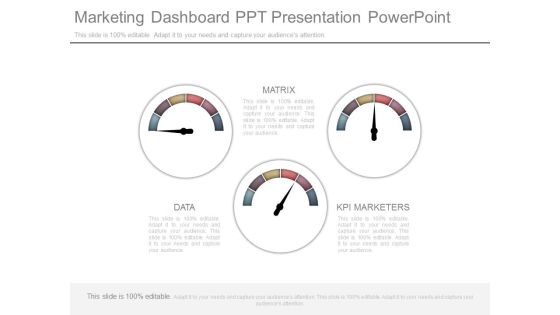
Marketing Dashboard Ppt Presentation Powerpoint
This is a marketing dashboard ppt presentation powerpoint. This is a three stage process. The stages in this process are data, matrix, kpi marketers.

Data Quality Kpis Assessment Metrics For Operational Records Sample PDF
Pitch your topic with ease and precision using this Data Quality Kpis Assessment Metrics For Operational Records Sample PDF. This layout presents information on Data Quality, Assessment Metrics, Operational Records. It is also available for immediate download and adjustment. So, changes can be made in the color, design, graphics or any other component to create a unique layout.
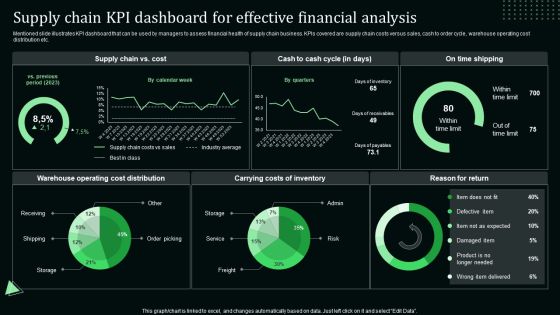
Supply Chain Kpi Dashboard For Effective Financial Analysis Stand Out Digital Supply Chain Tactics Enhancing Graphics PDF
Mentioned slide illustrates KPI dashboard that can be used by managers to assess financial health of supply chain business. KPIs covered are supply chain costs versus sales, cash to order cycle, warehouse operating cost distribution etc.Coming up with a presentation necessitates that the majority of the effort goes into the content and the message you intend to convey. The visuals of a PowerPoint presentation can only be effective if it supplements and supports the story that is being told. Keeping this in mind our experts created Supply Chain Kpi Dashboard For Effective Financial Analysis Stand Out Digital Supply Chain Tactics Enhancing Graphics PDF to reduce the time that goes into designing the presentation. This way, you can concentrate on the message while our designers take care of providing you with the right template for the situation.
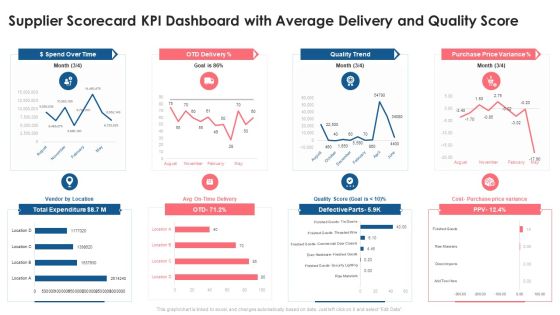
Supplier Scorecard Supplier Scorecard KPI Dashboard With Average Delivery And Quality Score Introduction PDF
This graph or chart is linked to excel, and changes automatically based on data. Just left click on it and select Edit Data. Deliver an awe inspiring pitch with this creative supplier scorecard supplier scorecard kpi dashboard with average delivery and quality score introduction pdf bundle. Topics like dollar spend over time, otd delivery, quality trend, purchase price variance, total expenditure can be discussed with this completely editable template. It is available for immediate download depending on the needs and requirements of the user.
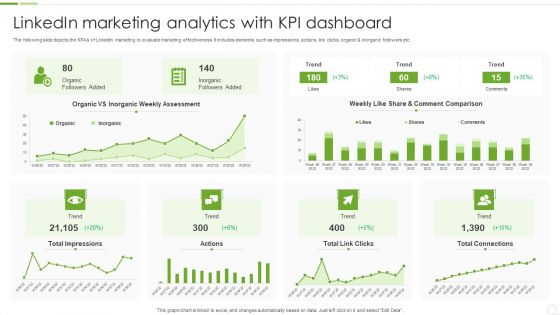
Linkedin Marketing Analytics With KPI Dashboard Ppt PowerPoint Presentation File Inspiration PDF
The following slide depicts the KPAs of LinkedIn marketing to evaluate marketing effectiveness. It includes elements such as impressions, actions, link clicks, organic and inorganic followers etc. Showcasing this set of slides titled Linkedin Marketing Analytics With KPI Dashboard Ppt PowerPoint Presentation File Inspiration PDF. The topics addressed in these templates are Total Impressions, Total Connections, Inorganic Followers Added. All the content presented in this PPT design is completely editable. Download it and make adjustments in color, background, font etc. as per your unique business setting.

Firm KPI Dashboard With Average Click Through Rate Ppt Inspiration Sample PDF
This graph or chart is linked to excel, and changes automatically based on data. Just left click on it and select Edit Data. Pitch your topic with ease and precision using this Firm KPI Dashboard With Average Click Through Rate Ppt Inspiration Sample PDF. This layout presents information on Total Clicks, Total Impressive, Average CTR, Average Position. It is also available for immediate download and adjustment. So, changes can be made in the color, design, graphics or any other component to create a unique layout.
Market Insights Research Results With KPI Dashboard Ppt PowerPoint Presentation Icon File Formats PDF
The given below slide highlights the KPAs of market research associated with customer satisfaction. It includes net promoter score, customer effort score, monthly NPS and CES trend etc.Pitch your topic with ease and precision using this Market Insights Research Results With KPI Dashboard Ppt PowerPoint Presentation Icon File Formats PDF. This layout presents information on Satisfaction Score, Customer Effort, Customer Score. It is also available for immediate download and adjustment. So, changes can be made in the color, design, graphics or any other component to create a unique layout.

Service Level Agreement KPI Dashboard With Current Risk Statistics Topics PDF
This graph or chart is linked to excel, and changes automatically based on data. Just left click on it and select Edit Data. Pitch your topic with ease and precision using this Service Level Agreement KPI Dashboard With Current Risk Statistics Topics PDF. This layout presents information on Current Risk SLAS, Current Breached Slas, Personal Active SLA It is also available for immediate download and adjustment. So, changes can be made in the color, design, graphics or any other component to create a unique layout.
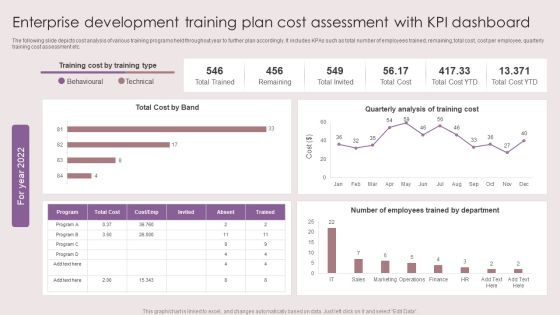
Enterprise Development Training Plan Cost Assessment With KPI Dashboard Mockup PDF
The following slide depicts cost analysis of various training programs held throughout year to further plan accordingly. It includes KPAs such as total number of employees trained, remaining, total cost, cost per employee, quarterly training cost assessment etc. Showcasing this set of slides titled Enterprise Development Training Plan Cost Assessment With KPI Dashboard Mockup PDF. The topics addressed in these templates are Total Cost Band, Quarterly Analysis, Training Cost. All the content presented in this PPT design is completely editable. Download it and make adjustments in color, background, font etc. as per your unique business setting.
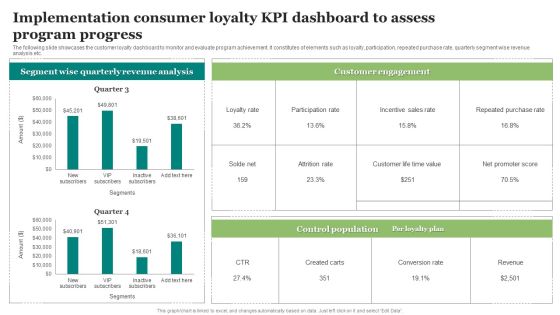
Implementation Consumer Loyalty KPI Dashboard To Assess Program Progress Guidelines PDF
The following slide illustrates the impact of executing artificial technology and machine learning in customer loyalty program. It includes elements such as predictive insights, prescriptive analytics, fraud prevention, intelligent interference etc. Showcasing this set of slides titled Implementation Consumer Loyalty KPI Dashboard To Assess Program Progress Guidelines PDF. The topics addressed in these templates are Implementation Consumer, Assess Program. All the content presented in this PPT design is completely editable. Download it and make adjustments in color, background, font etc. as per your unique business setting.

Project Progress Status KPI Dashboard Ppt PowerPoint Presentation File Themes PDF
The given slide showcases the project status to communicate and monitor risk. It includes elements such as activity status, budget allocation, risk status and degree. Showcasing this set of slides titled Project Progress Status KPI Dashboard Ppt PowerPoint Presentation File Themes PDF. The topics addressed in these templates are Activity Status, Budget Allocation, Open Risk, Open Issues. All the content presented in this PPT design is completely editable. Download it and make adjustments in color, background, font etc. as per your unique business setting.
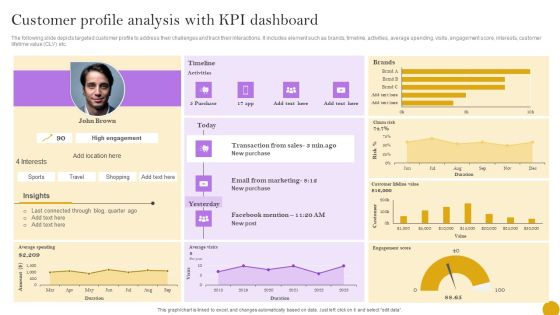
Comprehensive Customer Data Platform Guide Optimizing Promotional Initiatives Customer Profile Analysis KPI Dashboard Pictures PDF
The following slide depicts targeted customer profile to address their challenges and track their interactions. It includes element such as brands, timeline, activities, average spending, visits, engagement score, interests, customer lifetime value CLV etc. The best PPT templates are a great way to save time, energy, and resources. Slidegeeks have 100 percent editable powerpoint slides making them incredibly versatile. With these quality presentation templates, you can create a captivating and memorable presentation by combining visually appealing slides and effectively communicating your message. Download Comprehensive Customer Data Platform Guide Optimizing Promotional Initiatives Customer Profile Analysis KPI Dashboard Pictures PDF from Slidegeeks and deliver a wonderful presentation.

Employee Kpi Examples Ppt Powerpoint Presentation Infographics Backgrounds Cpb
This is a employee kpi examples ppt powerpoint presentation infographics backgrounds cpb. This is a seven stage process. The stages in this process are employee kpi examples.
Kpi Reports Examples Ppt Powerpoint Presentation Styles Demonstration Cpb
This is a kpi reports examples ppt powerpoint presentation styles demonstration cpb. This is a four stage process. The stages in this process are kpi reports examples.

Kpi Assessment Ppt PowerPoint Presentation Gallery Background Image
This is a kpi assessment ppt powerpoint presentation gallery background image. This is a three stage process. The stages in this process are kpi assessment.
Quality Kpi Examples Ppt PowerPoint Presentation File Visuals
This is a quality kpi examples ppt powerpoint presentation file visuals. This is a five stage process. The stages in this process are quality kpi examples.

Business Kpi Ppt Powerpoint Presentation Infographics Format Cpb
This is a business kpi ppt powerpoint presentation infographics format cpb. This is a four stage process. The stages in this process are business kpi.
Management Kpi Ppt Powerpoint Presentation Diagram Graph Charts Cpb
This is a management kpi ppt powerpoint presentation diagram graph charts cpb. This is a five stage process. The stages in this process are management kpi.
KPI Measurement Ppt PowerPoint Presentation Professional Layouts Cpb
This is a kpi measurement ppt powerpoint presentation professional layouts cpb. This is a three stage process. The stages in this process are kpi measurement.
Kpi Business Analyst Ppt PowerPoint Presentation Ideas Layouts Cpb
This is a kpi business analyst ppt powerpoint presentation ideas layouts cpb. This is a three stage process. The stages in this process are kpi business analyst.
Kpi Reporting Examples Ppt PowerPoint Presentation Inspiration Microsoft Cpb
This is a kpi reporting examples ppt powerpoint presentation inspiration microsoft cpb. This is a three stage process. The stages in this process are kpi reporting examples.
Kpi Management Ppt PowerPoint Presentation Professional Template Cpb
This is a kpi management ppt powerpoint presentation professional template cpb. This is a six stage process. The stages in this process are kpi management.

Kpi Marketing Plan Ppt Powerpoint Presentation Model Display Cpb
This is a kpi marketing plan ppt powerpoint presentation model display cpb. This is a four stage process. The stages in this process are kpi marketing plan.
Finance Department KPI Ppt PowerPoint Presentation Styles Topics Cpb
This is a finance department kpi ppt powerpoint presentation styles topics cpb. This is a six stage process. The stages in this process are finance department kpi.

Manufacturing KPI Template Ppt PowerPoint Presentation Layouts Clipart Images Cpb
This is a manufacturing kpi template ppt powerpoint presentation layouts clipart images cpb. This is a five stage process. The stages in this process are manufacturing kpi template.

Channel Management KPI Ppt PowerPoint Presentation Gallery Graphic Images Cpb
This is a channel management kpi ppt powerpoint presentation gallery graphic images cpb. This is a three stage process. The stages in this process are channel management kpi.
Media Buying Kpi Ppt PowerPoint Presentation Model Display Cpb
This is a media buying kpi ppt powerpoint presentation model display cpb. This is a four stage process. The stages in this process are media buying kpi.
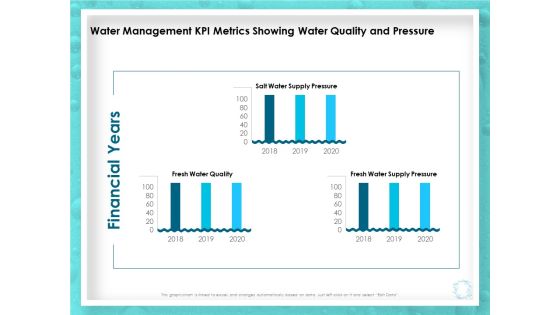
WQM System Water Management KPI Metrics Showing Water Quality And Pressure Ppt PowerPoint Presentation Model Example File PDF
Presenting this set of slides with name wqm system water management kpi metrics showing water quality and pressure ppt powerpoint presentation model example file pdf. The topics discussed in these slides are financial years, fresh water quality, fresh water supply pressure, salt water supply pressure, 2018 to 2020. This is a completely editable PowerPoint presentation and is available for immediate download. Download now and impress your audience.

Optimization Of Water Usage Water Management KPI Metrics Showing Water Quality And Pressure Ppt Gallery Graphics PDF
Presenting this set of slides with name optimization of water usage water management kpi metrics showing water quality and pressure ppt gallery graphics pdf. The topics discussed in these slides are financial years, fresh water quality, fresh water supply pressure, salt water supply pressure, 2018 to 2020. This is a completely editable PowerPoint presentation and is available for immediate download. Download now and impress your audience.
Monitoring And Evaluating Water Quality Water Management KPI Metrics Showing Water Quality And Pressure Ppt Icon Maker PDF
Presenting this set of slides with name monitoring and evaluating water quality water management kpi metrics showing water quality and pressure ppt icon maker pdf. The topics discussed in these slides are financial years, fresh water quality, fresh water supply pressure, salt water supply pressure, 2018 to 2020. This is a completely editable PowerPoint presentation and is available for immediate download. Download now and impress your audience.

Projects Data Quality Kpis Metrics Comparative Assessment Guidelines PDF
Pitch your topic with ease and precision using this Projects Data Quality Kpis Metrics Comparative Assessment Guidelines PDF. This layout presents information on Business Relevance, Value Related, Methods Related. It is also available for immediate download and adjustment. So, changes can be made in the color, design, graphics or any other component to create a unique layout.
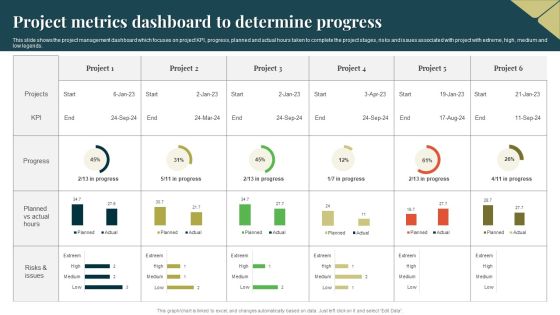
Project Metrics Dashboard To Determine Progress Guidelines PDF
This slide shows the project management dashboard which focuses on project KPI, progress, planned and actual hours taken to complete the project stages, risks and issues associated with project with extreme, high, medium and low legends. Showcasing this set of slides titled Project Metrics Dashboard To Determine Progress Guidelines PDF. The topics addressed in these templates are Project Metrics Dashboard, Determine Progress. All the content presented in this PPT design is completely editable. Download it and make adjustments in color, background, font etc. as per your unique business setting.

E Commerce Operations In B2b B2b Ecommerce Dashboard To Track Website Infographics PDF
This slide represents metric dashboard to track and analyze b2b ecommerce website performance. It covers total user visits, sales, average return per user etc. Find a pre designed and impeccable E Commerce Operations In B2b B2b Ecommerce Dashboard To Track Website Infographics PDF. The templates can ace your presentation without additional effort. You can download these easy to edit presentation templates to make your presentation stand out from others. So, what are you waiting for Download the template from Slidegeeks today and give a unique touch to your presentation.

Service Level Agreement KPI Dashboard Ppt PowerPoint Presentation Complete Deck With Slides
This Service Level Agreement KPI Dashboard Ppt PowerPoint Presentation Complete Deck With Slides acts as backup support for your ideas, vision, thoughts, etc. Use it to present a thorough understanding of the topic. This PPT slideshow can be utilized for both in-house and outside presentations depending upon your needs and business demands. Entailing twelve slides with a consistent design and theme, this template will make a solid use case. As it is intuitively designed, it suits every business vertical and industry. All you have to do is make a few tweaks in the content or any other component to design unique presentations. The biggest advantage of this complete deck is that it can be personalized multiple times once downloaded. The color, design, shapes, and other elements are free to modify to add personal touches. You can also insert your logo design in this PPT layout. Therefore a well-thought and crafted presentation can be delivered with ease and precision by downloading this Service Level Agreement KPI Dashboard Ppt PowerPoint Presentation Complete Deck With Slides PPT slideshow.

Investment Project KPI Dashboard Ppt PowerPoint Presentation Complete Deck With Slides
This Investment Project KPI Dashboard Ppt PowerPoint Presentation Complete Deck With Slides acts as backup support for your ideas, vision, thoughts, etc. Use it to present a thorough understanding of the topic. This PPT slideshow can be utilized for both in-house and outside presentations depending upon your needs and business demands. Entailing fourteen slides with a consistent design and theme, this template will make a solid use case. As it is intuitively designed, it suits every business vertical and industry. All you have to do is make a few tweaks in the content or any other component to design unique presentations. The biggest advantage of this complete deck is that it can be personalized multiple times once downloaded. The color, design, shapes, and other elements are free to modify to add personal touches. You can also insert your logo design in this PPT layout. Therefore a well-thought and crafted presentation can be delivered with ease and precision by downloading this Investment Project KPI Dashboard Ppt PowerPoint Presentation Complete Deck With Slides PPT slideshow.

Project Risk KPI Dashboard Ppt PowerPoint Presentation Complete Deck With Slides
This Project Risk KPI Dashboard Ppt PowerPoint Presentation Complete Deck With Slides acts as backup support for your ideas, vision, thoughts, etc. Use it to present a thorough understanding of the topic. This PPT slideshow can be utilized for both in-house and outside presentations depending upon your needs and business demands. Entailing Nine slides with a consistent design and theme, this template will make a solid use case. As it is intuitively designed, it suits every business vertical and industry. All you have to do is make a few tweaks in the content or any other component to design unique presentations. The biggest advantage of this complete deck is that it can be personalized multiple times once downloaded. The color, design, shapes, and other elements are free to modify to add personal touches. You can also insert your logo design in this PPT layout. Therefore a well-thought and crafted presentation can be delivered with ease and precision by downloading this Project Risk KPI Dashboard Ppt PowerPoint Presentation Complete Deck With Slides PPT slideshow.
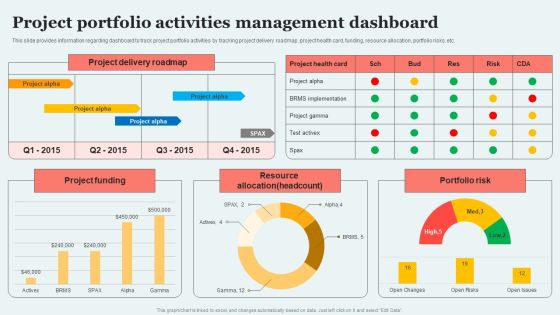
Project Portfolio Activities Management Dashboard Introduction PDF
This slide provides information regarding dashboard to track project portfolio activities by tracking project delivery roadmap, project health card, funding, resource allocation, portfolio risks, etc. This Project Portfolio Activities Management Dashboard Introduction PDF from Slidegeeks makes it easy to present information on your topic with precision. It provides customization options, so you can make changes to the colors, design, graphics, or any other component to create a unique layout. It is also available for immediate download, so you can begin using it right away. Slidegeeks has done good research to ensure that you have everything you need to make your presentation stand out. Make a name out there for a brilliant performance.
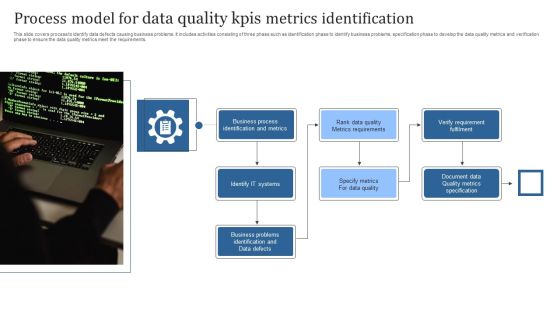
Process Model For Data Quality Kpis Metrics Identification Brochure PDF
This slide covers process to identify data defects causing business problems. It includes activities consisting of three phase such as identification phase to identify business problems, specification phase to develop the data quality metrics and verification phase to ensure the data quality metrics meet the requirements. Persuade your audience using this Process Model For Data Quality Kpis Metrics Identification Brochure PDF. This PPT design covers Seven stages, thus making it a great tool to use. It also caters to a variety of topics including Business Process, Identification And Metrics, Verify Requirement Fulfilment. Download this PPT design now to present a convincing pitch that not only emphasizes the topic but also showcases your presentation skills.
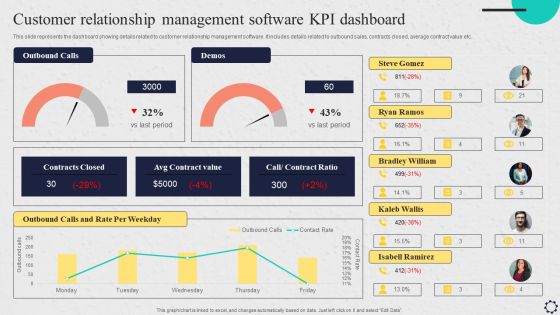
Software Implementation Strategy Customer Relationship Management Software Kpi Dashboard Clipart PDF
This slide represents the dashboard showing details related to customer relationship management software. It includes details related to outbound sales, contracts closed, average contract value etc. Are you in need of a template that can accommodate all of your creative concepts This one is crafted professionally and can be altered to fit any style. Use it with Google Slides or PowerPoint. Include striking photographs, symbols, depictions, and other visuals. Fill, move around, or remove text boxes as desired. Test out color palettes and font mixtures. Edit and save your work, or work with colleagues. Download Software Implementation Strategy Customer Relationship Management Software Kpi Dashboard Clipart PDF and observe how to make your presentation outstanding. Give an impeccable presentation to your group and make your presentation unforgettable.

Metrics And Kpis In Experiential Marketing Campaign Structure PDF
This slide presents experiential marketing metrics with effectiveness of virtual reality and live events that help brands to generate high number of leads. It includes most demanded VR experience by customers, effectiveness of live events for brands and lead generation through experiential marketing. Pitch your topic with ease and precision using this Metrics And Kpis In Experiential Marketing Campaign Structure PDF. This layout presents information on Experiential Marketing, Business, Metrics. It is also available for immediate download and adjustment. So, changes can be made in the color, design, graphics or any other component to create a unique layout.
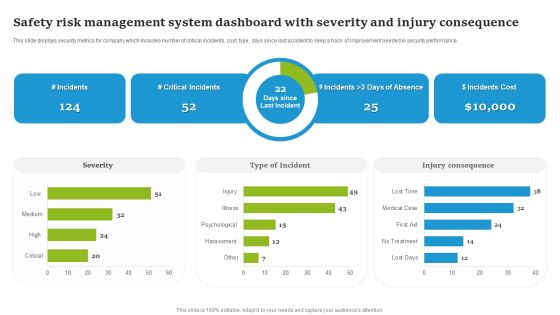
Safety Risk Management System Dashboard With Severity And Injury Consequence Clipart PDF
This slide displays security metrics for company which includes number of critical incidents, cost, type, days since last accident to keep a track of Improvement needed in security performance. Pitch your topic with ease and precision using this Safety Risk Management System Dashboard With Severity And Injury Consequence Clipart PDF. This layout presents information on Severity, Type Of Incident, Injury Consequence . It is also available for immediate download and adjustment. So, changes can be made in the color, design, graphics or any other component to create a unique layout.
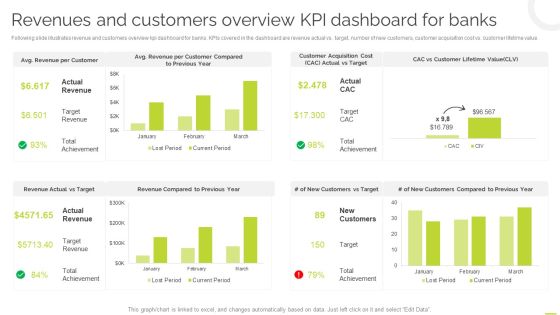
Effective BPM Tool For Business Process Management Revenues And Customers Overview KPI Dashboard For Banks Elements PDF
Following slide illustrates revenue and customers overview kpi dashboard for banks. KPIs covered in the dashboard are revenue actual vs target, number of new customers, customer acquisition cost vs. customer lifetime value. This Effective BPM Tool For Business Process Management Revenues And Customers Overview KPI Dashboard For Banks Elements PDF is perfect for any presentation, be it in front of clients or colleagues. It is a versatile and stylish solution for organizing your meetings. The Effective BPM Tool For Business Process Management Revenues And Customers Overview KPI Dashboard For Banks Elements PDF features a modern design for your presentation meetings. The adjustable and customizable slides provide unlimited possibilities for acing up your presentation. Slidegeeks has done all the homework before launching the product for you. So, do not wait, grab the presentation templates today.
 Home
Home