AI PPT Maker
Templates
PPT Bundles
Design Services
Business PPTs
Business Plan
Management
Strategy
Introduction PPT
Roadmap
Self Introduction
Timelines
Process
Marketing
Agenda
Technology
Medical
Startup Business Plan
Cyber Security
Dashboards
SWOT
Proposals
Education
Pitch Deck
Digital Marketing
KPIs
Project Management
Product Management
Artificial Intelligence
Target Market
Communication
Supply Chain
Google Slides
Research Services
 One Pagers
All Categories
-
Home
- Customer Favorites
- It Project Discovery Phase
It Project Discovery Phase

Data Lineage Implementation Horizontal Vertical And Physical Data Lineage Topics PDF
This slide represents the horizontal, vertical and physical lineage that defines the scope of data lineage. The horizontal lineage is recorded at different data model stages such as conceptual, logical, and physical and vertical lineage refers to the connections between components at these levels. Retrieve professionally designed Data Lineage Implementation Horizontal Vertical And Physical Data Lineage Topics PDF to effectively convey your message and captivate your listeners. Save time by selecting pre made slideshows that are appropriate for various topics, from business to educational purposes. These themes come in many different styles, from creative to corporate, and all of them are easily adjustable and can be edited quickly. Access them as PowerPoint templates or as Google Slides themes. You do not have to go on a hunt for the perfect presentation because Slidegeeks got you covered from everywhere.

Information Process With Data Preservation And Analysis Ppt PowerPoint Presentation Styles Graphics Tutorials PDF
Presenting information process with data preservation and analysis ppt powerpoint presentation styles graphics tutorials pdf to dispense important information. This template comprises eight stages. It also presents valuable insights into the topics including research idea, concept, data reuse, data preservation, data publishing and access, research data planning and design, data collection created, acquired, data processing, data study and analysis. This is a completely customizable PowerPoint theme that can be put to use immediately. So, download it and address the topic impactfully.

Deploying AI To Enhance Predictive Maintenance Equipment Condition Summary PDF
This slide represents the predictive maintenance and equipment condition monitoring with the internet of things, including its working and impact on the industry. In this method, a sensor is mounted on the piece of equipment to gather information about its health and performance. This Deploying AI To Enhance Predictive Maintenance Equipment Condition Summary PDF is perfect for any presentation, be it in front of clients or colleagues. It is a versatile and stylish solution for organizing your meetings. The Deploying AI To Enhance Predictive Maintenance Equipment Condition Summary PDF features a modern design for your presentation meetings. The adjustable and customizable slides provide unlimited possibilities for acing up your presentation. Slidegeeks has done all the homework before launching the product for you. So, dont wait, grab the presentation templates today
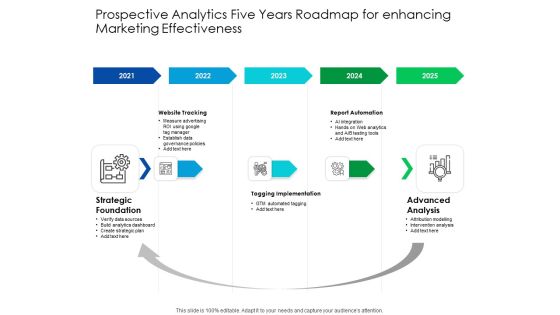
Predictive Analytics Five Years Roadmap For Enhancing Marketing Effectiveness Formats
We present our predictive analytics five years roadmap for enhancing marketing effectiveness formats. This PowerPoint layout is easy to edit so you can change the font size, font type, color, and shape conveniently. In addition to this, the PowerPoint layout is Google Slides compatible, so you can share it with your audience and give them access to edit it. Therefore, download and save this well researched predictive analytics five years roadmap for enhancing marketing effectiveness formats in different formats like PDF, PNG, and JPG to smoothly execute your business plan.
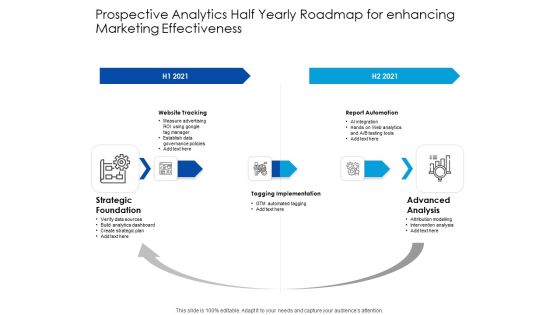
Predictive Analytics Half Yearly Roadmap For Enhancing Marketing Effectiveness Pictures
We present our predictive analytics half yearly roadmap for enhancing marketing effectiveness pictures. This PowerPoint layout is easy to edit so you can change the font size, font type, color, and shape conveniently. In addition to this, the PowerPoint layout is Google Slides compatible, so you can share it with your audience and give them access to edit it. Therefore, download and save this well researched predictive analytics half yearly roadmap for enhancing marketing effectiveness pictures in different formats like PDF, PNG, and JPG to smoothly execute your business plan.

Predictive Analytics Quarterly Roadmap For Enhancing Marketing Effectiveness Inspiration
We present our predictive analytics quarterly roadmap for enhancing marketing effectiveness inspiration. This PowerPoint layout is easy to edit so you can change the font size, font type, color, and shape conveniently. In addition to this, the PowerPoint layout is Google Slides compatible, so you can share it with your audience and give them access to edit it. Therefore, download and save this well researched predictive analytics quarterly roadmap for enhancing marketing effectiveness inspiration in different formats like PDF, PNG, and JPG to smoothly execute your business plan.
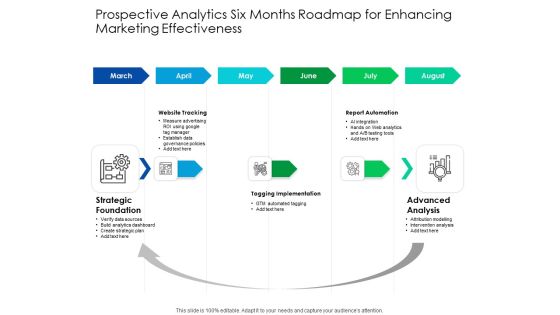
Predictive Analytics Six Months Roadmap For Enhancing Marketing Effectiveness Graphics
We present our predictive analytics six months roadmap for enhancing marketing effectiveness graphics. This PowerPoint layout is easy to edit so you can change the font size, font type, color, and shape conveniently. In addition to this, the PowerPoint layout is Google Slides compatible, so you can share it with your audience and give them access to edit it. Therefore, download and save this well researched predictive analytics six months roadmap for enhancing marketing effectiveness graphics in different formats like PDF, PNG, and JPG to smoothly execute your business plan.
Icons Slide For Oracle Cloud Data Analytics Administration IT Microsoft PDF
Presenting our innovatively structured icons slide for oracle cloud data analytics administration it microsoft pdf set of slides. The slides contain a hundred percent editable icons. You can replace these icons without any inconvenience. Therefore, pick this set of slides and create a striking presentation.

Icons Slide For Data Center Migration Information Technology Systems Assessment Create Resilient Network Demonstration PDF
Download our innovative and attention grabbing Icons Slide For Data Center Migration Information Technology Systems Assessment Create Resilient Network Demonstration PDF template. The set of slides exhibit completely customizable icons. These icons can be incorporated into any business presentation. So download it immediately to clearly communicate with your clientele.

Data Analysis Process Diagram 9 Stages How To Draft Business Plan PowerPoint Templates
We present our data analysis process diagram 9 stages how to draft business plan PowerPoint templates.Download our Process and Flows PowerPoint Templates because They will Put the wind in your sails. Skim smoothly over the choppy waters of the market. Download and present our Shapes PowerPoint Templates because Our PowerPoint Templates and Slides will steer your racing mind. Hit the right buttons and spur on your audience. Download our Marketing PowerPoint Templates because Our PowerPoint Templates and Slides team portray an attitude of elegance. Personify this quality by using them regularly. Present our Triangles PowerPoint Templates because Our PowerPoint Templates and Slides will let you Leave a lasting impression to your audiences. They possess an inherent longstanding recall factor. Use our Business PowerPoint Templates because It is Aesthetically crafted by artistic young minds. Our PowerPoint Templates and Slides are designed to display your dexterity.Use these PowerPoint slides for presentations relating to Saturation, strip, saturated, line, spectrum, pantone, bright, diagram, circle, sampler, guide, element, paint, scale,shape, ten, multicolored, palette, illustration, spectral, guidance, chart, collection, abstraction, selection, choice, visible, variation, painter, contrast, ,gradient, pattern, chooser, analyzer. The prominent colors used in the PowerPoint template are Gray, Black, Blue light.
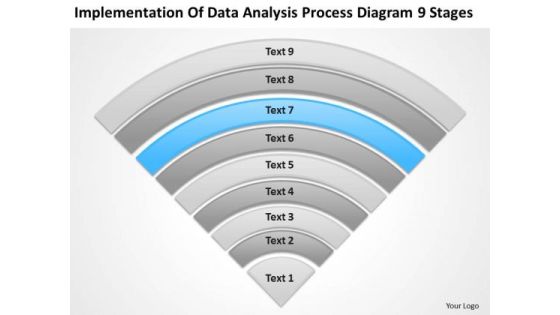
Implementation Of Data Analysis Process Diagram 9 Stages Busness Plan PowerPoint Templates
We present our implementation of data analysis process diagram 9 stages busness plan PowerPoint templates.Download our Process and Flows PowerPoint Templates because You should Throw the gauntlet with our PowerPoint Templates and Slides. They are created to take up any challenge. Download our Triangles PowerPoint Templates because you should Whip up a frenzy with our PowerPoint Templates and Slides. They will fuel the excitement of your team. Use our Business PowerPoint Templates because Our PowerPoint Templates and Slides offer you the widest possible range of options. Download and present our Shapes PowerPoint Templates because It can Conjure up grand ideas with our magical PowerPoint Templates and Slides. Leave everyone awestruck by the end of your presentation. Download our Marketing PowerPoint Templates because You are an avid believer in ethical practices. Highlight the benefits that accrue with our PowerPoint Templates and Slides.Use these PowerPoint slides for presentations relating to Color, print, plate, paint, diagram, chart, process, gamma, press, isolated, semicircle, white, sample, spectrum, pantone, template, circle, sampler, guide, graphic, printout, technology, , computer, management, palette, illustration, spectral, object, system, round, design, selection, choice, rainbow, chooser. The prominent colors used in the PowerPoint template are Blue, Gray, Black.
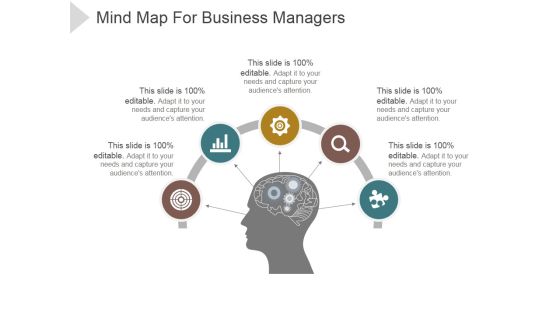
Mind Map For Business Managers Ppt PowerPoint Presentation Background Image
This is a mind map for business managers ppt powerpoint presentation background image. This is a five stage process. The stages in this process are mind, idea, icons, planning, business.

Setting Campaign Metrics Ppt PowerPoint Presentation Slide Download
This is a setting campaign metrics ppt powerpoint presentation slide download. This is a five stage process. The stages in this process are icons, process, strategy, business, marketing, management.

Our Offering Vs The Competition Ppt PowerPoint Presentation Images
This is a our offering vs the competition ppt powerpoint presentation images. This is a five stage process. The stages in this process are icon, tick, right, wrong, table.
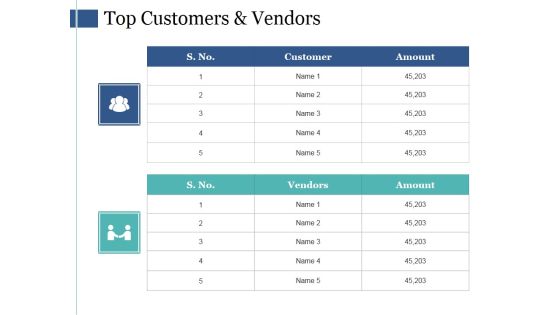
Top Customers And Vendors Ppt PowerPoint Presentation Ideas Designs
This is a top customers and vendors ppt powerpoint presentation ideas designs. This is a two stage process. The stages in this process are customer, vendors, amount, shape, icons.

Business Chart Success PowerPoint Presentation Slides C
Microsoft Powerpoint Slides and Backgrounds with budget cuts layoffs and dropped sales business model

Business Chart Success PowerPoint Presentation Slides Cc
Microsoft Powerpoint Slides and Backgrounds with budget cuts layoffs and dropped sales business model
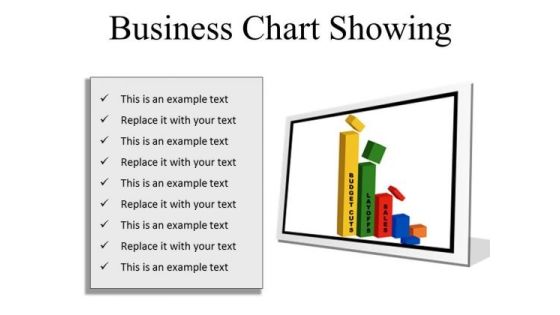
Business Chart Success PowerPoint Presentation Slides F
Microsoft Powerpoint Slides and Backgrounds with budget cuts layoffs and dropped sales business model

Business Chart Success PowerPoint Presentation Slides R
Microsoft Powerpoint Slides and Backgrounds with budget cuts layoffs and dropped sales business model

Business Chart Success PowerPoint Presentation Slides S
Microsoft Powerpoint Slides and Backgrounds with budget cuts layoffs and dropped sales business model
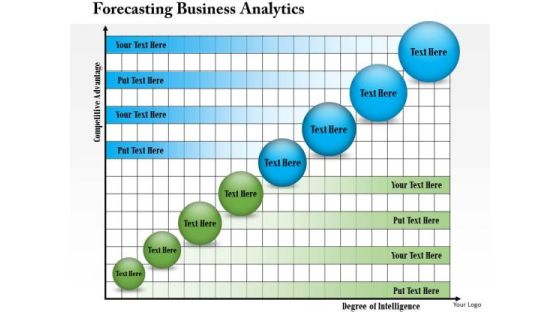
Business Framework Forecasting Business Analytics PowerPoint Presentation
This business framework Power Point template slide has been used to display forecasting for business analysis. This business analysis can be used for various processes. Use this template slide for your business and marketing presentations.

Big Data Life Cycle Impacts Circular Diagram Ppt PowerPoint Presentation Introduction
This is a big data life cycle impacts circular diagram ppt powerpoint presentation introduction. This is a six stage process. The stages in this process are sports predictions, easier commutes, smartphones, personalized advertising, presidential campaigns, advanced healthcare.

Data Analysis Process Diagram 9 Stages Help With Business Plan PowerPoint Slides
We present our data analysis process diagram 9 stages help with business plan PowerPoint Slides.Use our Computer PowerPoint Templates because Our PowerPoint Templates and Slides will let you Leave a lasting impression to your audiences. They possess an inherent longstanding recall factor. Use our Communication PowerPoint Templates because you can Break through with our PowerPoint Templates and Slides. Bring down the mental barriers of your audience. Use our Semicircles PowerPoint Templates because Our PowerPoint Templates and Slides will let your words and thoughts hit bullseye everytime. Present our Shapes PowerPoint Templates because Our PowerPoint Templates and Slides will let you meet your Deadlines. Use our Business PowerPoint Templates because Our PowerPoint Templates and Slides have the Brilliant backdrops. Guaranteed to illuminate the minds of your audience.Use these PowerPoint slides for presentations relating to Catalogue, chart, checking, choice, circle, swatch, computer, design, equipment, fan, gamma, guide, mix, object, paint, palette, pantone, paper, press, print, printout, process, profile, publishing, rainbow, round, scale, select, selection, semicircle, spectrum, system, template, typographic, typography, variation. The prominent colors used in the PowerPoint template are Blue, Gray, Black.

Major Indicators Of Cybersecurity Insider Threat In Cyber Security Microsoft PDF
This slide shows major indicators of cybersecurity insider threat along with mitigation strategies. It contains information about behavioral, information technology IT sabotage and data theft. Presenting Major Indicators Of Cybersecurity Insider Threat In Cyber Security Microsoft PDF to dispense important information. This template comprises three stages. It also presents valuable insights into the topics including Behavioral, IT Sabotage, Data Theft. This is a completely customizable PowerPoint theme that can be put to use immediately. So, download it and address the topic impactfully.

Architecture Of Centralized Repository Data Lake Data Lake Creation With Hadoop Cluster Portrait PDF
This slide represents the architecture of the data lake by defining its three major components such as sources, data processing layer, and targets.Are you searching for a Architecture Of Centralized Repository Data Lake Data Lake Creation With Hadoop Cluster Portrait PDF that is uncluttered, straightforward, and original Its easy to edit, and you can change the colors to suit your personal or business branding. For a presentation that expresses how much effort you ve put in, this template is ideal With all of its features, including tables, diagrams, statistics, and lists, its perfect for a business plan presentation. Make your ideas more appealing with these professional slides. Download Architecture Of Centralized Repository Data Lake Data Lake Creation With Hadoop Cluster Portrait PDF from Slidegeeks today.

5 Year Strategy Roadmap For Data Analysis Integration To Business Pictures
Introducing our 5 year strategy roadmap for data analysis integration to business pictures. This PPT presentation is Google Slides compatible, therefore, you can share it easily with the collaborators for measuring the progress. Also, the presentation is available in both standard screen and widescreen aspect ratios. So edit the template design by modifying the font size, font type, color, and shapes as per your requirements. As this PPT design is fully editable it can be presented in PDF, JPG and PNG formats.

Business Diagram Big Data Analysis From Feed Of Zeros And Ones 0s And 1s Magnifying Glass Ppt Slide
This PowerPoint template has been designed with graphic of magnifier on big data text. This magnifier is magnifying the binary data. This slide can be used to represent topics like binary, programming, coding etc.

Collecting Consumer Qualitative Data For Personalized Marketing Ppt PowerPoint Presentation Diagram Graph Charts PDF
This slide showcases consumer qualitative data that can be collected to formulate personalized marketing campaign. It also shows ways to collect data from different sources Do you have an important presentation coming up Are you looking for something that will make your presentation stand out from the rest Look no further than Collecting Consumer Qualitative Data For Personalized Marketing Ppt PowerPoint Presentation Diagram Graph Charts PDF. With our professional designs, you can trust that your presentation will pop and make delivering it a smooth process. And with Slidegeeks, you can trust that your presentation will be unique and memorable. So why wait Grab Collecting Consumer Qualitative Data For Personalized Marketing Ppt PowerPoint Presentation Diagram Graph Charts PDF today and make your presentation stand out from the rest.

Daily Progress Summary Of Customer Support Department In Organization Portrait PDF
This slide showcases a dashboard to review the client services of organization and everyday performance of agents to ensure positive feedback. It includes details about resolutions, response time, daily tickets and top employees. Showcasing this set of slides titled Daily Progress Summary Of Customer Support Department In Organization Portrait PDF. The topics addressed in these templates are Daily Progress Summary, Customer Support, Department In Organization. All the content presented in this PPT design is completely editable. Download it and make adjustments in color, background, font etc. as per your unique business setting.

Competitive Analysis Template 6 Scatter Chart Ppt PowerPoint Presentation Slides
This is a competitive analysis template 6 scatter chart ppt powerpoint presentation slides. This is a eight stage process. The stages in this process are users interface, data import, example, pricing, support, update, tutorials, easy to use, table.

Competitive Analysis Template 7 Bubble Chart Ppt PowerPoint Presentation Deck
This is a competitive analysis template 7 bubble chart ppt powerpoint presentation deck. This is a six stage process. The stages in this process are users interface, data import, example, pricing, support, update, tutorials, easy to use, table.

Accountant Responsibility Area With Data Analysis Ppt PowerPoint Presentation File Formats PDF
Presenting accountant responsibility area with data analysis ppt powerpoint presentation file formats pdf to dispense important information. This template comprises five stages. It also presents valuable insights into the topics including accountant responsibility area with data analysis. This is a completely customizable PowerPoint theme that can be put to use immediately. So, download it and address the topic impactfully.
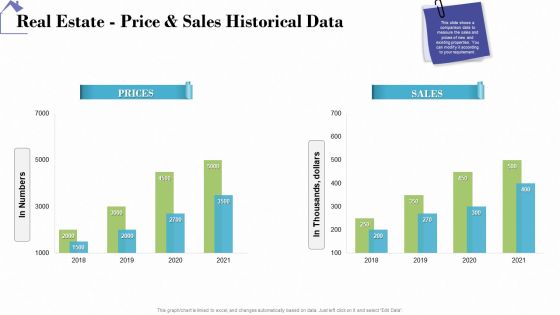
Industry Analysis Of Real Estate And Construction Sector Real Estate Price And Sales Historical Data Diagrams PDF
Deliver and pitch your topic in the best possible manner with this industry analysis of real estate and construction sector real estate price and sales historical data diagrams pdf. Use them to share invaluable insights on prices, sales and impress your audience. This template can be altered and modified as per your expectations. So, grab it now.
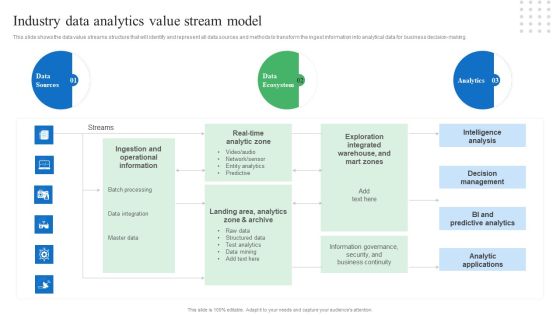
Toolkit For Data Science And Analytics Transition Industry Data Analytics Value Stream Model Brochure PDF
This slide shows the data value streams structure that will identify and represent all data sources and methods to transform the ingest information into analytical data for business decision-making. Whether you have daily or monthly meetings, a brilliant presentation is necessary. Toolkit For Data Science And Analytics Transition Industry Data Analytics Value Stream Model Brochure PDF can be your best option for delivering a presentation. Represent everything in detail using Toolkit For Data Science And Analytics Transition Industry Data Analytics Value Stream Model Brochure PDF and make yourself stand out in meetings. The template is versatile and follows a structure that will cater to your requirements. All the templates prepared by Slidegeeks are easy to download and edit. Our research experts have taken care of the corporate themes as well. So, give it a try and see the results.

Predictive Analytics Five Years Roadmap With Multiple Activities Ideas
Introducing our predictive analytics five years roadmap with multiple activities ideas. This PPT presentation is Google Slides compatible, therefore, you can share it easily with the collaborators for measuring the progress. Also, the presentation is available in both standard screen and widescreen aspect ratios. So edit the template design by modifying the font size, font type, color, and shapes as per your requirements. As this PPT design is fully editable it can be presented in PDF, JPG and PNG formats.
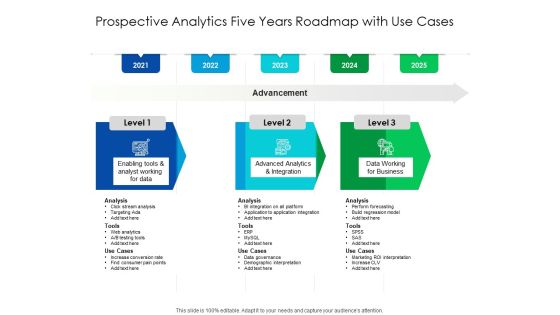
Predictive Analytics Five Years Roadmap With Use Cases Topics
Presenting our jaw dropping predictive analytics five years roadmap with use cases topics. You can alternate the color, font size, font type, and shapes of this PPT layout according to your strategic process. This PPT presentation is compatible with Google Slides and is available in both standard screen and widescreen aspect ratios. You can also download this well researched PowerPoint template design in different formats like PDF, JPG, and PNG. So utilize this visually appealing design by clicking the download button given below.

Predictive Analytics Half Yearly Roadmap With Multiple Activities Formats
Introducing our predictive analytics half yearly roadmap with multiple activities formats. This PPT presentation is Google Slides compatible, therefore, you can share it easily with the collaborators for measuring the progress. Also, the presentation is available in both standard screen and widescreen aspect ratios. So edit the template design by modifying the font size, font type, color, and shapes as per your requirements. As this PPT design is fully editable it can be presented in PDF, JPG and PNG formats.

Predictive Analytics Half Yearly Roadmap With Use Cases Portrait
Presenting our jaw dropping predictive analytics half yearly roadmap with use cases portrait. You can alternate the color, font size, font type, and shapes of this PPT layout according to your strategic process. This PPT presentation is compatible with Google Slides and is available in both standard screen and widescreen aspect ratios. You can also download this well researched PowerPoint template design in different formats like PDF, JPG, and PNG. So utilize this visually appealing design by clicking the download button given below.
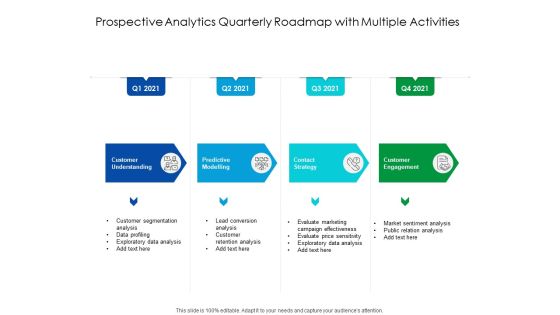
Predictive Analytics Quarterly Roadmap With Multiple Activities Ideas
Introducing our predictive analytics quarterly roadmap with multiple activities ideas. This PPT presentation is Google Slides compatible, therefore, you can share it easily with the collaborators for measuring the progress. Also, the presentation is available in both standard screen and widescreen aspect ratios. So edit the template design by modifying the font size, font type, color, and shapes as per your requirements. As this PPT design is fully editable it can be presented in PDF, JPG and PNG formats.

Predictive Analytics Quarterly Roadmap With Use Cases Designs
Presenting our jaw dropping predictive analytics quarterly roadmap with use cases designs. You can alternate the color, font size, font type, and shapes of this PPT layout according to your strategic process. This PPT presentation is compatible with Google Slides and is available in both standard screen and widescreen aspect ratios. You can also download this well researched PowerPoint template design in different formats like PDF, JPG, and PNG. So utilize this visually appealing design by clicking the download button given below.

Predictive Analytics Six Months Roadmap With Multiple Activities Topics
Introducing our predictive analytics six months roadmap with multiple activities topics. This PPT presentation is Google Slides compatible, therefore, you can share it easily with the collaborators for measuring the progress. Also, the presentation is available in both standard screen and widescreen aspect ratios. So edit the template design by modifying the font size, font type, color, and shapes as per your requirements. As this PPT design is fully editable it can be presented in PDF, JPG and PNG formats.

Predictive Analytics Three Months Roadmap With Multiple Activities Elements
Introducing our predictive analytics three months roadmap with multiple activities elements. This PPT presentation is Google Slides compatible, therefore, you can share it easily with the collaborators for measuring the progress. Also, the presentation is available in both standard screen and widescreen aspect ratios. So edit the template design by modifying the font size, font type, color, and shapes as per your requirements. As this PPT design is fully editable it can be presented in PDF, JPG and PNG formats.

Predictive Analytics Three Months Roadmap With Use Cases Background
Presenting our jaw dropping predictive analytics three months roadmap with use cases background. You can alternate the color, font size, font type, and shapes of this PPT layout according to your strategic process. This PPT presentation is compatible with Google Slides and is available in both standard screen and widescreen aspect ratios. You can also download this well researched PowerPoint template design in different formats like PDF, JPG, and PNG. So utilize this visually appealing design by clicking the download button given below.

Retail Industry Outlook Retail Price Management Goals Brochure PDF
Deliver and pitch your topic in the best possible manner with this retail industry outlook retail price management goals brochure pdf. Use them to share invaluable insights on enterprise wide price transparency, price monitoring and analysis, system wide security, real time performance metrics and impress your audience. This template can be altered and modified as per your expectations. So, grab it now.

BI Implementation To Enhance Hiring Process Understanding Working Of Etl Tools For Data Integration Topics PDF
This slide represents the workflow of ETL tools which allows businesses to consolidate data from various databases into single repository. It includes three steps of ETL process such as extracting, transforming and loading data.If you are looking for a format to display your unique thoughts, then the professionally designed BI Implementation To Enhance Hiring Process Understanding Working Of Etl Tools For Data Integration Topics PDF is the one for you. You can use it as a Google Slides template or a PowerPoint template. Incorporate impressive visuals, symbols, images, and other charts. Modify or reorganize the text boxes as you desire. Experiment with shade schemes and font pairings. Alter, share or cooperate with other people on your work. Download BI Implementation To Enhance Hiring Process Understanding Working Of Etl Tools For Data Integration Topics PDF and find out how to give a successful presentation. Present a perfect display to your team and make your presentation unforgettable.

9 Steps Diverging And Converging Relative Circular Flow Arrow Network PowerPoint Templates
We present our 9 steps diverging and converging Relative Circular Flow Arrow Network PowerPoint templates.Use our Ring Charts PowerPoint Templates because with the help of our Slides you can Illustrate these thoughts with this slide. Present our Shapes PowerPoint Templates because you are ready to flap your wings and launch off. All poised are you to touch the sky with glory. Use our Circle Charts PowerPoint Templates because it unravels the process layer by layer and exposes their relevance to the core issue. Use our Business PowerPoint Templates because spell out your advertising plans to increase market share. The feedback has been positive and productive. Use our Process and Flows PowerPoint Templates because this slide helps you to communicate your concerns and educate your team along the path to success.Use these PowerPoint slides for presentations relating to Business, chart, circle, colors, concept, corporate, cycle, data, design, detail, development, diagram, engineering, graphic, ideas, illustration, image, implement, implementation, life, lifecycle, management, model, objects, organization, plan, process, product, professional, project, quality, schema, shape, stack, stage, steps, strategy, structure, success, symbol. The prominent colors used in the PowerPoint template are Orange, Black, Gray. You can be sure our 9 steps diverging and converging Relative Circular Flow Arrow Network PowerPoint templates are Nice. Presenters tell us our data PowerPoint templates and PPT Slides are Tranquil. We assure you our 9 steps diverging and converging Relative Circular Flow Arrow Network PowerPoint templates are Efficacious. Customers tell us our data PowerPoint templates and PPT Slides are One-of-a-kind. Presenters tell us our 9 steps diverging and converging Relative Circular Flow Arrow Network PowerPoint templates are One-of-a-kind. You can be sure our cycle PowerPoint templates and PPT Slides are Stylish.

Business Diagram Tip Of Iceberg Big Data Problems And Analysis Ppt Slide
This PowerPoint template has been designed with graphic of iceberg diagram. This diagram slide depicts concept of big data problem and analysis Download this diagram to create professional presentations.

Interminable Flow Of Circular Boxes 11 Stages Venn Diagram PowerPoint Templates
We present our interminable flow of circular boxes 11 stages Venn Diagram PowerPoint templates.Present our Arrows PowerPoint Templates because you can put down your ideas and present them using our innovative templates. Download and present our Business PowerPoint Templates because maximising sales of your product is the intended destination. Download our Signs PowerPoint Templates because this is an impressive template to unravel your recipe for a mouth watering result. Present our Shapes PowerPoint Templates because your group can behave steady in the top bracket. Download our Spheres PowerPoint Templates because you can Highlight the key components of your entire manufacturing/ business process.Use these PowerPoint slides for presentations relating to Arrows, Business, Chart, Circular, Commerce, Concept, Contribution, Cycle, Development, Diagram, Global, Idea, Informative, Internet, Join, Making, Manage, Management, Market, Marketing, Partner, Paying, Performance, Plans, Process, Productive, Productivity, Profit, Profitable, Project. The prominent colors used in the PowerPoint template are Yellow, Black, Gray. Professionals tell us our interminable flow of circular boxes 11 stages Venn Diagram PowerPoint templates are the best it can get when it comes to presenting. You can be sure our Development PowerPoint templates and PPT Slides are Nice. Customers tell us our interminable flow of circular boxes 11 stages Venn Diagram PowerPoint templates are Ultra. Professionals tell us our Development PowerPoint templates and PPT Slides are Youthful. People tell us our interminable flow of circular boxes 11 stages Venn Diagram PowerPoint templates are specially created by a professional team with vast experience. They diligently strive to come up with the right vehicle for your brilliant Ideas. People tell us our Concept PowerPoint templates and PPT Slides are Endearing.

Marketing And Advertising Analysis Dashboard Based On Demographic Data Demonstration PDF
This slide defines the dashboard analyzing the marketing and advertising based on demographic status. It includes information related to the impression gender, age and designated market area DMA. Showcasing this set of slides titled Marketing And Advertising Analysis Dashboard Based On Demographic Data Demonstration PDF. The topics addressed in these templates are Gender, Impressions, Demographic Data All the content presented in this PPT design is completely editable. Download it and make adjustments in color, background, font etc. as per your unique business setting.

Monthly Company Performance Analysiscompetitor Analysis Pictures PDF
This graph or chart is linked to excel, and changes automatically based on data. Just left click on it and select Edit Data. Deliver and pitch your topic in the best possible manner with this monthly company performance analysiscompetitor analysis pictures pdf. Use them to share invaluable insights on revenue, competitor analysis and impress your audience. This template can be altered and modified as per your expectations. So, grab it now.

Areas For Data Analytics Application With Icons Ppt PowerPoint Presentation Gallery Inspiration PDF
Persuade your audience using this areas for data analytics application with icons ppt powerpoint presentation gallery inspiration pdf. This PPT design covers six stages, thus making it a great tool to use. It also caters to a variety of topics including manufacturing, e commerce, finance . Download this PPT design now to present a convincing pitch that not only emphasizes the topic but also showcases your presentation skills.

Data Integrated Mechanism For Manufacturing Quality Control Automated Manufacturing Process Deployment Mockup PDF
This slide represents data integrated system for manufacturing quality control. It provides information about supply chain, finished goods, visibility, scrap, audit, efficiency, risk mitigation, etc.If you are looking for a format to display your unique thoughts, then the professionally designed Data Integrated Mechanism For Manufacturing Quality Control Automated Manufacturing Process Deployment Mockup PDF is the one for you. You can use it as a Google Slides template or a PowerPoint template. Incorporate impressive visuals, symbols, images, and other charts. Modify or reorganize the text boxes as you desire. Experiment with shade schemes and font pairings. Alter, share or cooperate with other people on your work. Download Data Integrated Mechanism For Manufacturing Quality Control Automated Manufacturing Process Deployment Mockup PDF and find out how to give a successful presentation. Present a perfect display to your team and make your presentation unforgettable.

Pareto Graph For Category Wise Data Analysis Ppt PowerPoint Presentation File Example File PDF
Presenting this set of slides with name pareto graph for category wise data analysis ppt powerpoint presentation file example file pdf. The topics discussed in these slide is pareto graph for category wise data analysis. This is a completely editable PowerPoint presentation and is available for immediate download. Download now and impress your audience.
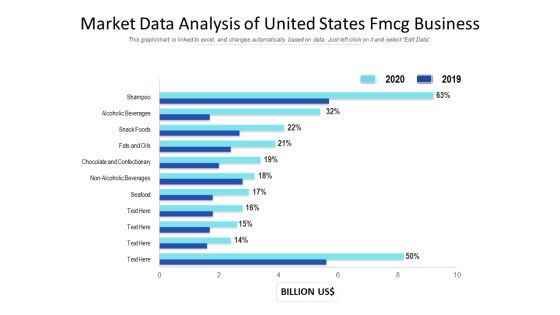
Market Data Analysis Of United States Fmcg Business Ppt PowerPoint Presentation Gallery Deck PDF
Showcasing this set of slides titled market data analysis of united states fmcg business ppt powerpoint presentation gallery deck pdf. The topics addressed in these templates are market data analysis of united states fmcg business. All the content presented in this PPT design is completely editable. Download it and make adjustments in color, background, font etc. as per your unique business setting.
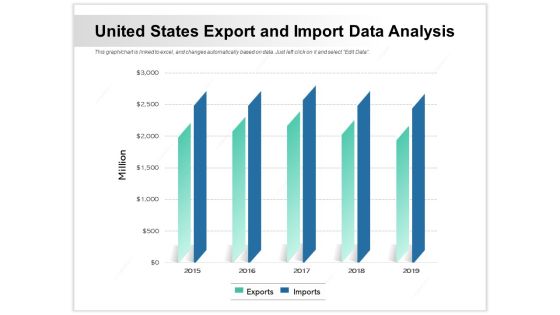
United States Export And Import Data Analysis Ppt PowerPoint Presentation Pictures Clipart Images PDF
Showcasing this set of slides titled united states export and import data analysis ppt powerpoint presentation pictures clipart images pdf. The topics addressed in these templates are united states export and import data analysis. All the content presented in this PPT design is completely editable. Download it and make adjustments in color, background, font etc. as per your unique business setting.

Qualitative Concept Testing Data Analysis Ppt PowerPoint Presentation File Graphics Design PDF
Deliver an awe-inspiring pitch with this creative qualitative concept testing data analysis ppt powerpoint presentation file graphics design pdf bundle. Topics like data analysis can be discussed with this completely editable template. It is available for immediate download depending on the needs and requirements of the user.

Customer Relationship Management CRM Data Analysis Activities Ppt File Format PDF
Deliver an awe inspiring pitch with this creative customer relationship management CRM data analysis activities ppt file format pdf bundle. Topics like completed activities, local profit, CRM data analysis can be discussed with this completely editable template. It is available for immediate download depending on the needs and requirements of the user.

Customer Relationship Management Action Plan Crm Data Analysis Current Ideas PDF
Deliver an awe inspiring pitch with this creative customer relationship management action plan crm data analysis current ideas pdf bundle. Topics like crm data analysis can be discussed with this completely editable template. It is available for immediate download depending on the needs and requirements of the user.

Major Issues Associated With Firm Data Collection And Analysis Demonstration PDF
Showcasing this set of slides titled major issues associated with firm data collection and analysis demonstration pdf. The topics addressed in these templates are major issues associated with firm data collection and analysis. All the content presented in this PPT design is completely editable. Download it and make adjustments in color, background, font etc. as per your unique business setting.

Comprehensive Customer Data Platform Guide Optimizing Promotional Initiatives Define Customer Data Collection Goals Diagrams PDF
The following slide covers various customer data gathering goals to boost CDP adoption and maximizing return on investments. It includes elements such as achieving more conversions with personalization, enhancing profit margins, understanding customer need etc. Retrieve professionally designed Comprehensive Customer Data Platform Guide Optimizing Promotional Initiatives Define Customer Data Collection Goals Diagrams PDF to effectively convey your message and captivate your listeners. Save time by selecting pre made slideshows that are appropriate for various topics, from business to educational purposes. These themes come in many different styles, from creative to corporate, and all of them are easily adjustable and can be edited quickly. Access them as PowerPoint templates or as Google Slides themes. You do not have to go on a hunt for the perfect presentation because Slidegeeks got you covered from everywhere.
