It Operations Dashboard

Strategies To Deploy Diversity In Workplace Performance Measuring Dashboard For Diversity And Inclusion Program Introduction PDF
This slide depicts the performance measuring dashboard for diversity and inclusion program providing information regarding the employee engagement, workforce by disability type, unconscious biases complaints etc. Formulating a presentation can take up a lot of effort and time, so the content and message should always be the primary focus. The visuals of the PowerPoint can enhance the presenters message, so our Inclusive, Welcoming Environment, Leadership Diversity, Employee Engagement was created to help save time. Instead of worrying about the design, the presenter can concentrate on the message while our designers work on creating the ideal templates for whatever situation is needed. Slidegeeks has experts for everything from amazing designs to valuable content, we have put everything into Inclusive, Welcoming Environment, Leadership Diversity, Employee Engagement.

Adopting IMC Technique To Boost Brand Recognition Kpi Dashboard To Analyze Personal Selling Results Formats PDF
The following slide highlights personal selling efforts of region wise sales representatives to attract new and retain previous customers. It includes elements such as total team sales, weekly, monthly and annual individual outcomes etc. Coming up with a presentation necessitates that the majority of the effort goes into the content and the message you intend to convey. The visuals of a PowerPoint presentation can only be effective if it supplements and supports the story that is being told. Keeping this in mind our experts created Adopting IMC Technique To Boost Brand Recognition Kpi Dashboard To Analyze Personal Selling Results Formats PDF to reduce the time that goes into designing the presentation. This way, you can concentrate on the message while our designers take care of providing you with the right template for the situation.

Online Ads Strategic Plan For Effective Marketing Email Promotion Campaign Dashboard For Performance Background PDF
This slide represents website promotion dashboard. It covers total visits, average session duration, bounce rate, page views etc. Create an editable Online Ads Strategic Plan For Effective Marketing Email Marketing Software Solutions For Brand Promotion Guidelines PDF that communicates your idea and engages your audience. Whether youre presenting a business or an educational presentation, pre designed presentation templates help save time. Online Ads Strategic Plan For Effective Marketing Email Marketing Software Solutions For Brand Promotion Guidelines PDF is highly customizable and very easy to edit, covering many different styles from creative to business presentations. Slidegeeks has creative team members who have crafted amazing templates. So, go and get them without any delay.

Dashboard For Impact Of Hyper Automation And RPA On Healthcare Industry Diagrams PDF
Purpose of the following slide is to provide an overview of RPA and Hyper automation impact on healthcare industry as it displays essential KPIs such as process speed, employee engagement and reduction in human error etc. Presenting this PowerPoint presentation, titled ashboard For Impact Of Hyper Automation And RPA On Healthcare Industry Diagrams PDF, with topics curated by our researchers after extensive research. This editable presentation is available for immediate download and provides attractive features when used. Download now and captivate your audience. Presenting this ashboard For Impact Of Hyper Automation And RPA On Healthcare Industry Diagrams PDF. Our researchers have carefully researched and created these slides with all aspects taken into consideration. This is a completely customizable ashboard For Impact Of Hyper Automation And RPA On Healthcare Industry Diagrams PDF that is available for immediate downloading. Download now and make an impact on your audience. Highlight the attractive features available with our PPTs.
Operating Cost Reduction Ppt PowerPoint Presentation Outline Smartart Cpb
This is a operating cost reduction ppt powerpoint presentation outline smartart cpb. This is a three stage process. The stages in this process are operating cost reduction.
Issues And Impact Of Failure Mode And Effects Analysis Dashboard Process Failure Mode Effects Analysis PFMEA Icons PDF
Deliver and pitch your topic in the best possible manner with this Issues And Impact Of Failure Mode And Effects Analysis Dashboard Process Failure Mode Effects Analysis PFMEA Icons PDF. Use them to share invaluable insights on Operator Instructions, Operator Instructions, Recommended Actions and impress your audience. This template can be altered and modified as per your expectations. So, grab it now.
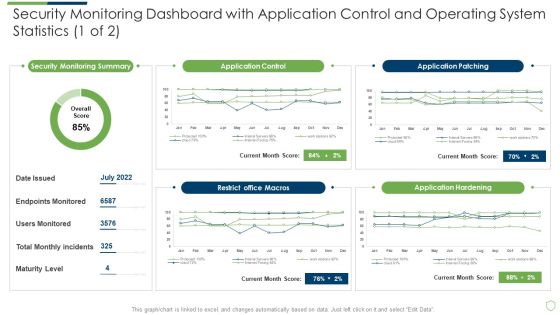
Modern Security Observation Plan To Eradicate Cybersecurity Risk And Data Breach Security Monitoring Dashboard With Application Slides PDF
Deliver and pitch your topic in the best possible manner with this modern security observation plan to eradicate cybersecurity risk and data breach security monitoring dashboard with application slides pdf. Use them to share invaluable insights on security monitoring dashboard with application control and operating system statistics and impress your audience. This template can be altered and modified as per your expectations. So, grab it now.

Crm Operational Illustration Ppt Sample
This is a crm operational illustration ppt sample. This is a six stage process. The stages in this process are customer service systems, marketing systems, sales systems, collaborative crm system, data mining, data warehouse, front office operational crm, back office analytical crm.
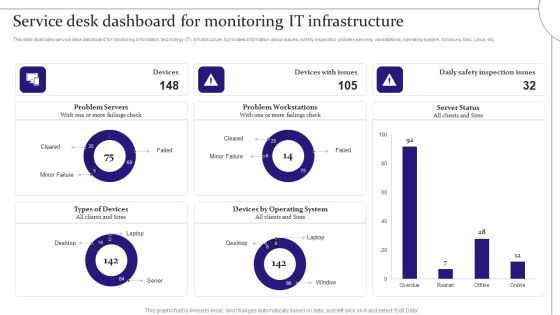
Service Desk Dashboard For Monitoring It Infrastructure Digitalization Of Service Desk Administration Ppt Summary Graphics Example PDF
This slide illustrates service desk dashboard for monitoring information technology IT infrastructure. It provides information about issues, safety inspection, problem servers, workstations, operating system, Windows, Mac, Linux, etc. Do you have to make sure that everyone on your team knows about any specific topic I yes, then you should give Service Desk Dashboard For Monitoring It Infrastructure Digitalization Of Service Desk Administration Ppt Summary Graphics Example PDF a try. Our experts have put a lot of knowledge and effort into creating this impeccable Service Desk Dashboard For Monitoring It Infrastructure Digitalization Of Service Desk Administration Ppt Summary Graphics Example PDF. You can use this template for your upcoming presentations, as the slides are perfect to represent even the tiniest detail. You can download these templates from the Slidegeeks website and these are easy to edit. So grab these today.
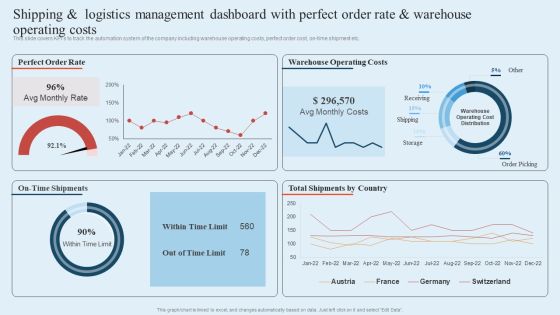
Integrating Logistics Automation Solution Shipping And Logistics Management Dashboard With Perfect Order Rate Ppt Infographics Files PDF
This slide covers KPIs to track the automation system of the company including warehouse operating costs, perfect order cost, on-time shipment etc. Crafting an eye-catching presentation has never been more straightforward. Let your presentation shine with this tasteful yet straightforward Integrating Logistics Automation Solution Shipping And Logistics Management Dashboard With Perfect Order Rate Ppt Infographics Files PDF template. It offers a minimalistic and classy look that is great for making a statement. The colors have been employed intelligently to add a bit of playfulness while still remaining professional. Construct the ideal Integrating Logistics Automation Solution Shipping And Logistics Management Dashboard With Perfect Order Rate Ppt Infographics Files PDF that effortlessly grabs the attention of your audience Begin now and be certain to wow your customers.
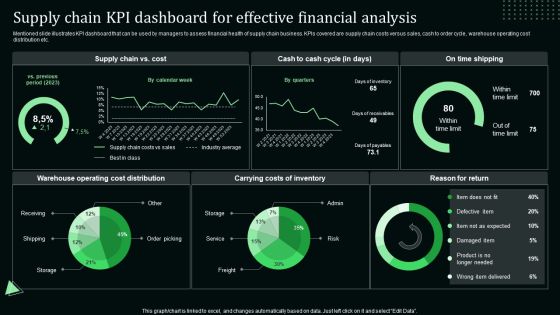
Supply Chain Kpi Dashboard For Effective Financial Analysis Stand Out Digital Supply Chain Tactics Enhancing Graphics PDF
Mentioned slide illustrates KPI dashboard that can be used by managers to assess financial health of supply chain business. KPIs covered are supply chain costs versus sales, cash to order cycle, warehouse operating cost distribution etc.Coming up with a presentation necessitates that the majority of the effort goes into the content and the message you intend to convey. The visuals of a PowerPoint presentation can only be effective if it supplements and supports the story that is being told. Keeping this in mind our experts created Supply Chain Kpi Dashboard For Effective Financial Analysis Stand Out Digital Supply Chain Tactics Enhancing Graphics PDF to reduce the time that goes into designing the presentation. This way, you can concentrate on the message while our designers take care of providing you with the right template for the situation.

Techniques For Effective Supply Chain Management KPI Dashboard To Assess Performance Of Order And Shipments Structure PDF
This slide covers KPI dashboard to assess performance of integrating warehouse management system. It involves key details such as overall warehouse operating costs, perfect order rate and total number of shipments. Boost your pitch with our creative Techniques For Effective Supply Chain Management KPI Dashboard To Assess Performance Of Order And Shipments Structure PDF. Deliver an awe-inspiring pitch that will mesmerize everyone. Using these presentation templates you will surely catch everyones attention. You can browse the ppts collection on our website. We have researchers who are experts at creating the right content for the templates. So you do not have to invest time in any additional work. Just grab the template now and use them.

Kpi Metrics Dashboard To Analyze The Effectiveness Of New Product Launch Launching New Beverage Product Diagrams PDF
The following slide outlines key performance indicator KPI dashboard which can be used to measure the success of product launch. The kpis are total units, revenue, average selling price ASP, number of penetrated planned customers etc. Create an editable Kpi Metrics Dashboard To Analyze The Effectiveness Of New Product Launch Launching New Beverage Product Diagrams PDF that communicates your idea and engages your audience. Whether you are presenting a business or an educational presentation, pre-designed presentation templates help save time. Kpi Metrics Dashboard To Analyze The Effectiveness Of New Product Launch Launching New Beverage Product Diagrams PDF is highly customizable and very easy to edit, covering many different styles from creative to business presentations. Slidegeeks has creative team members who have crafted amazing templates. So, go and get them without any delay.
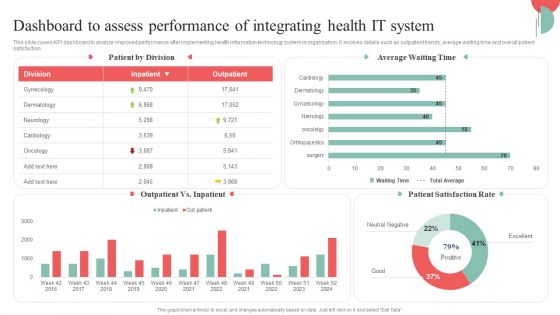
Incorporating HIS To Enhance Healthcare Services Dashboard To Assess Performance Of Integrating Health IT System Diagrams PDF
This slide covers KPI dashboard to analyze improved performance after implementing health information technology system in organization. It involves details such as outpatient trends, average waiting time and overall patient satisfaction. Create an editable Incorporating HIS To Enhance Healthcare Services Dashboard To Assess Performance Of Integrating Health IT System Diagrams PDF that communicates your idea and engages your audience. Whether youre presenting a business or an educational presentation, pre designed presentation templates help save time. Incorporating HIS To Enhance Healthcare Services Dashboard To Assess Performance Of Integrating Health IT System Diagrams PDF is highly customizable and very easy to edit, covering many different styles from creative to business presentations. Slidegeeks has creative team members who have crafted amazing templates. So, go and get them without any delay.

Web 3 0 Blockchain Based P2E Mobile Game Sector Report Promotional Plan Dashboard For Measuring Unique Visitors Topics PDF
The following slide displays a detailed dashboard to measure website performance of P2E web3 based NFT game. It highlights essential elements such as session frequency, visit frequency, content origin etc. Do you have to make sure that everyone on your team knows about any specific topic. I yes, then you should give Web 3 0 Blockchain Based P2E Mobile Game Sector Report Promotional Plan Dashboard For Measuring Unique Visitors Information PDF a try. Our experts have put a lot of knowledge and effort into creating this impeccable Web 3 0 Blockchain Based P2E Mobile Game Sector Report Promotional Plan Dashboard For Measuring Unique Visitors Topics PDF. You can use this template for your upcoming presentations, as the slides are perfect to represent even the tiniest detail. You can download these templates from the Slidegeeks website and these are easy to edit. So grab these today.
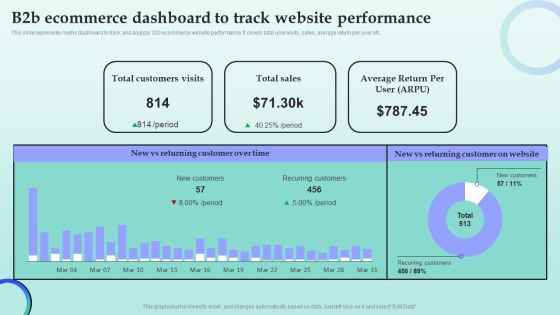
Strategies For Successful Customer Base Development In B2b M Commerce B2b Ecommerce Dashboard To Track Website Sample PDF
This slide represents metric dashboard to track and analyze b2b ecommerce website performance. It covers total user visits, sales, average return per user etc. If you are looking for a format to display your unique thoughts, then the professionally designed Strategies For Successful Customer Base Development In B2b M Commerce B2b Ecommerce Dashboard To Track Website Sample PDF is the one for you. You can use it as a Google Slides template or a PowerPoint template. Incorporate impressive visuals, symbols, images, and other charts. Modify or reorganize the text boxes as you desire. Experiment with shade schemes and font pairings. Alter, share or cooperate with other people on your work. Download Strategies For Successful Customer Base Development In B2b M Commerce B2b Ecommerce Dashboard To Track Website Sample PDF and find out how to give a successful presentation. Present a perfect display to your team and make your presentation unforgettable.

Niche Marketing Guide To Target Specific Customer Groups Evaluating Social Media Results With Kpi Dashboard Inspiration PDF
The following slide represents KPI dashboard to evaluate social media results of micromarketing to anticipate campaign responses. It includes elements such as social events, facebook shares, twitter retweets, interactions etc. Are you searching for a Niche Marketing Guide To Target Specific Customer Groups Evaluating Social Media Results With Kpi Dashboard Inspiration PDF that is uncluttered, straightforward, and original Its easy to edit, and you can change the colors to suit your personal or business branding. For a presentation that expresses how much effort you have put in, this template is ideal. With all of its features, including tables, diagrams, statistics, and lists, its perfect for a business plan presentation. Make your ideas more appealing with these professional slides. Download Niche Marketing Guide To Target Specific Customer Groups Evaluating Social Media Results With Kpi Dashboard Inspiration PDF from Slidegeeks today.

Call Agents Performance Update With Satisfaction Scorecall Agents Performance Kpi Dashboard Ppt PowerPoint Presentation Gallery Background PDF
Presenting this set of slides with name call agents performance update with satisfaction scorecall agents performance kpi dashboard ppt powerpoint presentation gallery background pdf. The topics discussed in these slides are total calls, avg answer speed, abandon rate, avg calls, minute, satisfaction score by agent, sla limits. This is a completely editable PowerPoint presentation and is available for immediate download. Download now and impress your audience.
Food Processing Industry Latest Insights Trends And Analytics KPI Dashboard For Tracking Supply Chain Costs Demonstration PDF
This slide represents the KPI dashboard to track the multiple cost associated with supply chain in food manufacturing industry. It includes information regarding cash to cash cycle in days, carry cost of inventory along with details of net sales. There are so many reasons you need a Food Processing Industry Latest Insights Trends And Analytics KPI Dashboard For Tracking Supply Chain Costs Demonstration PDF. The first reason is you can not spend time making everything from scratch, Thus, Slidegeeks has made presentation templates for you too. You can easily download these templates from our website easily.

Complete Strategic Manual For Direct Mail Marketing Kpi Dashboard To Track Direct Mail Campaign Results Inspiration PDF
This slide covers dashboard to assess results of direct mail campaign. It involves details such as total number of recipients, number of delivered items, re routed and mailing breakdown status. Take your projects to the next level with our ultimate collection of Complete Strategic Manual For Direct Mail Marketing Kpi Dashboard To Track Direct Mail Campaign Results Inspiration PDF. Slidegeeks has designed a range of layouts that are perfect for representing task or activity duration, keeping track of all your deadlines at a glance. Tailor these designs to your exact needs and give them a truly corporate look with your own brand colors they will make your projects stand out from the rest.
Strategies For Successful Customer Base Development In B2b M Commerce B2b Sales Performance Tracking Dashboard Demonstration PDF
This slide represents metric dashboard to track sales performance on e-commerce website. It cover performance indicators such as sales breakdown, order breakdown, recurring sales etc. Make sure to capture your audiences attention in your business displays with our gratis customizable Strategies For Successful Customer Base Development In B2b M Commerce B2b Sales Performance Tracking Dashboard Demonstration PDF. These are great for business strategies, office conferences, capital raising or task suggestions. If you desire to acquire more customers for your tech business and ensure they stay satisfied, create your own sales presentation with these plain slides.

New Staff Onboarding Program HR Induction Program Dashboard Highlighting Training Cost And Active Employee Count Graphics PDF
This slide highlights the HR induction program dashboard which includes weekly absenteeism rate, new hire count by gender, active employee count by region and age group and induction program cost. Coming up with a presentation necessitates that the majority of the effort goes into the content and the message you intend to convey. The visuals of a PowerPoint presentation can only be effective if it supplements and supports the story that is being told. Keeping this in mind our experts created New Staff Onboarding Program HR Induction Program Dashboard Highlighting Training Cost And Active Employee Count Graphics PDF to reduce the time that goes into designing the presentation. This way, you can concentrate on the message while our designers take care of providing you with the right template for the situation.
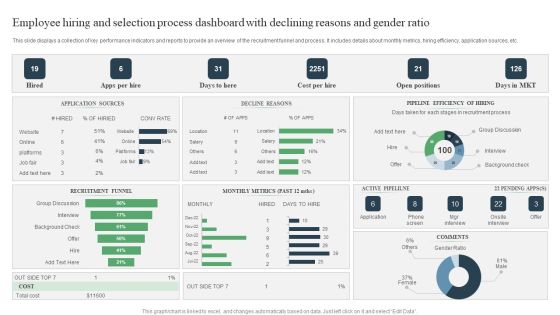
Employee Hiring And Selection Process Dashboard With Declining Reasons And Gender Ratio Ppt PowerPoint Presentation Infographic Template Rules PDF
Pitch your topic with ease and precision using this Employee Hiring And Selection Process Dashboard With Declining Reasons And Gender Ratio Ppt PowerPoint Presentation Infographic Template Rules PDF. This layout presents information on Group Discussion, Active Pipelilne, Onsite Interview. It is also available for immediate download and adjustment. So, changes can be made in the color, design, graphics or any other component to create a unique layout.
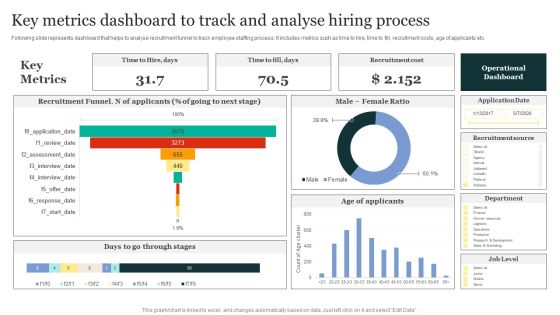
Strategic Approaches To Efficient Candidate Selection Key Metrics Dashboard To Track And Analyse Hiring Process Template PDF
Following slide represents dashboard that helps to analyse recruitment funnel to track employee staffing process. It includes metrics such as time to hire, time to fill, recruitment costs, age of applicants etc. Welcome to our selection of the Strategic Approaches To Efficient Candidate Selection Key Metrics Dashboard To Track And Analyse Hiring Process Template PDF. These are designed to help you showcase your creativity and bring your sphere to life. Planning and Innovation are essential for any business that is just starting out. This collection contains the designs that you need for your everyday presentations. All of our PowerPoints are 100 percent editable, so you can customize them to suit your needs. This multi-purpose template can be used in various situations. Grab these presentation templates today
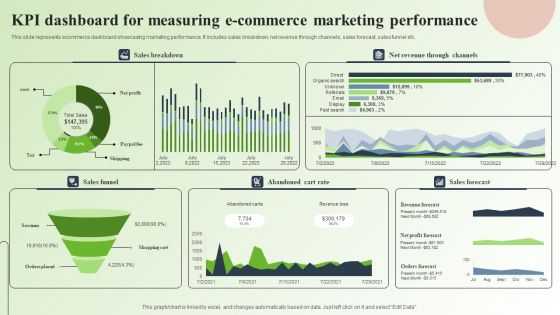
Strategic Guide For Mastering E Commerce Marketing Kpi Dashboard For Measuring E Commerce Marketing Performance Infographics PDF
This slide represents ecommerce dashboard showcasing marketing performance. It includes sales breakdown, net revenue through channels, sales forecast, sales funnel etc. Slidegeeks is here to make your presentations a breeze with Strategic Guide For Mastering E Commerce Marketing Kpi Dashboard For Measuring E Commerce Marketing Performance Infographics PDF With our easy to use and customizable templates, you can focus on delivering your ideas rather than worrying about formatting. With a variety of designs to choose from, you are sure to find one that suits your needs. And with animations and unique photos, illustrations, and fonts, you can make your presentation pop. So whether you are giving a sales pitch or presenting to the board, make sure to check out Slidegeeks first.
Effective NPO Promotional Strategies For Recruit Volunteers Nonprofit Dashboard To Measure Amount Of Funds Raised Demonstration PDF
This slide provides an overview of the strategies adopted by marketers to reach and attract audience for fundraising. The tactics covered are email, video, social media and event marketing. Create an editable Effective NPO Promotional Strategies For Recruit Volunteers Nonprofit Dashboard To Measure Amount Of Funds Raised Demonstration PDF that communicates your idea and engages your audience. Whether you are presenting a business or an educational presentation, pre-designed presentation templates help save time. Effective NPO Promotional Strategies For Recruit Volunteers Nonprofit Dashboard To Measure Amount Of Funds Raised Demonstration PDF is highly customizable and very easy to edit, covering many different styles from creative to business presentations. Slidegeeks has creative team members who have crafted amazing templates. So, go and get them without any delay.
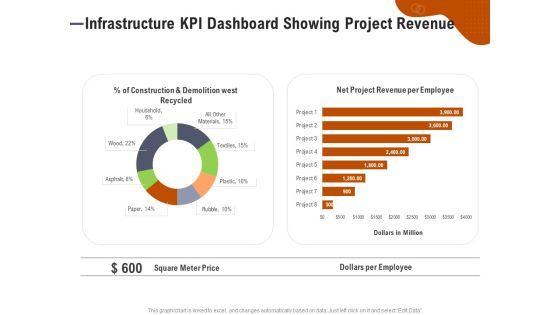
Key Features For Effective Business Management Infrastructure KPI Dashboard Showing Project Revenue Ppt Ideas File Formats PDF
Presenting this set of slides with name key features for effective business management infrastructure kpi dashboard showing project revenue ppt ideas file formats pdf. The topics discussed in these slides are construction and demolition west recycled, net project revenue per employee, square meter price, dollars per employee. This is a completely editable PowerPoint presentation and is available for immediate download. Download now and impress your audience.
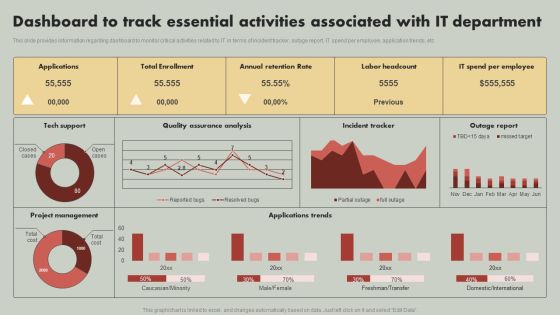
IT Reducing Costs And Management Tips Dashboard To Track Essential Activities Associated With IT Department Summary PDF
This slide provides information regarding dashboard to monitor critical activities related to IT in terms of incident tracker, outage report, IT spend per employee, application trends, etc. Are you in need of a template that can accommodate all of your creative concepts This one is crafted professionally and can be altered to fit any style. Use it with Google Slides or PowerPoint. Include striking photographs, symbols, depictions, and other visuals. Fill, move around, or remove text boxes as desired. Test out color palettes and font mixtures. Edit and save your work, or work with colleagues. Download IT Reducing Costs And Management Tips Dashboard To Track Essential Activities Associated With IT Department Summary PDF and observe how to make your presentation outstanding. Give an impeccable presentation to your group and make your presentation unforgettable.
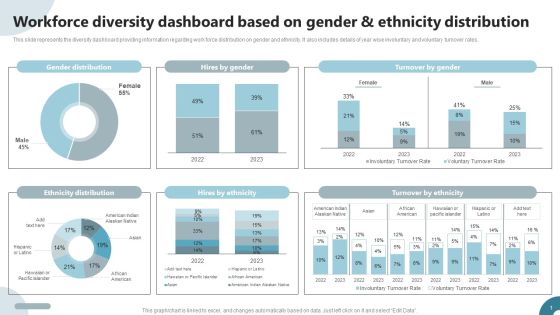
Strategies To Deploy Diversity In Workplace Workforce Diversity Dashboard Based On Gender And Ethnicity Distribution Portrait PDF
This slide represents the diversity dashboard providing information regarding work force distribution on gender and ethnicity. It also includes details of year wise involuntary and voluntary turnover rates. Retrieve professionally designed Strategies To Deploy Diversity In Workplace Workforce Diversity Dashboard Based On Gender And Ethnicity Distribution Portrait PDF to effectively convey your message and captivate your listeners. Save time by selecting pre-made slideshows that are appropriate for various topics, from business to educational purposes. These themes come in many different styles, from creative to corporate, and all of them are easily adjustable and can be edited quickly. Access them as PowerPoint templates or as Google Slides themes. You dont have to go on a hunt for the perfect presentation because Slidegeeks got you covered from everywhere.

BPA Tools For Process Enhancement And Cost Minimization KPI Dashboard To Track Automation Performance In Employee Onboarding Graphics PDF
The following slide outlines performance key performance indicator KPI which can be used to evaluate business process automation performance in employee onboarding. The metrics highlighted in the slide are onboarding completion status, hires per office, etc. There are so many reasons you need a BPA Tools For Process Enhancement And Cost Minimization KPI Dashboard To Track Automation Performance In Employee Onboarding Graphics PDF. The first reason is you can not spend time making everything from scratch, Thus, Slidegeeks has made presentation templates for you too. You can easily download these templates from our website easily.

Operating System Network Analysis Example Ppt Presentation
This is a operating system network analysis example ppt presentation. This is a six stage process. The stages in this process are anomaly detection, common dashboard and reporting, network traffic analysis, prevent, repair, prioritize.

Dashboards And Scorecards Comparison Diagram Ppt Slides
This is a dashboards and scorecards comparison diagram ppt slides. This is a three stage process. The stages in this process are dashboard, balanced scorecard, differences, performance management, periodically monthly, gps shows how will arrive, is used for, is update, in automobile it is, performance monitoring, in real time, automobile dashboard shows how your car is operating.
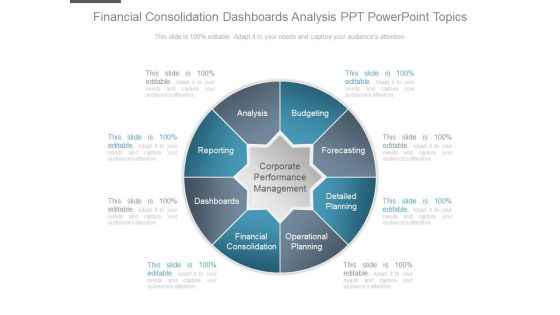
Financial Consolidation Dashboards Analysis Ppt Powerpoint Topics
This is a financial consolidation dashboards analysis ppt powerpoint topics. This is a eight stage process. The stages in this process are corporate performance management, budgeting, forecasting, detailed planning, operational planning, financial consolidation, dashboards, reporting, analysis.
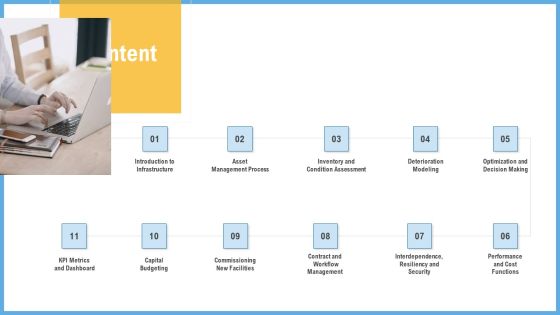
Improving Operational Activities Enterprise Content Professional PDF
This is a improving operational activities enterprise content professional pdf template with various stages. Focus and dispense information on eleven stages using this creative set, that comes with editable features. It contains large content boxes to add your information on topics like asset management process, inventory and condition assessment, deterioration modeling, optimization and decision making, kpi metrics and dashboard. You can also showcase facts, figures, and other relevant content using this PPT layout. Grab it now.

Business Operation Expenses Ppt Example File
This is a business operation expenses ppt example file. This is a three stage process. The stages in this process are operational equipment, raw material, salary, food beverage, other equipment.

Operation Cost Ppt PowerPoint Presentation Background Designs
This is a operation cost ppt powerpoint presentation background designs. This is a three stage process. The stages in this process are operational equipment, raw material, salary, food beverage, other equipments.

Other Operational And Financial Kpis Inspiration PDF
The slide provides five years graphs of major KPIs key performance indicators, which might help the company to track its performance. Covered KPIs include revenue, total passengers, operating income, customer satisfaction rate etc.Deliver an awe-inspiring pitch with this creative other operational and financial KPIs inspiration pdf. bundle. Topics like total passengers, operating income, revenue, 2017 to 2021 can be discussed with this completely editable template. It is available for immediate download depending on the needs and requirements of the user.

Other Operational And Financial Kpis Information PDF
The slide provides five years graphs of major KPIs key performance indicators, which might help the company to track its performance. Covered KPIs include revenue, total passengers, operating income, customer satisfaction rate etc. Deliver an awe inspiring pitch with this creative other operational and financial kpis information pdf bundle. Topics like revenue, operating income, customer satisfaction can be discussed with this completely editable template. It is available for immediate download depending on the needs and requirements of the user.
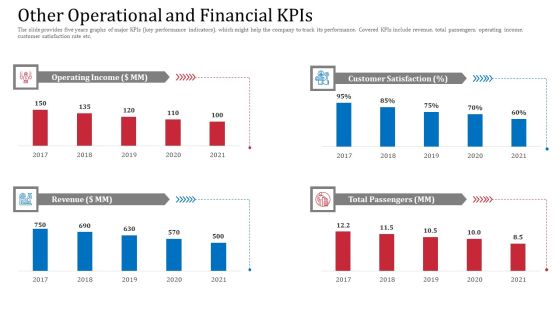
Other Operational And Financial Kpis Demonstration PDF
The slide provides five years graphs of major KPIs key performance indicators, which might help the company to track its performance. Covered KPIs include revenue, total passengers, operating income, customer satisfaction rate etc.Deliver and pitch your topic in the best possible manner with this other operational and financial kpis demonstration pdf. Use them to share invaluable insights on customer satisfaction, operating income, total passengers and impress your audience. This template can be altered and modified as per your expectations. So, grab it now.

Business Operational Risk Diagram Ppt Model
This is a business operational risk diagram ppt model. This is a six stage process. The stages in this process are operational risk, identification of risk, insurance, business continuity, control activates, monitoring and report.

System For Operational Performance Management Infographics PDF
This slide covers the framework for operational performance management which includes planning, executing, measuring and improving with key business drivers such as people, leadership, operational security, etc. Presenting System For Operational Performance Management Infographics PDF to dispense important information. This template comprises four stages. It also presents valuable insights into the topics including Performance, Procedures, People, Plant. This is a completely customizable PowerPoint theme that can be put to use immediately. So, download it and address the topic impactfully.
Product Manufacturing Dashboards Ppt Icon Inspiration PDF
Following slide shows product manufacturing dashboard. This includes production rate, overall productivity, unit loss and operators availability status.Deliver and pitch your topic in the best possible manner with this product manufacturing dashboards ppt icon inspiration pdf. Use them to share invaluable insights on overall plant productivity, overall productivity, productivity and impress your audience. This template can be altered and modified as per your expectations. So, grab it now.

Business Operating Strategy Process Powerpoint Templates
This is a business operating strategy process powerpoint templates. This is a six stage process. The stages in this process are priority actions, what system support resource, who responsible, when done, how to measure, annual status.

Operating Plan Ppt PowerPoint Presentation Show
This is a operating plan ppt powerpoint presentation show. This is a five stage process. The stages in this process are what system support resources, who responsible, when done, how to measure, how to measure.

Operating Plan Ppt PowerPoint Presentation Ideas Outline
This is a operating plan ppt powerpoint presentation ideas outline. This is a three stage process. The stages in this process are priority actions, what system support resources, who responsible, when done, how to measure.
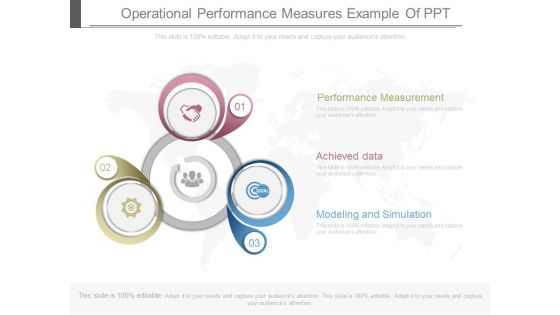
Operational Performance Measures Example Of Ppt
This is a operational performance measures example of ppt. This is a three stage process. The stages in this process are performance measurement, achieved data, modeling and simulation.

Marketing Operating System Sample Diagram Powerpoint Presentation
This is a marketing operating system sample diagram powerpoint presentation. This is a five stage process. The stages in this process are data management, message delivery, confidentiality, partner management, directory, cross channel media, transformation, analytics and insights, delivery management, authentication.
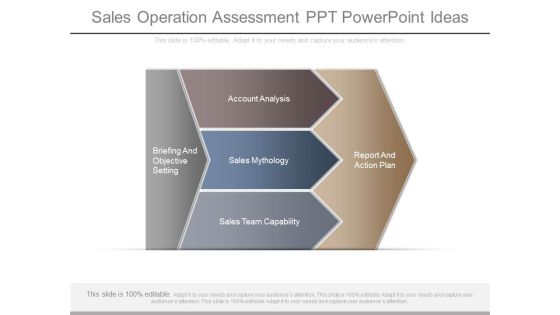
Sales Operation Assessment Ppt Powerpoint Ideas
This is a sales operation assessment ppt powerpoint ideas. This is a three stage process. The stages in this process are account analysis, briefing and objective setting, sales mythology, report and action plan, sales team capability.
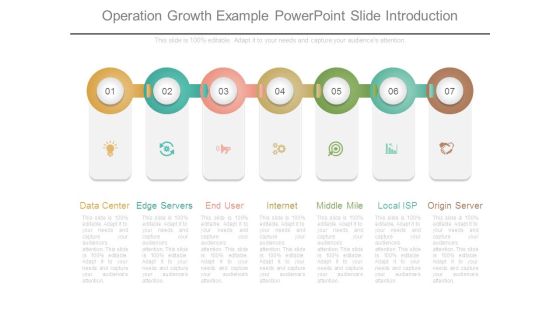
Operation Growth Example Powerpoint Slide Introduction
This is a operation growth example powerpoint slide introduction. This is a seven stage process. The stages in this process are data center, edge servers, end user, internet, middle mile, local isp, origin server.

It Operation Management Kpi Statistics Graphics PDF
This slide covers key performance indicators survey results of IT operation monitoring. The purpose of this template is to measure progress towards specific goals and objectives that have quantifiable milestones. It also serves as benchmark for innovation and improvement. It includes log files, cloud app workloads, NPM etc. Showcasing this set of slides titled It Operation Management Kpi Statistics Graphics PDF. The topics addressed in these templates are KPI Statistics, Management, Network Monitoring. All the content presented in this PPT design is completely editable. Download it and make adjustments in color, background, font etc. as per your unique business setting.

Business Management Dashboards Manufacturing Formats PDF
Deliver an awe-inspiring pitch with this creative business management dashboards manufacturing formats pdf. bundle. Topics like revenue, manufacturing, operations, products can be discussed with this completely editable template. It is available for immediate download depending on the needs and requirements of the user.
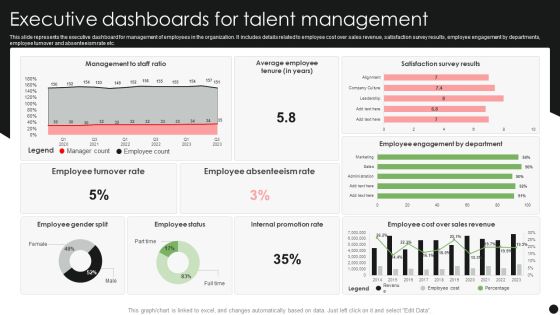
Executive Dashboards For Talent Management Pictures PDF
This slide represents the executive dashboard for management of employees in the organization. It includes details related to employee cost over sales revenue, satisfaction survey results, employee engagement by departments, employee turnover and absenteeism rate etc. Showcasing this set of slides titled Executive Dashboards For Talent Management Pictures PDF. The topics addressed in these templates are Employee Turnover Rate, Employee Absenteeism Rate, Internal Promotion Rate. All the content presented in this PPT design is completely editable. Download it and make adjustments in color, background, font etc. as per your unique business setting.

Chief Executive Dashboards With Financial Topics PDF
This slide represents the dashboard for the CEO to track the global financial performance of the organization. It includes key performance indicators such as revenue, quick ratio, short term assets etc. Showcasing this set of slides titled Chief Executive Dashboards With Financial Topics PDF. The topics addressed in these templates are Short Term Assets, Global Financial Performance, Debt Equity. All the content presented in this PPT design is completely editable. Download it and make adjustments in color, background, font etc. as per your unique business setting.
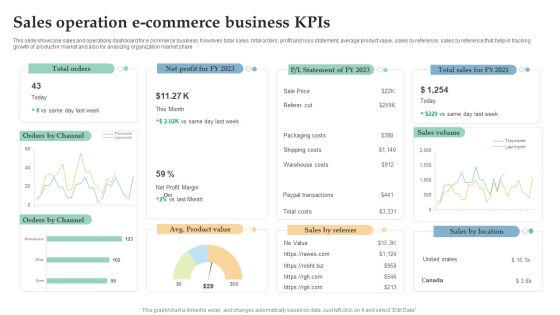
Sales Operation E Commerce Business Kpis Ppt Infographics Design Templates PDF
This slide showcase sales and operations dashboard for e commerce business. It involves total sales, total orders, profit and loss statement, average product value, sales by reference, sales by reference that help in tracking growth of product in market and also for analyzing organization market share. Pitch your topic with ease and precision using this Sales Operation E Commerce Business Kpis Ppt Infographics Design Templates PDF. This layout presents information on Total Orders, Sales Volume, Orders Channel. It is also available for immediate download and adjustment. So, changes can be made in the color, design, graphics or any other component to create a unique layout.

Operational Innovation In Banking Weak Banking Operational Performance Quarterly Clipart PDF
This slide highlights the current state of banking operations and services which includes key performance indicator of one branch which includes new account opened, total account closed, teller transactions, loan disbursal and credit cards issued. Are you searching for a Operational Innovation In Banking Weak Banking Operational Performance Quarterly Clipart PDF that is uncluttered, straightforward, and original Its easy to edit, and you can change the colors to suit your personal or business branding. For a presentation that expresses how much effort youve put in, this template is ideal With all of its features, including tables, diagrams, statistics, and lists, its perfect for a business plan presentation. Make your ideas more appealing with these professional slides. Download Operational Innovation In Banking Weak Banking Operational Performance Quarterly Clipart PDF from Slidegeeks today.
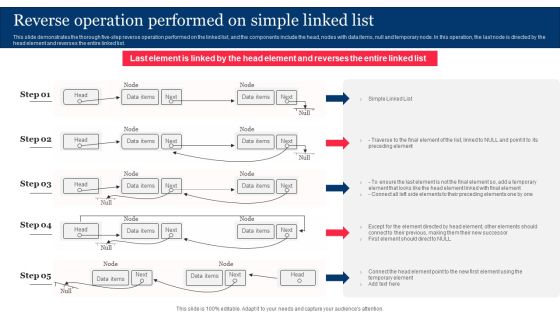
Reverse Operation Performed On Simple Linked List Integrating Linked Data To Enhance Operational Elements PDF
This slide demonstrates the thorough five-step reverse operation performed on the linked list, and the components include the head, nodes with data items, null and temporary node. In this operation, the last node is directed by the head element and reverses the entire linked list.Crafting an eye-catching presentation has never been more straightforward. Let your presentation shine with this tasteful yet straightforward Reverse Operation Performed On Simple Linked List Integrating Linked Data To Enhance Operational Elements PDF template. It offers a minimalistic and classy look that is great for making a statement. The colors have been employed intelligently to add a bit of playfulness while still remaining professional. Construct the ideal Reverse Operation Performed On Simple Linked List Integrating Linked Data To Enhance Operational Elements PDF that effortlessly grabs the attention of your audience Begin now and be certain to wow your customers.

Strategic And Operational Strategy Steps To Develop Successful Operational Plan Graphics PDF
This slide provides an overview of the steps followed to create an effective operation plan for the firm. The steps covered are set strategic plan, determine goals, choose KPIs, involve stakeholders, write and update the plan. Here you can discover an assortment of the finest PowerPoint and Google Slides templates. With these templates, you can create presentations for a variety of purposes while simultaneously providing your audience with an eye catching visual experience. Download Strategic And Operational Strategy Steps To Develop Successful Operational Plan Graphics PDF to deliver an impeccable presentation. These templates will make your job of preparing presentations much quicker, yet still, maintain a high level of quality. Slidegeeks has experienced researchers who prepare these templates and write high quality content for you. Later on, you can personalize the content by editing the Strategic And Operational Strategy Steps To Develop Successful Operational Plan Graphics PDF.

Standard Operating Procedures Marketing Standard Operating Procedure Of Global Marketing Campaign Infographics PDF
This slide showcases the standard operating steps of social media marketing. It includes steps such as identifying customer, analyze social presence, key metrics and develop engaging content. Presenting Standard Operating Procedures Marketing Standard Operating Procedure Of Global Marketing Campaign Infographics PDF to dispense important information. This template comprises seven stages. It also presents valuable insights into the topics including Creating Mission Statement, Analyze And Optimize, Develop Engaging Content. This is a completely customizable PowerPoint theme that can be put to use immediately. So, download it and address the topic impactfully.
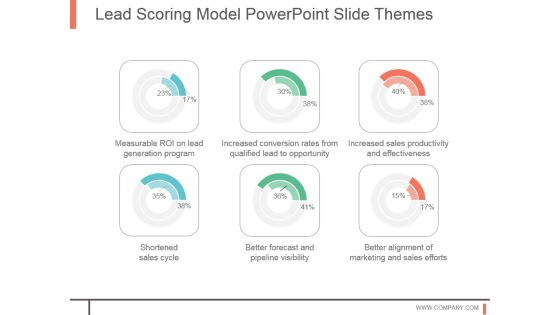
Lead Scoring Model Powerpoint Slide Themes
This is a lead scoring model powerpoint slide themes. This is a six stage process. The stages in this process are measurable roi on lead generation program, increased conversion rates from qualified lead to opportunity, increased sales productivity and effectiveness, shortened sales cycle, better forecast and pipeline visibility, better alignment of marketing and sales efforts.

Benchmarking Vendor Operation Control Procedure Table Of Contents Rules PDF
Deliver an awe-inspiring pitch with this creative benchmarking vendor operation control procedure table of contents rules pdf. bundle. Topics like performance overview, identifying challenges faced by the firm, initiatives we will take to meet the expectations, introducing vendor performance improvement program, performance kpi dashboard can be discussed with this completely editable template. It is available for immediate download depending on the needs and requirements of the user.

 Home
Home