It Change Management Kpis
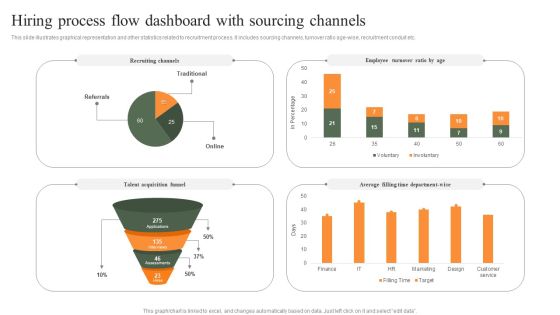
Hiring Process Flow Dashboard With Sourcing Channels Professional PDF
This slide illustrates graphical representation and other statistics related to recruitment process. It includes sourcing channels, turnover ratio age-wise, recruitment conduit etc. Pitch your topic with ease and precision using this Hiring Process Flow Dashboard With Sourcing Channels Professional PDF. This layout presents information on Employee Turnover Ratio, Recruiting Channels, Average. It is also available for immediate download and adjustment. So, changes can be made in the color, design, graphics or any other component to create a unique layout.
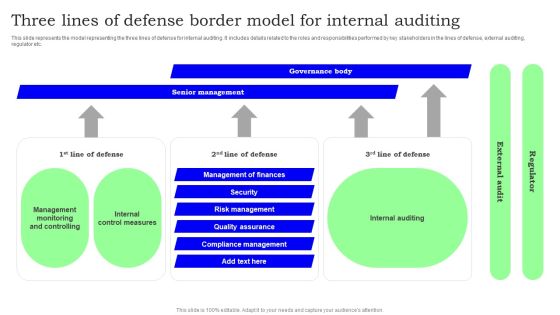
Three Lines Of Defense Border Model For Internal Auditing Formats PDF
This slide represents the model representing the three lines of defense for internal auditing. It includes details related to the roles and responsibilities performed by key stakeholders in the lines of defense, external auditing, regulator etc. Pitch your topic with ease and precision using this Three Lines Of Defense Border Model For Internal Auditing Formats PDF. This layout presents information on Senior Management, Controlling, Control Measures. It is also available for immediate download and adjustment. So, changes can be made in the color, design, graphics or any other component to create a unique layout.

Organization Financial Team Summary With Key Performance Indicators Clipart PDF
This slide represents a report prepared by the finance team showing the financial position of the organization with the help of key performance indicators. It demonstrates data related to current working capital, cash conversion cycle and vendor payment error rate of the company. Pitch your topic with ease and precision using this Organization Financial Team Summary With Key Performance Indicators Clipart PDF. This layout presents information on Current Working Capital, Cash Conversion Cycle. It is also available for immediate download and adjustment. So, changes can be made in the color, design, graphics or any other component to create a unique layout.

Personal Development Plan Diagram Powerpoint Layout
This is a personal development plan diagram powerpoint layout. This is a four stage process. The stages in this process are identify need to change, accept change, take action and measure progress, create plan.
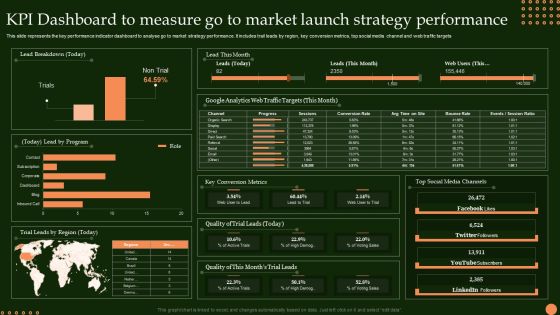
KPI Dashboard To Measure Go To Market Launch Strategy Performance Sample PDF
This slide represents the key performance indicator dashboard to analyse go to market strategy performance. It includes trail leads by region, key conversion metrics, top social media channel and web traffic targets Pitch your topic with ease and precision using this KPI Dashboard To Measure Go To Market Launch Strategy Performance Sample PDF. This layout presents information on Lead Breakdown, Lead By Program, Trial Leads Region. It is also available for immediate download and adjustment. So, changes can be made in the color, design, graphics or any other component to create a unique layout.

Best AI Tool For Media Monitoring Brand24 Ppt File Format PDF
This slide showcases Brand24 media monitoring tool which can be used by businesses to get better insights on their online reputation management. It provides details about customer engagement, dashboard, audience segmentation, etc. If your project calls for a presentation, then Slidegeeks is your go-to partner because we have professionally designed, easy-to-edit templates that are perfect for any presentation. After downloading, you can easily edit Best AI Tool For Media Monitoring Brand24 Ppt File Format PDF and make the changes accordingly. You can rearrange slides or fill them with different images. Check out all the handy templates

Financial Summary Report Institute Showcasing Workplace Highlights Ppt Infographics Inspiration PDF
This slide represents financial institute snapshot. It showcase workplace highlights such as workplace demographics, work space, flexibility, workstation size station etc. Pitch your topic with ease and precision using this Financial Summary Report Institute Showcasing Workplace Highlights Ppt Infographics Inspiration PDF. This layout presents information on Shared Seating Arrangement, Flexibility Workplace, Workplace. It is also available for immediate download and adjustment. So, changes can be made in the color, design, graphics or any other component to create a unique layout.
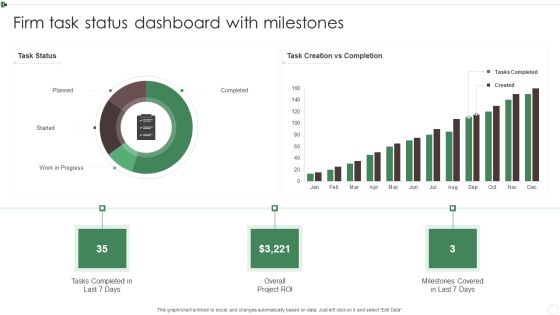
Firm Task Status Dashboard With Milestones Ppt Show Sample PDF
This graph or chart is linked to excel, and changes automatically based on data. Just left click on it and select Edit Data. Showcasing this set of slides titled Firm Task Status Dashboard With Milestones Ppt Show Sample PDF. The topics addressed in these templates are Tasks Completed, Planned, Work Progress, Overall Project ROI. All the content presented in this PPT design is completely editable. Download it and make adjustments in color, background, font etc. as per your unique business setting.

Multiplayer Startup Online Business Simulation Dashboard Demonstration PDF
This slide showcases multiplier startup business simulation dashboard. It provides information about individuals, statistics, team processes, adoption, effectiveness, meetings, alignment, communication, etc. Pitch your topic with ease and precision using this Multiplayer Startup Online Business Simulation Dashboard Demonstration PDF. This layout presents information on Individuals, Team Processes, Statistics. It is also available for immediate download and adjustment. So, changes can be made in the color, design, graphics or any other component to create a unique layout.

Commercial Marketing KPI With Return On Investment Diagrams PDF
This slide templates covers about trade marketing key performing indicators with website visitors, leads by channel, social media reach with yearly goal achievement.Pitch your topic with ease and precision using this Commercial Marketing KPI With Return On Investment Diagrams PDF. This layout presents information on Marketing Spend, Return Investment, Budget Remaining. It is also available for immediate download and adjustment. So, changes can be made in the color, design, graphics or any other component to create a unique layout.
Naas Integrated Solution IT Network As A Service Performance Tracking Dashboard Formats PDF
This slide represents the performance tracking dashboard for Naas, covering service availability, inventory details, software compliance status, service level agreement, alert notifications, number of changes and incidents. Deliver an awe inspiring pitch with this creative Naas Integrated Solution IT Network As A Service Performance Tracking Dashboard Formats PDF bundle. Topics like Network As A Service, Performance Tracking Dashboard can be discussed with this completely editable template. It is available for immediate download depending on the needs and requirements of the user.

Business To Business Digital Marketing Challenges And Solutions Ppt Styles Templates PDF
The following slide showcases several issues faced by marketers. The challenges covered are producing and distributing content, measuring ROI and digital impact. Pitch your topic with ease and precision using this Business To Business Digital Marketing Challenges And Solutions Ppt Styles Templates PDF. This layout presents information on Challenge, Measuring ROI, Measuring Digital Impact. It is also available for immediate download and adjustment. So, changes can be made in the color, design, graphics or any other component to create a unique layout.

Organizations Business Projects Status Report Template Diagrams PDF
The slide showcases a project status dashboard for an organizations multiple operational projects. It highlights teams, project health report, risk status, planned vs actual budget and schedule. Pitch your topic with ease and precision using this Organizations Business Projects Status Report Template Diagrams PDF. This layout presents information on Organizations Business, Projects Status, Report. It is also available for immediate download and adjustment. So, changes can be made in the color, design, graphics or any other component to create a unique layout.

Dashboard Showing Procurement Cycle Time Ppt PowerPoint Presentation Icon Example Topics PDF
Pitch your topic with ease and precision using this dashboard showing procurement cycle time ppt powerpoint presentation icon example topics pdf. This layout presents information on top suppliers by partner status, rate of contract compliance by supplier category, avg procurement cycle supplier classification. It is also available for immediate download and adjustment. So, changes can be made in the color, design, graphics or any other component to create a unique layout.
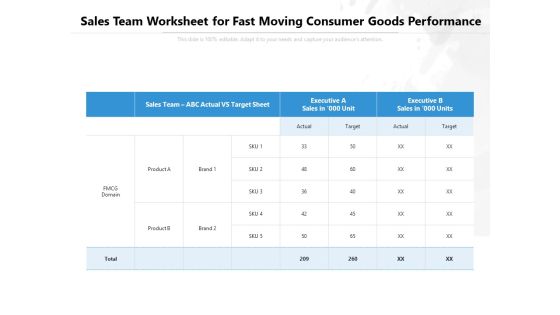
Sales Team Worksheet For Fast Moving Consumer Goods Performance Ppt PowerPoint Presentation Styles Background Images PDF
Pitch your topic with ease and precision using this sales team worksheet for fast moving consumer goods performance ppt powerpoint presentation styles background images pdf. This layout presents information on sales team abc actual vs target sheet, executive a sales in 000 unit, executive b sales in 000 units, product, fmcg domain. It is also available for immediate download and adjustment. So, changes can be made in the color, design, graphics or any other component to create a unique layout.

Social Media Strategy House Framework Graphics PDF
The following slide showcases house diagram aiming to align social media strategy. The diagram includes business context, measurement, social advertising, content and community and level of customer engagement. Pitch your topic with ease and precision using this Social Media Strategy House Framework Graphics PDF. This layout presents information on Social Advertising, Social Content, Social Community. It is also available for immediate download and adjustment. So, changes can be made in the color, design, graphics or any other component to create a unique layout.
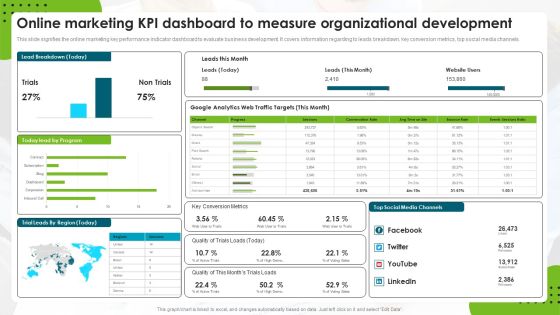
Online Marketing Kpi Dashboard To Measure Organizational Development Rules PDF
This slide signifies the online marketing key performance indicator dashboard to evaluate business development. It covers information regarding to leads breakdown, key conversion metrics, top social media channels. Pitch your topic with ease and precision using this Online Marketing Kpi Dashboard To Measure Organizational Development Rules PDF. This layout presents information on Web Traffic Targets, Google Analytics, Social Media Channels. It is also available for immediate download and adjustment. So, changes can be made in the color, design, graphics or any other component to create a unique layout.

Summary Financial Accounting Statement Profit And Loss Analysis Dashboard Elements PDF
This graph or chart is linked to excel, and changes automatically based on data. Just left click on it and select Edit Data. Deliver an awe inspiring pitch with this creative Summary Financial Accounting Statement Profit And Loss Analysis Dashboard Elements PDF bundle. Topics like P And L Structure Dynamics, Dupont Rations, Debt Coverage Ratios, Creditworthiness Assessment can be discussed with this completely editable template. It is available for immediate download depending on the needs and requirements of the user.

Customer Support Kpi Dashboard For Evaluating Sales Business Process Outsourcing Performance Slides PDF
Pitch your topic with ease and precision using this customer support kpi dashboard for evaluating sales business process outsourcing performance slides pdf. This layout presents information on customer support kpi dashboard for evaluating sales business process outsourcing performance. It is also available for immediate download and adjustment. So, changes can be made in the color, design, graphics or any other component to create a unique layout.

Smartphone App Installation Metrics Dashboard With User Sessions Microsoft PDF
This slide showcases dashboard that can help organization to identify the installation trend of mobile application and formulate strategies in case of declining downloads. Its key components are installs trend, total installs, total sessions and total media source breakdown by revenue. Pitch your topic with ease and precision using this Smartphone App Installation Metrics Dashboard With User Sessions Microsoft PDF. This layout presents information on Smartphone App Installation Metrics Dashboard With User Sessions. It is also available for immediate download and adjustment. So, changes can be made in the color, design, graphics or any other component to create a unique layout.

Customer Service Metrics Dashboard With Net Retention Rate Sample PDF
This slide showcases KPI dashboard for customer service that can help to compare the customer churn rate, revenue churn rate, net retention rate and MRR growth rate as compared to previous month. Its key elements are net promoter score, loyal customer rate, percentage of premium users and customer lifetime value. Pitch your topic with ease and precision using this Customer Service Metrics Dashboard With Net Retention Rate Sample PDF. This layout presents information on Loyal Customer Rate, Premium Users, Customer Lifetime Value. It is also available for immediate download and adjustment. So, changes can be made in the color, design, graphics or any other component to create a unique layout.
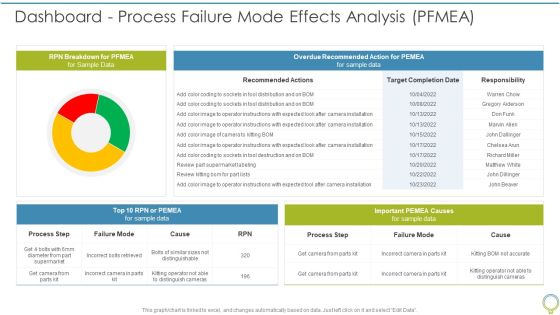
FMEA To Determine Potential Dashboard Process Failure Mode Effects Analysis PFMEA Elements PDF
This graph or chart is linked to excel, and changes automatically based on data. Just left click on it and select Edit Data. Deliver and pitch your topic in the best possible manner with this FMEA To Determine Potential Dashboard Process Failure Mode Effects Analysis PFMEA Elements PDF. Use them to share invaluable insights on RPN Breakdown, Overdue Recommended, Process Step and impress your audience. This template can be altered and modified as per your expectations. So, grab it now.

Comparative Analysis Of Web Application Performance Assessment Tools Diagrams PDF
This slide displays performance inspection tools used by businesses for web application to optimize user experience. It includes elements such as tools, prices, features, competences, platforms and comments. Pitch your topic with ease and precision using this Comparative Analysis Of Web Application Performance Assessment Tools Diagrams PDF. This layout presents information on Devices, Optimize, Metrics. It is also available for immediate download and adjustment. So, changes can be made in the color, design, graphics or any other component to create a unique layout.

Comparative Assessment Of Alpha And Beta Tester Programs Information PDF
This slide illustrates comparison of alpha and beta testing. It includes metrics such as testing kind, main goals, performed by, performed in, applied techniques, etc. Pitch your topic with ease and precision using this Comparative Assessment Of Alpha And Beta Tester Programs Information PDF. This layout presents information on Testing Kind, Main Goals, Performed. It is also available for immediate download and adjustment. So, changes can be made in the color, design, graphics or any other component to create a unique layout.

Enterprise Solutions And Tools Project Monitoring Ppt File Visuals PDF
This slide enterprise solutions and tools for project controls. It provides information about user dashboards, time-phasing, bar charts and graph, collaboration and confidentiality. Pitch your topic with ease and precision using this Enterprise Solutions And Tools Project Monitoring Ppt File Visuals PDF. This layout presents information on User Dashboards, Time Phasing, Collaboration. It is also available for immediate download and adjustment. So, changes can be made in the color, design, graphics or any other component to create a unique layout.

Planning Framework For Creating Business Plan Ppt PowerPoint Presentation Slides Infographics PDF
Pitch your topic with ease and precision using this planning framework for creating business plan ppt powerpoint presentation slides infographics pdf. This layout presents information on business track record, product, service quality, customer perception, metric, strategic objective, purpose, audience. It is also available for immediate download and adjustment. So, changes can be made in the color, design, graphics or any other component to create a unique layout.

Six Leading Factors Of Effective Business Process Ppt PowerPoint Presentation File Slides PDF
Pitch your topic with ease and precision using this six leading factors of effective business process ppt powerpoint presentation file slides pdf. This layout presents information on business process design, motivation and measurement, human resources, policies and rules. It is also available for immediate download and adjustment. So, changes can be made in the color, design, graphics or any other component to create a unique layout.
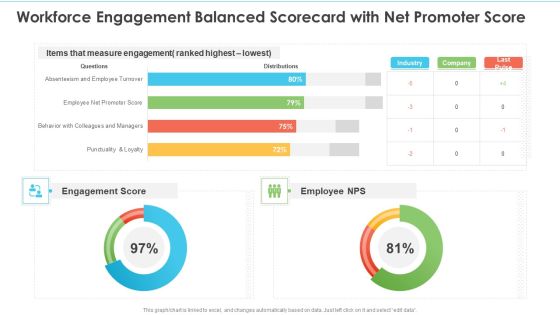
Workforce Engagement Balanced Scorecard With Net Promoter Score Ppt Slides Display PDF
This graph or chart is linked to excel, and changes automatically based on data. Just left click on it and select edit data. Deliver an awe inspiring pitch with this creative Workforce Engagement Balanced Scorecard With Net Promoter Score Ppt Slides Display PDF bundle. Topics like Measure Engagement, Engagement Score, Employee NPS can be discussed with this completely editable template. It is available for immediate download depending on the needs and requirements of the user.

Target Market Assessment With Audience Demographics Inspiration PDF
This slide covers the dashboard for target audience analysis. It includes demographics based on gender, age, region, population density, household structure, and income. Pitch your topic with ease and precision using this Target Market Assessment With Audience Demographics Inspiration PDF. This layout presents information on Target Market Assessment, Audience Demographics . It is also available for immediate download and adjustment. So, changes can be made in the color, design, graphics or any other component to create a unique layout.

Implementation Schedule For Online Advertisement Ecommerce Work Plan Formats PDF
This slides outlines the unique internet marketing and e commerce work plans implementation schedule which assist in faster buying process. It includes objectives, activity planned, measures, channels. Pitch your topic with ease and precision using this Implementation Schedule For Online Advertisement Ecommerce Work Plan Formats PDF. This layout presents information on Objectives, Activity Planned, Measure. It is also available for immediate download and adjustment. So, changes can be made in the color, design, graphics or any other component to create a unique layout.
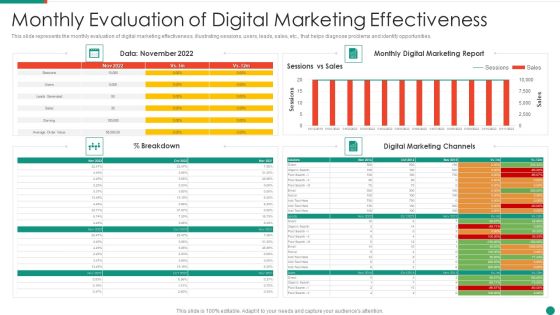
Monthly Evaluation Of Digital Marketing Effectiveness Demonstration PDF
This slide represents the monthly evaluation of digital marketing effectiveness, illustrating sessions, users, leads, sales, etc., that helps diagnose problems and identify opportunities.Pitch your topic with ease and precision using this Metrics To Measure Content Marketing Effectiveness Guidelines PDF This layout presents information on Monthly Evaluation, Digital Marketing, Effectiveness It is also available for immediate download and adjustment. So, changes can be made in the color, design, graphics or any other component to create a unique layout.
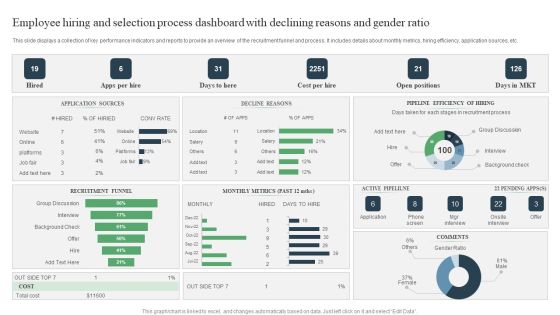
Employee Hiring And Selection Process Dashboard With Declining Reasons And Gender Ratio Ppt PowerPoint Presentation Infographic Template Rules PDF
Pitch your topic with ease and precision using this Employee Hiring And Selection Process Dashboard With Declining Reasons And Gender Ratio Ppt PowerPoint Presentation Infographic Template Rules PDF. This layout presents information on Group Discussion, Active Pipelilne, Onsite Interview. It is also available for immediate download and adjustment. So, changes can be made in the color, design, graphics or any other component to create a unique layout.

IT New Product Launch Journey Structure PDF
This slide demonstrates the new product introduction metrics of IT. It includes parameters such as NPI process metrics, metric calculation, etc. Pitch your topic with ease and precision using this IT New Product Launch Journey Structure PDF. This layout presents information on NPI Process Metrics, Project Delivery Timeliness, Data Source. It is also available for immediate download and adjustment. So, changes can be made in the color, design, graphics or any other component to create a unique layout.
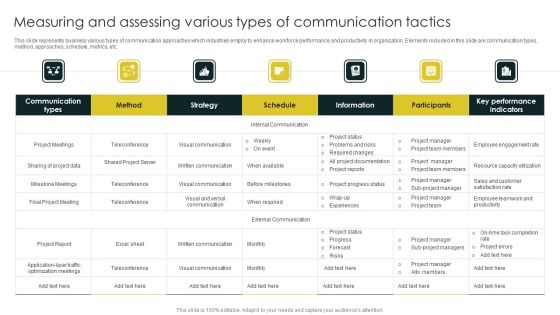
Measuring And Assessing Various Types Of Communication Tactics Introduction PDF
This slide represents business various types of communication approaches which industries employ to enhance workforce performance and productivity in organization. Elements included in this slide are communication types, method, approaches, schedule, metrics, etc. Pitch your topic with ease and precision using this Measuring And Assessing Various Types Of Communication Tactics Introduction PDF. This layout presents information on Communication Types, Strategy, Key Performance Indicators. It is also available for immediate download and adjustment. So, changes can be made in the color, design, graphics or any other component to create a unique layout.
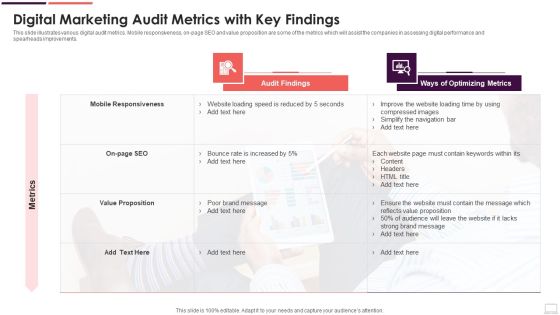
Digital Marketing Audit Metrics With Key Findings Brochure PDF
This slide illustrates various digital audit metrics. Mobile responsiveness, on-page SEO and value proposition are some of the metrics which will assist the companies in assessing digital performance and spearheads improvements. Pitch your topic with ease and precision using this Digital Marketing Audit Metrics With Key Findings Brochure PDF. This layout presents information on Audit Findings, Value Proposition, Optimizing Metrics. It is also available for immediate download and adjustment. So, changes can be made in the color, design, graphics or any other component to create a unique layout.

Vendor Risk Assessment And Controlling Measures Rules PDF
This slide provides glimpse about developing a plan to assess suppliers risk and provide control measures that can help an organization to ensure efficient manufacturing. It includes vendor risk, likelihood of occurrence, severity of impact, etc. If your project calls for a presentation, then Slidegeeks is your go to partner because we have professionally designed, easy to edit templates that are perfect for any presentation. After downloading, you can easily edit Vendor Risk Assessment And Controlling Measures Rules PDF and make the changes accordingly. You can rearrange slides or fill them with different images. Check out all the handy templates.
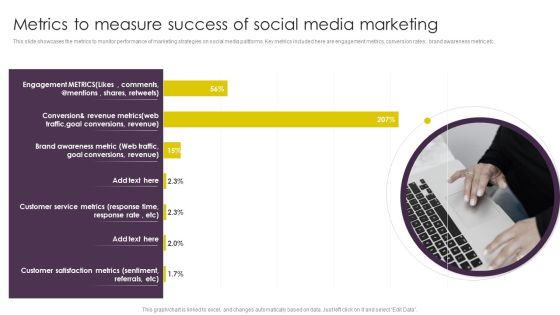
Implementing Digital Marketing Metrics To Measure Success Of Social Media Marketing Pictures PDF
This slide showcases the metrics to monitor performance of marketing strategies on social media paltforms. Key metrics included here are engagement metrics, conversion rates, brand awareness metric etc. Present like a pro with Implementing Digital Marketing Metrics To Measure Success Of Social Media Marketing Pictures PDF Create beautiful presentations together with your team, using our easy-to-use presentation slides. Share your ideas in real-time and make changes on the fly by downloading our templates. So whether youre in the office, on the go, or in a remote location, you can stay in sync with your team and present your ideas with confidence. With Slidegeeks presentation got a whole lot easier. Grab these presentations today.
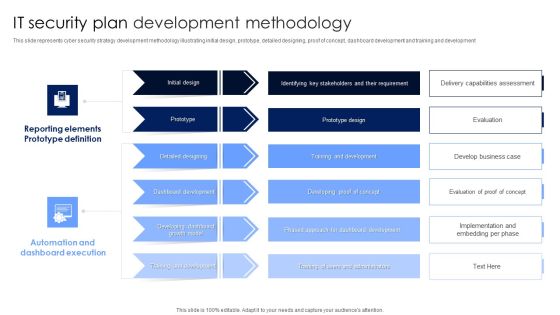
IT Security Plan Development Methodology Microsoft PDF
This slide represents cyber security strategy development methodology illustrating initial design, prototype, detailed designing, proof of concept, dashboard development and training and development. Pitch your topic with ease and precision using this IT Security Plan Development Methodology Microsoft PDF. This layout presents information on Automation And Dashboard Execution, Reporting Elements Prototype Definition, Dashboard Development. It is also available for immediate download and adjustment. So, changes can be made in the color, design, graphics or any other component to create a unique layout.

Risk Assessment Control Measures Form With Severity Inspiration PDF
This slide focuses on providing adequate guarding and other means of protection between the operators and the equipment with appropriate control measures. Hazards include blunt chain, unadjusted chain, kickback, and eye injuries. Pitch your topic with ease and precision using this Risk Assessment Control Measures Form With Severity Inspiration PDF. This layout presents information on Risk Control Measures, Additional Control Measures, Equipment. It is also available for immediate download and adjustment. So, changes can be made in the color, design, graphics or any other component to create a unique layout.
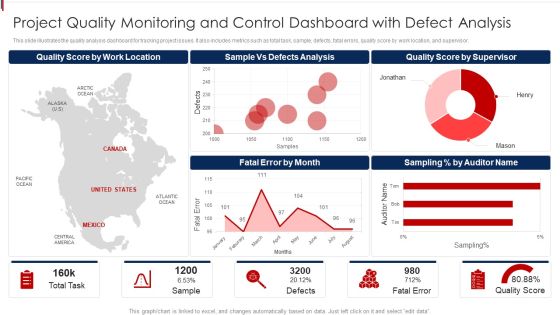
Project Quality Monitoring And Control Dashboard With Defect Analysis Demonstration PDF
This slide illustrates the quality analysis dashboard for tracking project issues. It also includes metrics such as total task, sample, defects, fatal errors, quality score by work location, and supervisor. Pitch your topic with ease and precision using this Project Quality Monitoring And Control Dashboard With Defect Analysis Demonstration PDF. This layout presents information on Location, Analysis, Supervisor. It is also available for immediate download and adjustment. So, changes can be made in the color, design, graphics or any other component to create a unique layout.

Plant Safety Measures Dashboard With Incidents Work Accidents And Near Misses Template PDF
This slide showcases dashboard to monitor plant safety measures performance indicators. Key metrics covered are incident and injury type, root cause, location, contributing factor, employees at risk and investigation. Pitch your topic with ease and precision using this Plant Safety Measures Dashboard With Incidents Work Accidents And Near Misses Template PDF. This layout presents information on Plant Safety Measures Dashboard, Incidents Work Accidents. It is also available for immediate download and adjustment. So, changes can be made in the color, design, graphics or any other component to create a unique layout.

Participants Event Satisfaction Study Form Professional PDF
This slide covers form for feedback collection on participants overall event satisfaction. It includes metrics such as venue location, event content, registration fees, speakers, organization, etc. Pitch your topic with ease and precision using this Participants Event Satisfaction Study Form Professional PDF. This layout presents information on Organization, Venue Location, Event Content. It is also available for immediate download and adjustment. So, changes can be made in the color, design, graphics or any other component to create a unique layout.

Ten Steps Layout To Implementing The Best Solution Ppt PowerPoint Presentation Summary Format
Presenting this set of slides with name ten steps layout to implementing the best solution ppt powerpoint presentation summary format. This is a ten stage process. The stages in this process are define problem, overcoming obstacles, measuring results, changing mindset, measuring progress, meeting the deadline, implementing the best solution. This is a completely editable PowerPoint presentation and is available for immediate download. Download now and impress your audience.

Key Extensive Diversity Metrics To Assess Training Needs For HR Professionals Mockup PDF
This slide showcases the diversity metrics to track training needs for recruitment team. Key metrics included here are number of females hired, people hired from different backgrounds, recruitment of employees with disabilities etc. Pitch your topic with ease and precision using this Key Extensive Diversity Metrics To Assess Training Needs For HR Professionals Mockup PDF. This layout presents information on Business Partners, Organization, Company Target. It is also available for immediate download and adjustment. So, changes can be made in the color, design, graphics or any other component to create a unique layout.

Quarterly Business Roadmap Matrix With Key Tasks Introduction PDF
The following slide showcases various activities performed in different department of an organization. The departments included are operations, product, sales, marketing and finance. Pitch your topic with ease and precision using this Quarterly Business Roadmap Matrix With Key Tasks Introduction PDF. This layout presents information on Sale, Product, Marketing. It is also available for immediate download and adjustment. So, changes can be made in the color, design, graphics or any other component to create a unique layout.

Comparative Matrix To Select Suitable Vendor Microsoft PDF
This slide shows comparison matrix which can be used by organizations to compare vendors. It includes various metrics demand handling capabilities, customer services, price per unit, data security level, etc. Pitch your topic with ease and precision using this Comparative Matrix To Select Suitable Vendor Microsoft PDF. This layout presents information on Select Suitable, Vendor. It is also available for immediate download and adjustment. So, changes can be made in the color, design, graphics or any other component to create a unique layout.

Business Project Workstream Scope Roadmap Demonstration PDF
The following slide showcases project workstream roadmap of an organization that includes targets, deliverables, alignment and research for various quarters. It further includes safety integration, determining metrics and internal review. Pitch your topic with ease and precision using this Business Project Workstream Scope Roadmap Demonstration PDF. This layout presents information on Research, Alignment, Deliverables, Targets. It is also available for immediate download and adjustment. So, changes can be made in the color, design, graphics or any other component to create a unique layout.

Personnel Engagement Measurement Effective Approaches With Statistics Structure PDF
This slide depicts different approaches to measure engagement in employees. It includes engagement surveys, exit interviews, one on ones with managers, performance ratings, first year employees retention rate, retention rate for experience employees, customer satisfaction rates and employee productivity. Pitch your topic with ease and precision using this Personnel Engagement Measurement Effective Approaches With Statistics Structure PDF. This layout presents information on Employees Increases, Person Discussion, Employee Morale. It is also available for immediate download and adjustment. So, changes can be made in the color, design, graphics or any other component to create a unique layout.

Company Project Testing Business Requirement Status Diagrams PDF
This slide shows testing requirements that determine whether project feasibility. It include categories such as alignment, compliance, measurability etc. with requirements, priority and status. Pitch your topic with ease and precision using this Company Project Testing Business Requirement Status Diagrams PDF. This layout presents information on Categories, Testing Requirement, Priority . It is also available for immediate download and adjustment. So, changes can be made in the color, design, graphics or any other component to create a unique layout.

Marketing Strategy For Shipping Business Key Performance Indicator Dashboard Graphics PDF
The following slide depicts the key areas in Marketing Strategy for Shipping Business to monitor and optimize supply chain processes. It includes elements such as fleet and shipment status, country wise revenue, location wise delivery, average shipment time etc.Pitch your topic with ease and precision using this Marketing Strategy For Shipping Business Key Performance Indicator Dashboard Graphics PDF. This layout presents information on Shipment Status, Average Shipment, Wise Revenue. It is also available for immediate download and adjustment. So, changes can be made in the color, design, graphics or any other component to create a unique layout.

Agile Product Development Tracking User Stories Across Agile Project Development Icons PDF
This slide provides information regarding dashboard for tracking user stories across agile project development including work items, etc. If your project calls for a presentation, then Slidegeeks is your go-to partner because we have professionally designed, easy-to-edit templates that are perfect for any presentation. After downloading, you can easily edit Agile Product Development Tracking User Stories Across Agile Project Development Icons PDF and make the changes accordingly. You can rearrange slides or fill them with different images. Check out all the handy templates.

Building Construction Project Progress Report Map Icon Professional PDF
This slide defines the dashboard for analyzing the status of a building constructing project. It includes information related to progress, cost breakdown, budget and work schedule. Pitch your topic with ease and precision using this Building Construction Project Progress Report Map Icon Professional PDF. This layout presents information on Design Build, Project Start, Project End. It is also available for immediate download and adjustment. So, changes can be made in the color, design, graphics or any other component to create a unique layout.

Kaizen Process Report With Improvement Metrics Ppt PowerPoint Presentation File Icons PDF
This slide focuses on the kaizen event report which covers process owner, key performance indicators, summary, problem description, improvement metrics, goals, daily milestones, team members and other considerations, etc. Pitch your topic with ease and precision using this Kaizen Process Report With Improvement Metrics Ppt PowerPoint Presentation File Icons PDF. This layout presents information on Key Performance Indoctrinator, Improvement Goal, Improvement Metric. It is also available for immediate download and adjustment. So, changes can be made in the color, design, graphics or any other component to create a unique layout.
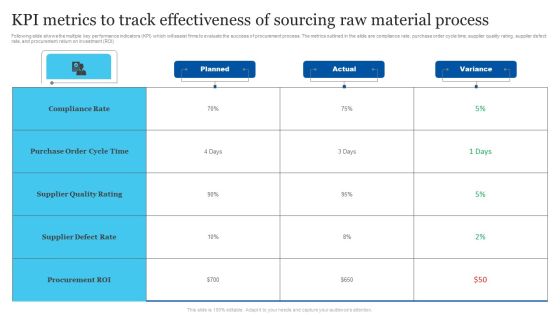
KPI Metrics To Track Effectiveness Of Sourcing Raw Material Process Portrait PDF
Following slide shows the multiple key performance indicators KPI which will assist firms to evaluate the success of procurement process. The metrics outlined in the slide are compliance rate, purchase order cycle time, supplier quality rating, supplier defect rate, and procurement return on investment ROI. Pitch your topic with ease and precision using this KPI Metrics To Track Effectiveness Of Sourcing Raw Material Process Portrait PDF. This layout presents information on Purchase Order Cycle Time, Supplier Defect Rate, Procurement Roi. It is also available for immediate download and adjustment. So, changes can be made in the color, design, graphics or any other component to create a unique layout.

Brand Equity Strength Analysis Structure To Measure Performance Sample PDF
The following slide showcases brand equity framework to assist in the creation and administration of brand assets. It includes inputs, outputs, functional and emotional drivers, marketing investment and performance scorecard. Pitch your topic with ease and precision using this Brand Equity Strength Analysis Structure To Measure Performance Sample PDF. This layout presents information on Product Development, Innovation, Brand Loyalty. It is also available for immediate download and adjustment. So, changes can be made in the color, design, graphics or any other component to create a unique layout.

Service Resource Planning Table Ppt Design Templates
This is a service resource planning table ppt design templates. This is a six stage process. The stages in this process are demand and capacity planning, engagement management, service delivery management, erp and corporate dashboards, new business, repeat business, strategic business, scope change, financial management.
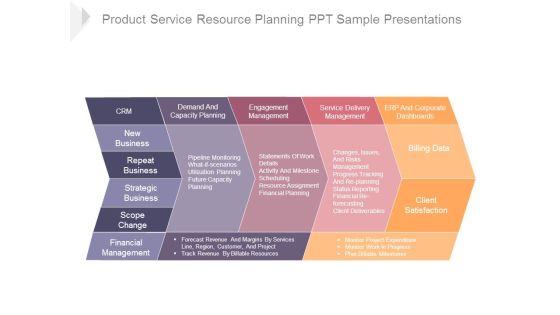
Product Service Resource Planning Ppt Sample Presentations
This is a product service resource planning ppt sample presentations. This is a five stage process. The stages in this process are scope change, strategic business, repeat business, new business, crm, demand and capacity planning, engagement management, service delivery management, erp and corporate dashboards, billing data, client satisfaction, financial management.

Customer Service Metrics Dashboard With Average First Response Time Background PDF
This slide showcases Dashboard for Customer Service metrics that can help organization to easily identify the key pain points of your customers, areas which need additional resources and support agents that can benefit from additional training. It also showcases performance of top and bottom 5 call support agents. Pitch your topic with ease and precision using this Customer Service Metrics Dashboard With Average First Response Time Background PDF. This layout presents information on Average, Abandon Rate, Contact Resolution. It is also available for immediate download and adjustment. So, changes can be made in the color, design, graphics or any other component to create a unique layout.
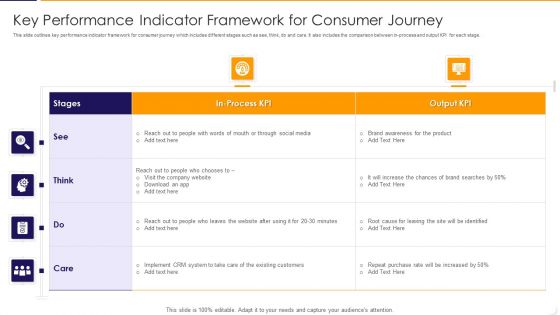
Key Performance Indicator Framework For Consumer Journey Ppt PowerPoint Presentation Gallery Good PDF
This slide outlines key performance indicator framework for consumer journey which includes different stages such as see, think, do and care. It also includes the comparison between in process and output KPI for each stage. Pitch your topic with ease and precision using this key performance indicator framework for consumer journey ppt powerpoint presentation gallery good pdf This layout presents information on social media, system, implement. It is also available for immediate download and adjustment. So, changes can be made in the color, design, graphics or any other component to create a unique layout.
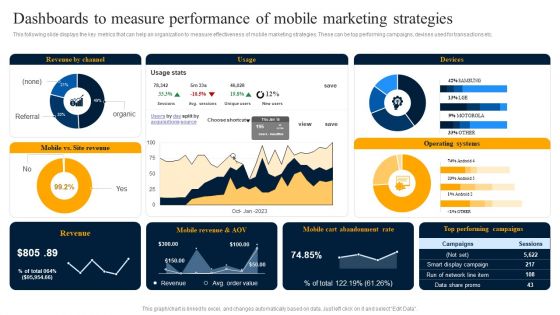
Dashboards To Measure Performance Of Mobile Marketing Strategies Rules PDF
This following slide displays the key metrics that can help an organization to measure effectiveness of mobile marketing strategies. These can be top performing campaigns, devises used for transactions etc. If your project calls for a presentation, then Slidegeeks is your go to partner because we have professionally designed, easy to edit templates that are perfect for any presentation. After downloading, you can easily edit Dashboards To Measure Performance Of Mobile Marketing Strategies Rules PDF and make the changes accordingly. You can rearrange slides or fill them with different images. Check out all the handy templates.

 Home
Home