Investment Portfolio

Sustainable Product Marketing Driving Factors Clipart PDF
This slide provides the statistical data for consumers expectation of a brand for sustainable development which helps business to create a innovative product to improve customer loyalty and increase profits. Major elements are environment friendly, is recyclable etc. Showcasing this set of slides titled Sustainable Product Marketing Driving Factors Clipart PDF. The topics addressed in these templates are Respondents, Environment Friendly, Awareness For Opting Sustainable. All the content presented in this PPT design is completely editable. Download it and make adjustments in color, background, font etc. as per your unique business setting.

5 Step Guide For Transitioning To Blue Ocean Strategy As Is To Be Leadership Canvas Senior Management Brochure PDF
This template cover As-Is-To-Be Leadership framework. This template will release, coach, and empower middle management, reducing their control and fear of acting alone. Frontline managers will devote less effort to pleasing the boss and more time to serving consumers. If your project calls for a presentation, then Slidegeeks is your go-to partner because we have professionally designed, easy-to-edit templates that are perfect for any presentation. After downloading, you can easily edit 5 Step Guide For Transitioning To Blue Ocean Strategy As Is To Be Leadership Canvas Senior Management Brochure PDF and make the changes accordingly. You can rearrange slides or fill them with different images. Check out all the handy templates
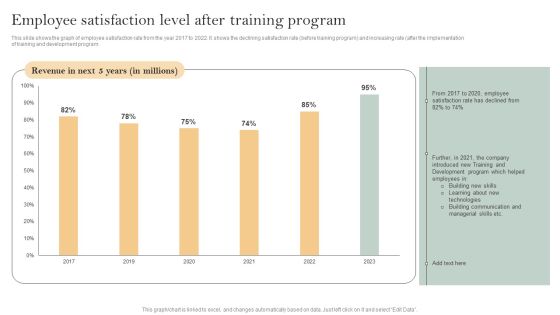
Skill Enhancement Plan Employee Satisfaction Level After Training Program Guidelines PDF
This slide shows the graph of employee satisfaction rate from the year 2017 to 2022. It shows the declining satisfaction rate before training program and increasing rate after the implementation of training and development program. If your project calls for a presentation, then Slidegeeks is your go-to partner because we have professionally designed, easy-to-edit templates that are perfect for any presentation. After downloading, you can easily edit Skill Enhancement Plan Employee Satisfaction Level After Training Program Guidelines PDF and make the changes accordingly. You can rearrange slides or fill them with different images. Check out all the handy templates
Optimizing Consumer Lead Nurturing Procedure Lead Generation Dashboard For Tracking Introduction PDF
This slide covers the KPI dashboard for tracking lead conversion rates. It includes metrics such as visitors, average session rate, per visit, bounce rate, page views, etc. Create an editable Optimizing Consumer Lead Nurturing Procedure Lead Generation Dashboard For Tracking Introduction PDF that communicates your idea and engages your audience. Whether youre presenting a business or an educational presentation, pre designed presentation templates help save time. Optimizing Consumer Lead Nurturing Procedure Lead Generation Dashboard For Tracking Introduction PDF is highly customizable and very easy to edit, covering many different styles from creative to business presentations. Slidegeeks has creative team members who have crafted amazing templates. So, go and get them without any delay.

Dashboard For Enterprise Recruitment With Time To Hire And Fill Icons PDF
In this slide corporate staffing dashboard highlights important recruitment KPIs to review application trends and candidate response to job vacancy. It further includes details about application, review, assessment, interview, etc. Showcasing this set of slides titled Dashboard For Enterprise Recruitment With Time To Hire And Fill Icons PDF. The topics addressed in these templates are Key Metrics, Experienced Ratio, Applicants. All the content presented in this PPT design is completely editable. Download it and make adjustments in color, background, font etc. as per your unique business setting.

Impact 1 Increased Customer Churn Rate And Support Tickets Sample PDF
This slide showcases the negative impact of customer onboarding challenges on the business. The challenges covered are increased user churn rate and number of onboarding support tickets. Create an editable Impact 1 Increased Customer Churn Rate And Support Tickets Sample PDF that communicates your idea and engages your audience. Whether youre presenting a business or an educational presentation, pre designed presentation templates help save time. Impact 1 Increased Customer Churn Rate And Support Tickets Sample PDF is highly customizable and very easy to edit, covering many different styles from creative to business presentations. Slidegeeks has creative team members who have crafted amazing templates. So, go and get them without any delay.
Overall Brand Performance Tracking Dashboard Microsoft PDF
This slide provides information regarding brand performance tracking dashboard capturing KPIs such as brand metric, brand commitment, advertising metrics, and purchase metrics. Slidegeeks is here to make your presentations a breeze with Overall Brand Performance Tracking Dashboard Microsoft PDF With our easy to use and customizable templates, you can focus on delivering your ideas rather than worrying about formatting. With a variety of designs to choose from, you are sure to find one that suits your needs. And with animations and unique photos, illustrations, and fonts, you can make your presentation pop. So whether you are giving a sales pitch or presenting to the board, make sure to check out Slidegeeks first.
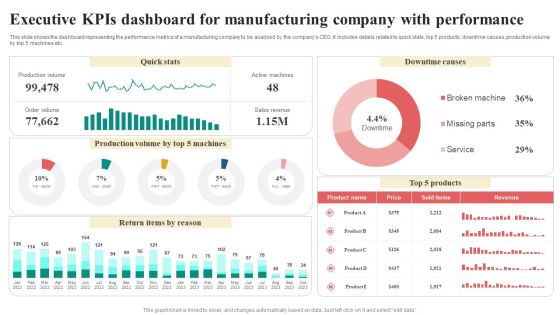
Executive Kpis Dashboard For Manufacturing Company With Performance Infographics PDF
This slide shows the dashboard representing the performance metrics of a manufacturing company to be analyzed by the companys CEO. It includes details related to quick stats, top 5 products, downtime causes, production volume by top 5 machines etc. Showcasing this set of slides titled Executive Kpis Dashboard For Manufacturing Company With Performance Infographics PDF. The topics addressed in these templates are Return Items By Reason, Quick Stats, Downtime Causes, Revenue. All the content presented in this PPT design is completely editable. Download it and make adjustments in color, background, font etc. as per your unique business setting.
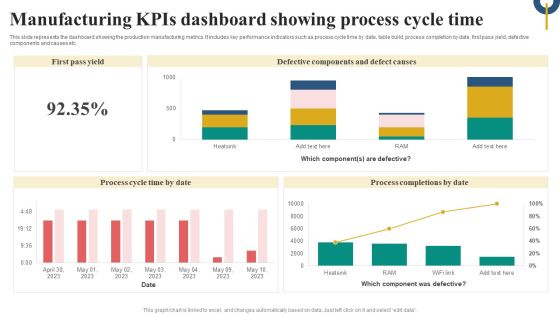
Manufacturing Kpis Dashboard Showing Process Cycle Time Microsoft PDF
This slide represents the dashboard showing the production manufacturing metrics. It includes key performance indicators such as process cycle time by date, table build, process completion by date, first pass yield, defective components and causes etc. Pitch your topic with ease and precision using this Manufacturing Kpis Dashboard Showing Process Cycle Time Microsoft PDF. This layout presents information on Defective Components Defect Causes, Process Cycle, Time By Date, Process Completions By Date. It is also available for immediate download and adjustment. So, changes can be made in the color, design, graphics or any other component to create a unique layout.
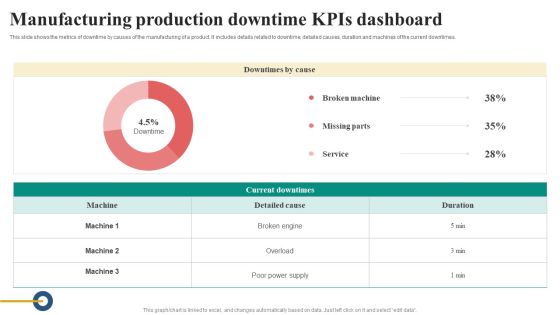
Manufacturing Production Downtime Kpis Dashboard Diagrams PDF
This slide shows the metrics of downtime by causes of the manufacturing of a product. It includes details related to downtime, detailed causes, duration and machines of the current downtimes. Pitch your topic with ease and precision using this Manufacturing Production Downtime Kpis Dashboard Diagrams PDF. This layout presents information on Details Related To Downtime, Detailed Causes, Duration And Machines, Current Downtimes. It is also available for immediate download and adjustment. So, changes can be made in the color, design, graphics or any other component to create a unique layout.

Safety Kpis Dashboard For Manufacturing Company Slides PDF
This slide shows the metrics dashboard representing the safety metrics for the manufacturing company. It includes details related to incidents per employee, total number of incidents in the company, incidents accumulated total etc.. Pitch your topic with ease and precision using this Safety Kpis Dashboard For Manufacturing Company Slides PDF. This layout presents information on Incidents Per Employee, Safety Incident Reported, Incidence Avoidance Quiz Score. It is also available for immediate download and adjustment. So, changes can be made in the color, design, graphics or any other component to create a unique layout.

Business Receipt Management System Dashboard Portrait PDF
The slide displays a dashboard for invoice management system for preventing delays and errors in receiving and paying. It shows multiple elements such as activity, glance, estimates of past 6 months, invoice summary, income and expenses, account receivables and account payables. Showcasing this set of slides titled Business Receipt Management System Dashboard Portrait PDF. The topics addressed in these templates are Income expenses, Invoice summary, Estimate. All the content presented in this PPT design is completely editable. Download it and make adjustments in color, background, font etc. as per your unique business setting.
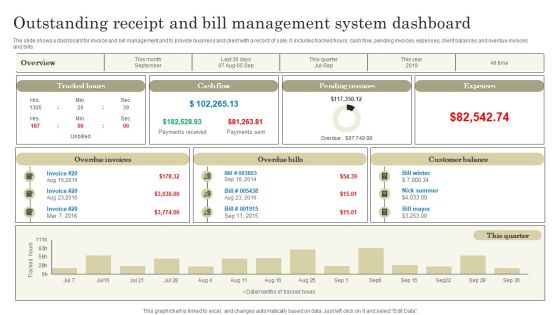
Outstanding Receipt And Bill Management System Dashboard Pictures PDF
The slide shows a dashboard for invoice and bill management and to provide business and client with a record of sale. It includes tracked hours, cash flow, pending invoices, expenses, client balances and overdue invoices and bills. Showcasing this set of slides titled Outstanding Receipt And Bill Management System Dashboard Pictures PDF. The topics addressed in these templates are Tracked hours, Cash flow, Pending invoices, Expenses. All the content presented in this PPT design is completely editable. Download it and make adjustments in color, background, font etc. as per your unique business setting.

Sales By Lead Source Performance Indicator Ppt Pictures Graphics Template PDF
Explore a selection of the finest Sales By Lead Source Performance Indicator Ppt Pictures Graphics Template PDF here. With a plethora of professionally designed and pre made slide templates, you can quickly and easily find the right one for your upcoming presentation. You can use our Sales By Lead Source Performance Indicator Ppt Pictures Graphics Template PDF to effectively convey your message to a wider audience. Slidegeeks has done a lot of research before preparing these presentation templates. The content can be personalized and the slides are highly editable. Grab templates today from Slidegeeks.
Sales By Lead Source Performance Indicator Ppt Icon Images PDF
Explore a selection of the finest Sales By Lead Source Performance Indicator Ppt Icon Images PDF here. With a plethora of professionally designed and pre made slide templates, you can quickly and easily find the right one for your upcoming presentation. You can use our Sales By Lead Source Performance Indicator Ppt Icon Images PDF to effectively convey your message to a wider audience. Slidegeeks has done a lot of research before preparing these presentation templates. The content can be personalized and the slides are highly editable. Grab templates today from Slidegeeks.
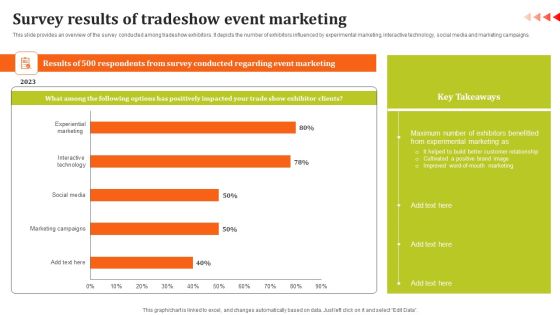
Survey Results Of Tradeshow Event Marketing Diagrams PDF
This slide provides an overview of the survey conducted among tradeshow exhibitors. It depicts the number of exhibitors influenced by experimental marketing, interactive technology, social media and marketing campaigns. Get a simple yet stunning designed Survey Results Of Tradeshow Event Marketing Diagrams PDF. It is the best one to establish the tone in your meetings. It is an excellent way to make your presentations highly effective. So, download this PPT today from Slidegeeks and see the positive impacts. Our easy to edit Survey Results Of Tradeshow Event Marketing Diagrams PDF can be your go to option for all upcoming conferences and meetings. So, what are you waiting for Grab this template today.
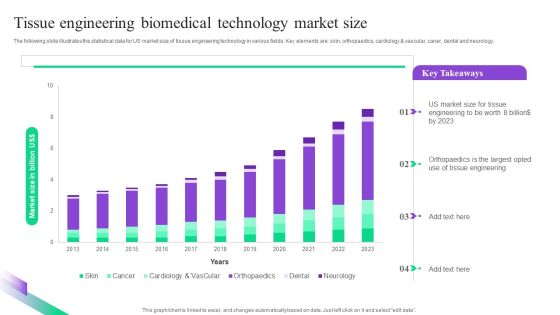
Tissue Engineering Biomedical Technology Market Size Summary PDF
The following slide illustrates the statistical data for US market size of tissue engineering technology in various fields. Key elements are skin, orthopaedics, cardiology and vascular, caner, dental and neurology. Pitch your topic with ease and precision using this Tissue Engineering Biomedical Technology Market Size Summary PDF. This layout presents information on Tissue, Engineering, Market Size. It is also available for immediate download and adjustment. So, changes can be made in the color, design, graphics or any other component to create a unique layout.

Call Center Kpis Agent Performance Dashboard Clipart PDF
This slide covers contact center agent performance metrics KPI dashboard. It involves metrics such as number of calls, average response time, average hold time, daily average transfer rate and agents with most hold time and transfer rate. Showcasing this set of slides titled Call Center Kpis Agent Performance Dashboard Clipart PDF. The topics addressed in these templates are Transfer Rate, Call Center, Hold Time. All the content presented in this PPT design is completely editable. Download it and make adjustments in color, background, font etc. as per your unique business setting.

Call Center Kpis Dashboard For Chat Management Graphics PDF
This slide covers contact center KPI dashboard for chat management. It involves details such as chats over time by site, location and language, total number of chats, average response time by employees. Showcasing this set of slides titled Call Center Kpis Dashboard For Chat Management Graphics PDF. The topics addressed in these templates are Management, Employees, Chats. All the content presented in this PPT design is completely editable. Download it and make adjustments in color, background, font etc. as per your unique business setting.

Call Center Kpis Dashboard With Data Management Infographics PDF
This slide covers contact center metrics KPI dashboard with call data details. It involves details such as total number of contacts handled, product sales, repeated calls and contact handles per day. Pitch your topic with ease and precision using this Call Center Kpis Dashboard With Data Management Infographics PDF. This layout presents information on Achieved, Contacts Handled, Repeated Calls. It is also available for immediate download and adjustment. So, changes can be made in the color, design, graphics or any other component to create a unique layout.

Call Center Performance KPI Dashboard Formats PDF
This slide covers contact center performance metrics KPI dashboard. It involves details such as number of total calls, average answer speed, abandon rate, data of agents performance and call abandon rate by departments. Showcasing this set of slides titled Call Center Performance KPI Dashboard Formats PDF. The topics addressed in these templates are Department, Dashboard, Agreement Limits. All the content presented in this PPT design is completely editable. Download it and make adjustments in color, background, font etc. as per your unique business setting.
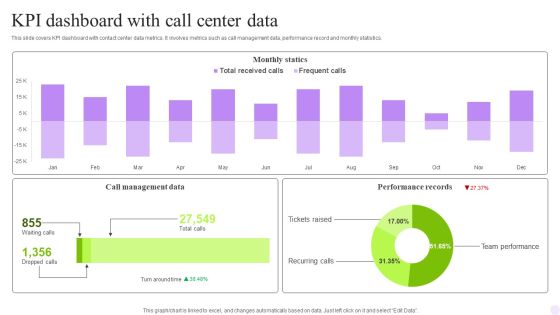
KPI Dashboard With Call Center Data Rules PDF
This slide covers contact center performance metrics KPI dashboard. It involves details such as number of total calls, average answer speed, abandon rate, data of agents performance and call abandon rate by departments. Pitch your topic with ease and precision using this KPI Dashboard With Call Center Data Rules PDF. This layout presents information on Monthly Statics, Management Data, Performance Records. It is also available for immediate download and adjustment. So, changes can be made in the color, design, graphics or any other component to create a unique layout.

Buzz Marketing Strategies To Expand Campaign Reach Analyzing Impact Of Viral Marketing Strategies Template PDF
The following slide shows assessing affect of viral marketing techniques. It provides details about TikTok, Pinterest, Reddit, Facebook, Twitter, Instagram, virality coefficient, follower growth, user generated content, benefits, etc. Find a pre designed and impeccable Buzz Marketing Strategies To Expand Campaign Reach Analyzing Impact Of Viral Marketing Strategies Template PDF. The templates can ace your presentation without additional effort. You can download these easy to edit presentation templates to make your presentation stand out from others. So, what are you waiting for Download the template from Slidegeeks today and give a unique touch to your presentation.
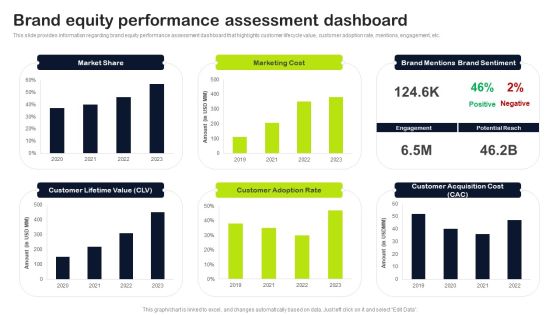
Key Elements Of Strategic Brand Administration Brand Equity Performance Assessment Dashboard Elements PDF
This slide provides information regarding brand equity performance assessment dashboard that highlights customer lifecycle value, customer adoption rate, mentions, engagement, etc. Get a simple yet stunning designed Key Elements Of Strategic Brand Administration Brand Equity Performance Assessment Dashboard Elements PDF. It is the best one to establish the tone in your meetings. It is an excellent way to make your presentations highly effective. So, download this PPT today from Slidegeeks and see the positive impacts. Our easy-to-edit Key Elements Of Strategic Brand Administration Brand Equity Performance Assessment Dashboard Elements PDF can be your go-to option for all upcoming conferences and meetings. So, what are you waiting for Grab this template today.

Application Acquisition Campaign Performance Analysis Dashboard Information PDF
Following slide exhibits dashboard to track performance of marketing campaigns implemented by company to increase application web traffic. It include indicators such as impressions, acquisitions, clicks, ROI etc. Find a pre designed and impeccable Application Acquisition Campaign Performance Analysis Dashboard Information PDF. The templates can ace your presentation without additional effort. You can download these easy to edit presentation templates to make your presentation stand out from others. So, what are you waiting for Download the template from Slidegeeks today and give a unique touch to your presentation.

Chief Information Officers Guide On Technology Plan IT Performance Dashboard To Track Summary PDF
This slide provides information regarding the dashboard to monitor overall IT performance. The dashboard tracks occupancy rate, net promoter score, avg. first contact resolution rate, etc. Find a pre designed and impeccable Chief Information Officers Guide On Technology Plan IT Performance Dashboard To Track Summary PDF. The templates can ace your presentation without additional effort. You can download these easy to edit presentation templates to make your presentation stand out from others. So, what are you waiting for Download the template from Slidegeeks today and give a unique touch to your presentation.

Customer Service E Mail Response Time Utilization Analysis Portrait PDF
The following slide highlights the time that customer expects e-mail response to enhance loyal customer base. It includes elements of response time immediate, less than one hr., within a day, two day etc. Pitch your topic with ease and precision using this Customer Service E Mail Response Time Utilization Analysis Portrait PDF. This layout presents information on Customer Service, E Mail Response, Time Utilization Analysis. It is also available for immediate download and adjustment. So, changes can be made in the color, design, graphics or any other component to create a unique layout.
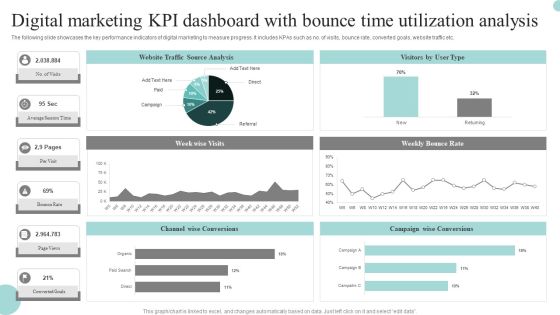
Digital Marketing Kpi Dashboard With Bounce Time Utilization Analysis Graphics PDF
The following slide showcases the key performance indicators of digital marketing to measure progress. It includes KPAs such as no. of visits, bounce rate, converted goals, website traffic etc. Pitch your topic with ease and precision using this Digital Marketing Kpi Dashboard With Bounce Time Utilization Analysis Graphics PDF. This layout presents information on Digital Marketing, KPI Dashboard, Bounce Time Utilization Analysis. It is also available for immediate download and adjustment. So, changes can be made in the color, design, graphics or any other component to create a unique layout.
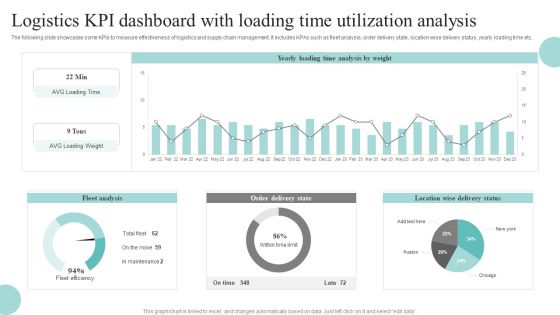
Logistics KPI Dashboard With Loading Time Utilization Analysis Download PDF
The following slide showcases some KPIs to measure effectiveness of logistics and supply chain management. It includes KPAs such as fleet analysis, order delivery state, location wise delivery status, yearly loading time etc. Pitch your topic with ease and precision using this Logistics KPI Dashboard With Loading Time Utilization Analysis Download PDF. This layout presents information on Fleet Analysis, Order Delivery State, Location Wise Delivery Status. It is also available for immediate download and adjustment. So, changes can be made in the color, design, graphics or any other component to create a unique layout.

Website Medical Checkup And Audit Dashboard Background PDF
The slide showcases a dashboard for monitoring website performance and identifying health score of website. It includes key elements like ranking, Google analytics, site audit, Google ranking, backlinks, search console, etc. Showcasing this set of slides titled Website Medical Checkup And Audit Dashboard Background PDF. The topics addressed in these templates are Rankings, Google Analytics, Site Audit. All the content presented in this PPT design is completely editable. Download it and make adjustments in color, background, font etc. as per your unique business setting.

Website Medical Checkup Metrics Dashboard Introduction PDF
The following slide showcases a dashboard to identify key issues and boost website performance. It includes key elements like crawled URLs, health score, issues, found links, URL by errors and top issues. Showcasing this set of slides titled Website Medical Checkup Metrics Dashboard Introduction PDF. The topics addressed in these templates are Website Medical Checkup, Metrics Dashboard. All the content presented in this PPT design is completely editable. Download it and make adjustments in color, background, font etc. as per your unique business setting.
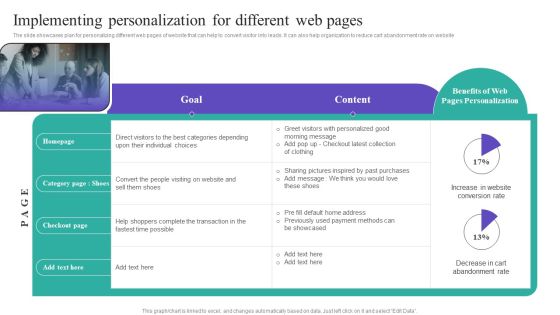
Implementing Personalization For Different Web Pages Sample PDF
The slide showcases plan for personalizing different web pages of website that can help to convert visitor into leads. It can also help organization to reduce cart abandonment rate on website Find a pre-designed and impeccable Implementing Personalization For Different Web Pages Sample PDF. The templates can ace your presentation without additional effort. You can download these easy-to-edit presentation templates to make your presentation stand out from others. So, what are you waiting for Download the template from Slidegeeks today and give a unique touch to your presentation.

Influencer Marketing Growth Statistics For Advertising Campaign Themes PDF
The following slide exhibits influencer marketing strategy for building partnerships, providing value to audience. The main components are- influencer marketing size, social media platforms, influencer marketing adoption rate etc. Pitch your topic with ease and precision using this Influencer Marketing Growth Statistics For Advertising Campaign Themes PDF. This layout presents information on Marketing Giants, Campaign, Influencer. It is also available for immediate download and adjustment. So, changes can be made in the color, design, graphics or any other component to create a unique layout.
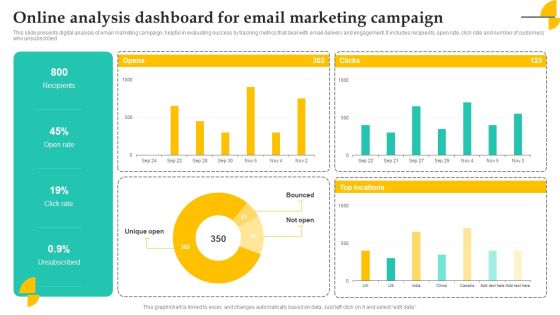
Online Analysis Dashboard For Email Marketing Campaign Elements PDF
This slide presents digital analysis of email marketing campaign, helpful in evaluating success by tracking metrics that deal with email delivery and engagement. It includes recipients, open rate, click rate and number of customers who unsubscribed Showcasing this set of slides titled Online Analysis Dashboard For Email Marketing Campaign Elements PDF. The topics addressed in these templates are Recipients, Open Rate, Campaign. All the content presented in this PPT design is completely editable. Download it and make adjustments in color, background, font etc. as per your unique business setting.

Social Media Platform Analysis For Online Campaign Summary PDF
This slide presents digital campaign analysis through evaluation of different social media platforms, helpful in providing insights on effectiveness of each channel. It includes social media status, key metrics and engagement provided by different channels Pitch your topic with ease and precision using this Social Media Platform Analysis For Online Campaign Summary PDF. This layout presents information on Media Status, Campaign, Engagement. It is also available for immediate download and adjustment. So, changes can be made in the color, design, graphics or any other component to create a unique layout.

Coffeehouse Promotion Techniques To Boost Revenue Dashboard To Track Sales Expenses Restaurant Clipart PDF
This slide showcases dashboard that can help restaurant to keep track of sales and expenses. Its key elements are total sales, average transactions, non labor margin, expenses by category etc. If your project calls for a presentation, then Slidegeeks is your go-to partner because we have professionally designed, easy-to-edit templates that are perfect for any presentation. After downloading, you can easily edit Coffeehouse Promotion Techniques To Boost Revenue Dashboard To Track Sales Expenses Restaurant Clipart PDF and make the changes accordingly. You can rearrange slides or fill them with different images. Check out all the handy templates

Campaign Performance Dashboard For Brand Equity Tactics Measurement Slides PDF
This slide presents a dashboard for measuring success of a social media campaign for growing and maintaining brand equity and provide visual outcome of social media campaign. The key performance indicators covered are reach of campaign on the basis of region, age, sentiment analysis etc. Showcasing this set of slides titled Campaign Performance Dashboard For Brand Equity Tactics Measurement Slides PDF. The topics addressed in these templates are Campaign Performance Dashboard For Brand Equity Tactics Measurement Slides PDF. All the content presented in this PPT design is completely editable. Download it and make adjustments in color, background, font etc. as per your unique business setting.

Formulating Robust Branding Strategies To Effectively Combat Conducting Survey To Select The Marketing Clipart PDF
The following slide outlines in-depth survey highlighting the results of various marketing channels preferred by our customers to consume relevant information associated with the brand. The marketing channels are website, emails, social media, video advertising, guerilla marketing and trade shows. Find a pre designed and impeccable Formulating Robust Branding Strategies To Effectively Combat Conducting Survey To Select The Marketing Clipart PDF. The templates can ace your presentation without additional effort. You can download these easy to edit presentation templates to make your presentation stand out from others. So, what are you waiting for Download the template from Slidegeeks today and give a unique touch to your presentation.

Dashboard To Measure Robotic Process Automation Bots Performance Structure PDF
This slide presents a dashboard to measure RPA bots performance in an organization. It includes utilization hours, bot types, average daily utilization, percentage of errors that occurred by bots, and occupied bots by business operations. If your project calls for a presentation, then Slidegeeks is your go-to partner because we have professionally designed, easy-to-edit templates that are perfect for any presentation. After downloading, you can easily edit Dashboard To Measure Robotic Process Automation Bots Performance Structure PDF and make the changes accordingly. You can rearrange slides or fill them with different images. Check out all the handy templates

Strategic Approaches To Efficient Candidate Selection Impact Of Structured Onboarding Company Structure PDF
Following slide represents impact of structured and effective onboarding experience that helps to increase productivity. It includes elements such as completion of activities, increase in retention rate etc. If your project calls for a presentation, then Slidegeeks is your go-to partner because we have professionally designed, easy-to-edit templates that are perfect for any presentation. After downloading, you can easily edit Strategic Approaches To Efficient Candidate Selection Impact Of Structured Onboarding Company Structure PDF and make the changes accordingly. You can rearrange slides or fill them with different images. Check out all the handy templates

Accounting Software Product Promotion Strategy Using Statistics And Recent Trends Sample PDF
Following slide depicts the using facts and current trends, create a marketing strategy for accounting software which assist in keeping the record of transaction in single click. Pitch your topic with ease and precision using this Accounting Software Product Promotion Strategy Using Statistics And Recent Trends Sample PDF. This layout presents information on Accounting Software Product, Promotion Strategy, Statistics And Recent Trends. It is also available for immediate download and adjustment. So, changes can be made in the color, design, graphics or any other component to create a unique layout.

KPI Dashboard For Software Product Promotion Strategy With Various Tools Portrait PDF
Following slide depicts the KPI dashboard with numerous tools for software product marketing plan In order to locate prospects and close sales, agile lead generation and marketing techniques are needed. Pitch your topic with ease and precision using this KPI Dashboard For Software Product Promotion Strategy With Various Tools Portrait PDF. This layout presents information on KPI Dashboard, Software Product Promotion, Strategy With Various Tools. It is also available for immediate download and adjustment. So, changes can be made in the color, design, graphics or any other component to create a unique layout.

IT Cyber Threat Prevention Technology Market Topics PDF
This slide provides the statistical data for IT security software user market to help business and organizations enhance process efficiency. Major security technology are authentication, IoT, Zero trust, Cloud, application security, etc. Pitch your topic with ease and precision using this IT Cyber Threat Prevention Technology Market Topics PDF. This layout presents information on Key Insights, Progressive Rate, Technology. It is also available for immediate download and adjustment. So, changes can be made in the color, design, graphics or any other component to create a unique layout.

Multiple Challenges Of Business Cyber Threat Prevention Sample PDF
The following slide represent the statistical data of various cyber safety challenges reported by business and organizations which helps to determine the most vulnerable one. Major areas are information security, business agility, automation, integration, etc. Showcasing this set of slides titled Multiple Challenges Of Business Cyber Threat Prevention Sample PDF. The topics addressed in these templates are Key Takeaways, Cyber Safety, Prevention. All the content presented in this PPT design is completely editable. Download it and make adjustments in color, background, font etc. as per your unique business setting.

Partner Relationship Management Impact On Business Revenue Summary PDF
Mentioned slide demonstrates statistics associated with business revenue earned by business and revenue influenced by partners. It includes key components such as yearly sales influenced by business, yearly sales influenced by partners. Create an editable Partner Relationship Management Impact On Business Revenue Summary PDF that communicates your idea and engages your audience. Whether you are presenting a business or an educational presentation, pre-designed presentation templates help save time. Partner Relationship Management Impact On Business Revenue Summary PDF is highly customizable and very easy to edit, covering many different styles from creative to business presentations. Slidegeeks has creative team members who have crafted amazing templates. So, go and get them without any delay.

Cashless Payment Strategies To Enhance Business Performance Cashless Payment Market Share By Industries Clipart PDF
Following slide demonstrates market share of cashless transactions by different industries which can be used by businesses to determine future prospects. It includes industries such as BFSI, healthcare, IT and telecom, media, retail, ecommerce, etc. Find a pre-designed and impeccable Cashless Payment Strategies To Enhance Business Performance Cashless Payment Market Share By Industries Clipart PDF. The templates can ace your presentation without additional effort. You can download these easy-to-edit presentation templates to make your presentation stand out from others. So, what are you waiting for Download the template from Slidegeeks today and give a unique touch to your presentation.

Key Business Account Management And Planning Techniques Driving Sales Growth Strategic Account Management Download PDF
Create an editable Key Business Account Management And Planning Techniques Driving Sales Growth Strategic Account Management Download PDF that communicates your idea and engages your audience. Whether you are presenting a business or an educational presentation, pre-designed presentation templates help save time. Key Business Account Management And Planning Techniques Driving Sales Growth Strategic Account Management Download PDF is highly customizable and very easy to edit, covering many different styles from creative to business presentations. Slidegeeks has creative team members who have crafted amazing templates. So, go and get them without any delay.

Comparison Analysis Of Profit Of Most Valuable Brands Based On Pictures PDF
This slide presents most valuable technologies in market based on profit comparison of multiple businesses, that provides insights on their operational efficiency and revenue generation. It includes Tech giants such as Apple, Google, Microsoft and Facebook. Showcasing this set of slides titled Comparison Analysis Of Profit Of Most Valuable Brands Based On Pictures PDF. The topics addressed in these templates are Apple Technology, Annual Profits Generated, Improved Cash Flow. All the content presented in this PPT design is completely editable. Download it and make adjustments in color, background, font etc. as per your unique business setting.

Retail Business Gross Comparison Analysis Of Profit Infographics PDF
This slide presents retail business comparison based on their respective gross profit margins, helpful in identifying most successful retailers and overall standing in market. It includes beverages, jewellery, cosmetics, fashion and shoes industries. Showcasing this set of slides titled Retail Business Gross Comparison Analysis Of Profit Infographics PDF. The topics addressed in these templates are Beverages Retail, Gross Profit Margin, Retail Segment. All the content presented in this PPT design is completely editable. Download it and make adjustments in color, background, font etc. as per your unique business setting.

Yearly Rofit Comparison Analysis Of Profit Slides PDF
This slide presents profits comparison of business on year to year basis, helpful in gaining insights on most profitable segment and growth rate. It includes net profits gained in different years and different segments of business operations. Showcasing this set of slides titled Yearly Rofit Comparison Analysis Of Profit Slides PDF. The topics addressed in these templates are Highest Net Profit, Telecom Business, Stable Cheaper. All the content presented in this PPT design is completely editable. Download it and make adjustments in color, background, font etc. as per your unique business setting.

Monthly Product Sales Analysis Dashboard Infographics PDF
This slide illustrates a dashboard for product sales review to measure to help business monitor and improve productivity, employee engagement and meet revenue targets. It covers product names with sales reps, lead conversion, response time and outbound calls. Showcasing this set of slides titled Monthly Product Sales Analysis Dashboard Infographics PDF. The topics addressed in these templates are Lead Conversion Rate, Outbound Calls, Sales Analysis Dashboard. All the content presented in this PPT design is completely editable. Download it and make adjustments in color, background, font etc. as per your unique business setting.

Dashboard For Risk Reporting Of Plan Effectiveness Download PDF
This slide depicts a dashboard for communication of hazard plan effectiveness to effectively manage the major incidents and take action accordingly. The key performing indicators are days since hazard incident, number of incidents in a year, risk assessments, etc. Showcasing this set of slides titled Dashboard For Risk Reporting Of Plan Effectiveness Download PDF. The topics addressed in these templates are Risk Assessments, Awaiting Submission, Awaiting Submission. All the content presented in this PPT design is completely editable. Download it and make adjustments in color, background, font etc. as per your unique business setting.
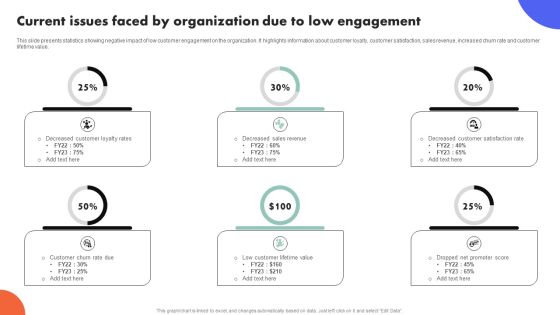
Improving Buyer Journey Through Strategic Customer Engagement Current Issues Faced By Organization Due Low Clipart PDF
This slide presents statistics showing negative impact of low customer engagement on the organization. It highlights information about customer loyalty, customer satisfaction, sales revenue, increased churn rate and customer lifetime value. If your project calls for a presentation, then Slidegeeks is your go-to partner because we have professionally designed, easy-to-edit templates that are perfect for any presentation. After downloading, you can easily edit Improving Buyer Journey Through Strategic Customer Engagement Current Issues Faced By Organization Due Low Clipart PDF and make the changes accordingly. You can rearrange slides or fill them with different images. Check out all the handy templates
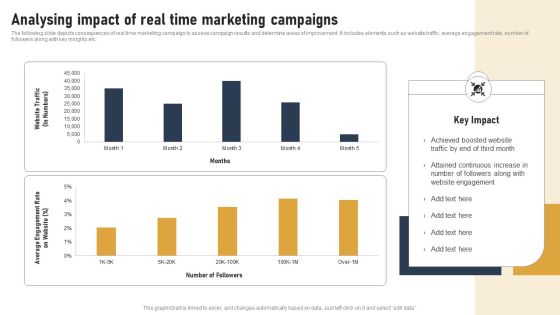
Incorporating Real Time Marketing For Improved Consumer Analysing Impact Of Real Time Marketing Introduction PDF
The following slide depicts consequences of real time marketing campaign to assess campaign results and determine areas of improvement. It includes elements such as website traffic, average engagement rate, number of followers along with key insights etc. If your project calls for a presentation, then Slidegeeks is your go to partner because we have professionally designed, easy to edit templates that are perfect for any presentation. After downloading, you can easily edit Incorporating Real Time Marketing For Improved Consumer Analysing Impact Of Real Time Marketing Introduction PDF and make the changes accordingly. You can rearrange slides or fill them with different images. Check out all the handy templates
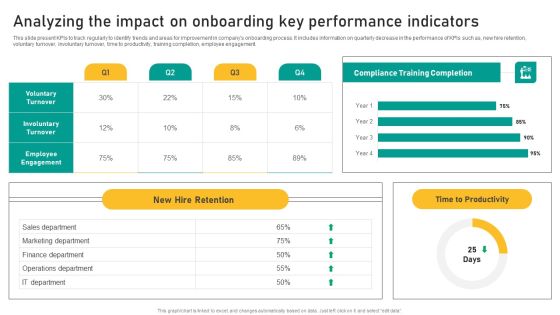
Talent Retention Initiatives For New Hire Onboarding Analyzing The Impact On Onboarding Background PDF
This slide present KPIs to track regularly to identify trends and areas for improvement in companys onboarding process. It includes information on quarterly decrease in the performance of KPIs such as, new hire retention, voluntary turnover, involuntary turnover, time to productivity, training completion, employee engagement. Find a pre designed and impeccable Talent Retention Initiatives For New Hire Onboarding Analyzing The Impact On Onboarding Background PDF. The templates can ace your presentation without additional effort. You can download these easy to edit presentation templates to make your presentation stand out from others. So, what are you waiting for Download the template from Slidegeeks today and give a unique touch to your presentation.
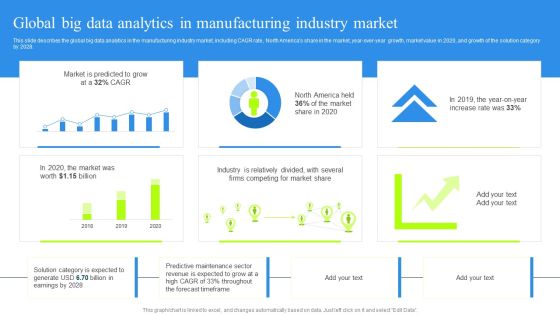
Global Big Data Analytics In Manufacturing Industry Market Pictures PDF
This slide describes the global big data analytics in the manufacturing industry market, including CAGR rate, North Americas share in the market, year-over-year growth, market value in 2020, and growth of the solution category by 2028. Find a pre-designed and impeccable Global Big Data Analytics In Manufacturing Industry Market Pictures PDF. The templates can ace your presentation without additional effort. You can download these easy-to-edit presentation templates to make your presentation stand out from others. So, what are you waiting for Download the template from Slidegeeks today and give a unique touch to your presentation.
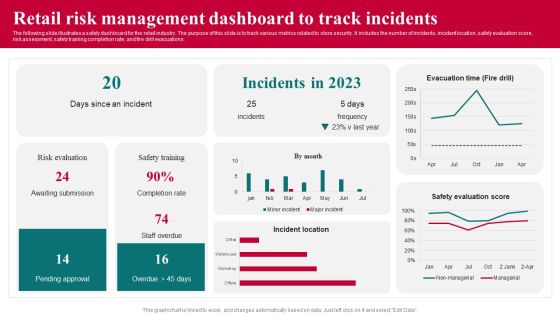
Retail Risk Management Dashboard To Track Incidents Professional PDF
The following slide illustrates a safety dashboard for the retail industry. The purpose of this slide is to track various metrics related to store security. It includes the number of incidents, incident location, safety evaluation score,risk assessment, safety training completion rate, and fire drill evacuations. Showcasing this set of slides titled Retail Risk Management Dashboard To Track Incidents Professional PDF. The topics addressed in these templates are Risk Evaluation, Retail Risk Management Dashboard, Track Incidents. All the content presented in this PPT design is completely editable. Download it and make adjustments in color, background, font etc. as per your unique business setting.

Business Vendor Performance Dashboard KPI With Top Supplier For Manufacturing Business Information PDF
Following slide contains executive dashboard which provide managers to track and monitor trends over a period of time. This include elements such as revenue, top products, top supplier, top customer, revenue trends annually, etc. Showcasing this set of slides titled Business Vendor Performance Dashboard KPI With Top Supplier For Manufacturing Business Information PDF. The topics addressed in these templates are Customers, Product, Sales. All the content presented in this PPT design is completely editable. Download it and make adjustments in color, background, font etc. as per your unique business setting.
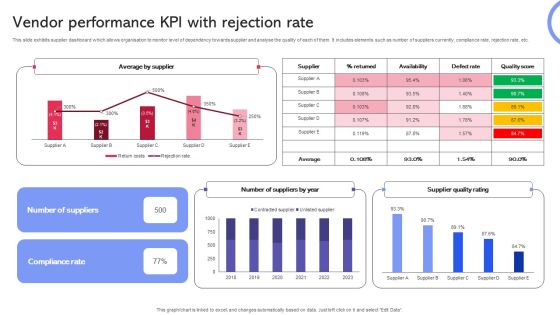
Vendor Performance KPI With Rejection Rate Inspiration PDF
This slide exhibits supplier dashboard which allows organisation to monitor level of dependency towards supplier and analyse the quality of each of them. It includes elements such as number of suppliers currently, compliance rate, rejection rate, etc. Pitch your topic with ease and precision using this Vendor Performance KPI With Rejection Rate Inspiration PDF. This layout presents information on Vendor Performance KPI, Rejection Rate. It is also available for immediate download and adjustment. So, changes can be made in the color, design, graphics or any other component to create a unique layout.
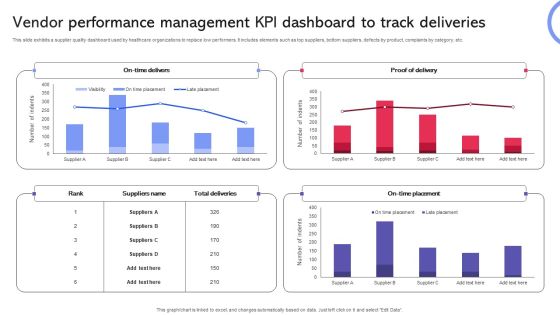
Vendor Performance Management KPI Dashboard To Track Deliveries Graphics PDF
This slide exhibits a supplier quality dashboard used by healthcare organizations to replace low performers. It includes elements such as top suppliers, bottom suppliers, defects by product, complaints by category, etc. Showcasing this set of slides titled Vendor Performance Management KPI Dashboard To Track Deliveries Graphics PDF. The topics addressed in these templates are Vendor Performance Management, KPI Dashboard, Track Deliveries. All the content presented in this PPT design is completely editable. Download it and make adjustments in color, background, font etc. as per your unique business setting.

Vendor Quality Performance KPI Dashboard For Healthcare Providers Introduction PDF
This slide exhibits a supplier quality dashboard used by healthcare organizations to replace low performers. It includes elements such as top suppliers, bottom suppliers, defects by product, complaints by category, etc. Showcasing this set of slides titled Vendor Quality Performance KPI Dashboard For Healthcare Providers Introduction PDF. The topics addressed in these templates are Vendor Quality, Performance KPI Dashboard, Healthcare Providers. All the content presented in this PPT design is completely editable. Download it and make adjustments in color, background, font etc. as per your unique business setting.

Customer Segmentation And Behavioral Analysis Target Customer Analysis Ideas PDF
The following slide presents a dashboard for analyzing customer segmentation based on demographics factors. It includes key components such as appointment status value, count of payment method, total payments and age count. The Customer Segmentation And Behavioral Analysis Target Customer Analysis Ideas PDF is a compilation of the most recent design trends as a series of slides. It is suitable for any subject or industry presentation, containing attractive visuals and photo spots for businesses to clearly express their messages. This template contains a variety of slides for the user to input data, such as structures to contrast two elements, bullet points, and slides for written information. Slidegeeks is prepared to create an impression.

Comprehensive Guide To Build Marketing Strategy Marketing Strategic Plan Portrait PDF
The slide showcases a plan for managing and tracking performance of marketing process. It includes elements such as key tasks, task owner, priority, timeline, due date and status. Create an editable Comprehensive Guide To Build Marketing Strategy Marketing Strategic Plan Portrait PDF that communicates your idea and engages your audience. Whether you are presenting a business or an educational presentation, pre designed presentation templates help save time. Comprehensive Guide To Build Marketing Strategy Marketing Strategic Plan Portrait PDF is highly customizable and very easy to edit, covering many different styles from creative to business presentations. Slidegeeks has creative team members who have crafted amazing templates. So, go and get them without any delay.

Transforming Manufacturing With Automation Global Spending On Industrial Elements PDF
This slide depicts the global spending on the industrial internet of things technologies from 2019 to 2027. The market is segmented as IoT security, IoT hardware, IoT services, IoT software and total. Find a pre designed and impeccable Transforming Manufacturing With Automation Global Spending On Industrial Elements PDF. The templates can ace your presentation without additional effort. You can download these easy to edit presentation templates to make your presentation stand out from others. So, what are you waiting for Download the template from Slidegeeks today and give a unique touch to your presentation.

Marketing Mix Strategy Handbook Marketing Strategic Plan For Task Management Ideas PDF
The slide showcases a plan for managing and tracking performance of marketing process. It includes elements such as key tasks, task owner, priority, timeline, due date and status. The Marketing Mix Strategy Handbook Marketing Strategic Plan For Task Management Ideas PDF is a compilation of the most recent design trends as a series of slides. It is suitable for any subject or industry presentation, containing attractive visuals and photo spots for businesses to clearly express their messages. This template contains a variety of slides for the user to input data, such as structures to contrast two elements, bullet points, and slides for written information. Slidegeeks is prepared to create an impression.
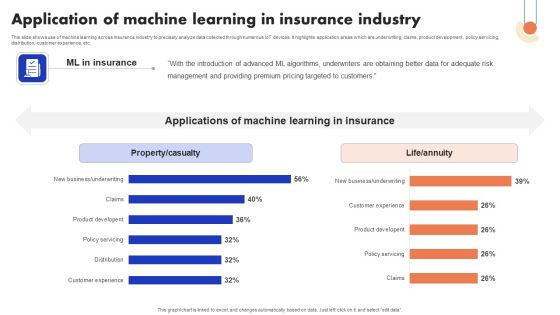
Implementation Of Digital Advancement Techniques Application Of Machine Learning Elements PDF
This slide shows use of machine learning across insurance industry to precisely analyze data collected through numerous IoT devices. It highlights application areas which are underwriting, claims, product development, policy servicing, distribution, customer experience, etc, Find a pre designed and impeccable Implementation Of Digital Advancement Techniques Application Of Machine Learning Elements PDF. The templates can ace your presentation without additional effort. You can download these easy to edit presentation templates to make your presentation stand out from others. So, what are you waiting for Download the template from Slidegeeks today and give a unique touch to your presentation.

Test Optimization Procedure Impact On Business Growth Structure PDF
Following slides showcases impact of test process improvement on improving business performance and productivity. It include key impacts such as reduction in software downtime, improvement in software quality, increase productivity and reduced product defects. Showcasing this set of slides titled Test Optimization Procedure Impact On Business Growth Structure PDF. The topics addressed in these templates are Process Improvement, Business Performance, Implementation, Corrective Measures. All the content presented in this PPT design is completely editable. Download it and make adjustments in color, background, font etc. as per your unique business setting.
Effective NPO Promotional Strategies For Recruit Volunteers Positive Impact Of Nonprofit Marketing Email Success Rate Sample PDF
This slide provides an overview of the improved email open rate. The open rate was enhanced due to audience segmentation, improved content and catchy subject lines. If your project calls for a presentation, then Slidegeeks is your go-to partner because we have professionally designed, easy-to-edit templates that are perfect for any presentation. After downloading, you can easily edit Effective NPO Promotional Strategies For Recruit Volunteers Positive Impact Of Nonprofit Marketing Email Success Rate Sample PDF and make the changes accordingly. You can rearrange slides or fill them with different images. Check out all the handy templates
Analyzing Impact Of Performance Marketing Campaigns Themes PDF
This slide showcases impact of performance marketing campaigns which can help organization to evaluate the effectiveness of executed plan. Its key elements are website traffic and product sales. This Analyzing Impact Of Performance Marketing Campaigns Themes PDF is perfect for any presentation, be it in front of clients or colleagues. It is a versatile and stylish solution for organizing your meetings. The Analyzing Impact Of Performance Marketing Campaigns Themes PDF features a modern design for your presentation meetings. The adjustable and customizable slides provide unlimited possibilities for acing up your presentation. Slidegeeks has done all the homework before launching the product for you. So, do not wait, grab the presentation templates today

Educational Technology Business Executive Report Clipart PDF
This slide showcase EdTech company ABC ed-tech limited summary that helps shareholders, readers and competitors to understand company overview and key insights. It includes elements such as mission and vision statement, services, achievements etc. Pitch your topic with ease and precision using this Educational Technology Business Executive Report Clipart PDF. This layout presents information on Services, Achievements, Overview. It is also available for immediate download and adjustment. So, changes can be made in the color, design, graphics or any other component to create a unique layout.

Hospitality Business Service Executive Report Demonstration PDF
This slide provide description of hospitability business that provide world class experience to travelers. It includes elements such as revenue streams, customer segment , channel traffic value propositions, products, annual revenue etc. Showcasing this set of slides titled Hospitality Business Service Executive Report Demonstration PDF. The topics addressed in these templates are Customer Segment, Revenue Streams, Value Propositions. All the content presented in this PPT design is completely editable. Download it and make adjustments in color, background, font etc. as per your unique business setting.

Annually E Mail Performance Campaign Statistics Analysis Infographics PDF
This slide showcases the yearly figures for the number of emails sent and received globally. It consists the number of mail sent and received from the past five years and forecasted emails to be sent or received in upcoming years. Showcasing this set of slides titled Annually E Mail Performance Campaign Statistics Analysis Infographics PDF. The topics addressed in these templates are Annually E Mail Performance, Campaign Statistics Analysis. All the content presented in this PPT design is completely editable. Download it and make adjustments in color, background, font etc. as per your unique business setting.
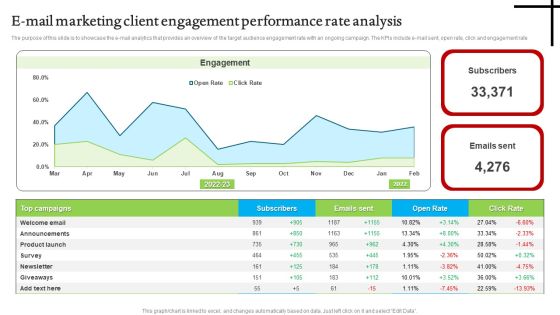
E Mail Marketing Client Engagement Performance Rate Analysis Ideas PDF
The purpose of this slide is to showcase the e-mail analytics that provides an overview of the target audience engagement rate with an ongoing campaign. The KPIs include e-mail sent, open rate, click and engagement rate. Showcasing this set of slides titled E Mail Marketing Client Engagement Performance Rate Analysis Ideas PDF. The topics addressed in these templates are E Mail Marketing, Client Engagement Performance, Rate Analysis. All the content presented in this PPT design is completely editable. Download it and make adjustments in color, background, font etc. as per your unique business setting.

E Mail Marketing Performance Goals Achieved Survey Analysis Sample PDF
The purpose of this slide is to illustrate the survey outcomes in order to measure the effectiveness of e-mail campaigns. Certain metrics include an increase in ROI, conversions, list growth, etc. Pitch your topic with ease and precision using this E Mail Marketing Performance Goals Achieved Survey Analysis Sample PDF. This layout presents information on E Mail Marketing Performance, Goals Achieved Survey Analysis. It is also available for immediate download and adjustment. So, changes can be made in the color, design, graphics or any other component to create a unique layout.

E Mail Opening Rate Performance Statistics Analysis Mockup PDF
This slide showcases the line graph that measures the opening rate of an e-mail on various devices. It includes the data figures of devices like desktop, mobile, and tablets to operate mail of the past seven years. Showcasing this set of slides titled E Mail Opening Rate Performance Statistics Analysis Mockup PDF. The topics addressed in these templates are E Mail Opening Rate, Performance Statistics Analysis. All the content presented in this PPT design is completely editable. Download it and make adjustments in color, background, font etc. as per your unique business setting.

E Mail Performance Analytics Metrics Tracking Report Analysis Demonstration PDF
The purpose of this slide is to showcase an e-mail analytics mechanism in order to track the performance of certain e-mail marketing based on various metrics. Certain KPIs include open rate, click rate, unsubscribe rate etc. Pitch your topic with ease and precision using this E Mail Performance Analytics Metrics Tracking Report Analysis Demonstration PDF. This layout presents information on E Mail Performance Analytics, Metrics Tracking Report Analysis. It is also available for immediate download and adjustment. So, changes can be made in the color, design, graphics or any other component to create a unique layout.

Global Email Marketing Performance Metrics Analysis Microsoft PDF
This slide showcases the insights of commonly used email marketing metrics to measure worldwide performance reports. It includes statistics of email marketing metrics, email marketing strategies, and marketing tools. Pitch your topic with ease and precision using this Global Email Marketing Performance Metrics Analysis Microsoft PDF. This layout presents information on Global Email Marketing, Performance Metrics Analysis. It is also available for immediate download and adjustment. So, changes can be made in the color, design, graphics or any other component to create a unique layout.

Various E Mail Campaign Performance Statistics Analysis Graphics PDF
The purpose of this slide is to evaluate the different e-mail campaign performance outcomes between the year 2021-2022. E-mail categories include discounts and offers, advice, info or tutorial, confirmations or updates etc. Showcasing this set of slides titled Various E Mail Campaign Performance Statistics Analysis Graphics PDF. The topics addressed in these templates are Various E Mail Campaign, Performance Statistics Analysis. All the content presented in this PPT design is completely editable. Download it and make adjustments in color, background, font etc. as per your unique business setting.

Weekly Email Marketing Campaign Performance Dashboard Analysis Structure PDF
This slide showcase the performance data of email marketing implemented by an organization in a dashboard report. It includes statistics of email sent, delivered, open rate, click rate, unsubscribe rate, bounce rate, etc. Pitch your topic with ease and precision using this Weekly Email Marketing Campaign Performance Dashboard Analysis Structure PDF. This layout presents information on Weekly Email Marketing, Campaign Performance Dashboard Analysis. It is also available for immediate download and adjustment. So, changes can be made in the color, design, graphics or any other component to create a unique layout.

Comparative Analysis Of Various Lead Generation Marketing Channels Guidelines PDF
The slide illustrates a marketing channel survey to identify the best source for generating leads and creating awareness. The sources are phone callings, web blogs, referrals, webinars and conferences, public relations, paid and email advertising. Showcasing this set of slides titled Comparative Analysis Of Various Lead Generation Marketing Channels Guidelines PDF. The topics addressed in these templates are Paid Advertising, Email Marketing, Effective Strategies. All the content presented in this PPT design is completely editable. Download it and make adjustments in color, background, font etc. as per your unique business setting.

Six Months Lead Generation Marketing Dashboard Inspiration PDF
The slide carries lead generation dashboard to build deeper understanding of business and customer journey. Various KPIs included are lead values per month, number of leads per month and lead marketing channels. Showcasing this set of slides titled Six Months Lead Generation Marketing Dashboard Inspiration PDF. The topics addressed in these templates are Six Months Lead Generation, Marketing Dashboard. All the content presented in this PPT design is completely editable. Download it and make adjustments in color, background, font etc. as per your unique business setting.

Forecasting Multiverse Size By Various Components Structure PDF
Following slide showcases predicted metaverse market growth in recent years to determine future business opportunities. It includes elements such as social media ads, live entertainment, gaming hardware, gaming software and services, augmented reality and virtual reality. Showcasing this set of slides titled Forecasting Multiverse Size By Various Components Structure PDF. The topics addressed in these templates are Forecasting Multiverse Size, Various Components. All the content presented in this PPT design is completely editable. Download it and make adjustments in color, background, font etc. as per your unique business setting.
KPI Dashboard For Tracking Multiverse Market Growth Background PDF
Following slide demonstrates KPI dashboard for predicting metaverse market share growth to determine business development opportunities. It includes elements such as total addressable market insights, global market share, monthly active users on metaverse and market size growth. Showcasing this set of slides titled KPI Dashboard For Tracking Multiverse Market Growth Background PDF. The topics addressed in these templates are Addressable Market Insights, Global Market Share, Growth Prediction. All the content presented in this PPT design is completely editable. Download it and make adjustments in color, background, font etc. as per your unique business setting.

Top SEM Strategy Trends For Forecasting Microsoft PDF
This slide shows top search engine marketing trends which can be considered for planning future strategies and optimizing website traffic. It include two main categories of search engine marketing such as mobile searches and desktop searches. Showcasing this set of slides titled Top SEM Strategy Trends For Forecasting Microsoft PDF. The topics addressed in these templates are Revenue, Major Source, Ground For Growth. All the content presented in this PPT design is completely editable. Download it and make adjustments in color, background, font etc. as per your unique business setting.

E Mail Marketing User Business Data Portrait PDF
This slide shows data related to users of E-mail that can be used in framing E-Marketing strategy to convert leads into the sales. It include no of registered users, lead conversion rates and preference rate of users etc. Showcasing this set of slides titled E Mail Marketing User Business Data Portrait PDF. The topics addressed in these templates are Consumers Leads, Sales, Professional Mails. All the content presented in this PPT design is completely editable. Download it and make adjustments in color, background, font etc. as per your unique business setting.
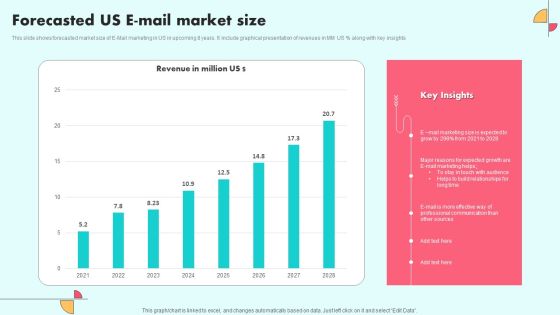
Forecasted Us E Mail Market Size Ideas PDF
This slide shows forecasted market size of E-Mail marketing in US in upcoming 8 years. It include graphical presentation of revenues in MM US percentage along with key insights. Pitch your topic with ease and precision using this Forecasted Us E Mail Market Size Ideas PDF. This layout presents information on E Mail Marketing, Sources, Communication. It is also available for immediate download and adjustment. So, changes can be made in the color, design, graphics or any other component to create a unique layout.

Digital Consultation Growth Chart After Pandemic Ppt Slides
This template depicts the growth chart of telemedicine after the pandemic. The purpose of this slide is to measure the telemedicine used by the target audience after the pandemic. It evaluate by conducting survey on e health portal Showcasing this set of slides titled Digital Consultation Growth Chart After Pandemic Ppt Slides. The topics addressed in these templates are Consultation, Growth, Pandemic. All the content presented in this PPT design is completely editable. Download it and make adjustments in color, background, font etc. as per your unique business setting.

Growth Rate Of Digital Medical Consultation Market Size Ppt Information
This template shows the predictive graph of global market size. The purpose of this slide is to forecast the market size of medical consultation online by the end of the year 2026. It estimated the CAGR around 26.6 percentage. Showcasing this set of slides titled Growth Rate Of Digital Medical Consultation Market Size Ppt Information. The topics addressed in these templates are Growth, Digital, Market. All the content presented in this PPT design is completely editable. Download it and make adjustments in color, background, font etc. as per your unique business setting.

Market Growth Of Digital Consultation Service Globally Ppt Infographics
This template shows the to measure the market growth of a service. The purpose of this slide is to evaluate the estimated growth size of online consultation globally. It includes KPIs such as remote patient monitoring, market segmentation, etc. Showcasing this set of slides titled Market Growth Of Digital Consultation Service Globally Ppt Infographics. The topics addressed in these templates are Growth, Digital, Service. All the content presented in this PPT design is completely editable. Download it and make adjustments in color, background, font etc. as per your unique business setting.

360 Degree Sales Analysis Dashboard After Marketing Plan Implementation Pictures PDF
This template shows the sales analysis dashboard after implementing an effective marketing plan. This slide aims to measure the potential and actual results of the sales target. It includes KPIs such as the number of page views on the website, total sales, subscribers, etc.Pitch your topic with ease and precision using this 360 Degree Sales Analysis Dashboard After Marketing Plan Implementation Pictures PDF. This layout presents information on Lead Generation Life, Conversion Rate. It is also available for immediate download and adjustment. So, changes can be made in the color, design, graphics or any other component to create a unique layout.

Loyalty Incentives Program Performance Dashboard Microsoft PDF
This slide illustrates statistics to measure buying activity of potential and existing customers. It includes information on the overall volume of new clients, the typical number of orders per client, all time churned customers, etc.Showcasing this set of slides titled Loyalty Incentives Program Performance Dashboard Microsoft PDF. The topics addressed in these templates are Total Churned Customer, Passive Churned Customer. All the content presented in this PPT design is completely editable. Download it and make adjustments in color, background, font etc. as per your unique business setting.
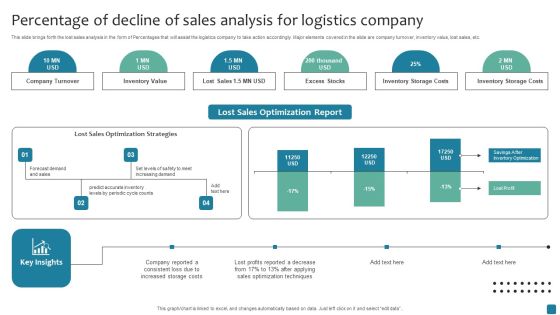
Percentage Of Decline Of Sales Analysis For Logistics Company Topics PDF
This slide brings forth the lost sales analysis in the form of Percentages that will assist the logistics company to take action accordingly. Major elements covered in the slide are company turnover, inventory value, lost sales, etc. Showcasing this set of slides titled Percentage Of Decline Of Sales Analysis For Logistics Company Themes PDF. The topics addressed in these templates are Lost Sales Optimization Strategies. All the content presented in this PPT design is completely editable. Download it and make adjustments in color, background, font etc. as per your unique business setting.

Top Factors Contributing To Decline Of Sales Demonstration PDF
Following slide presents major factors that are responsible for contributing to lost sales that assist managers in order to improve operations accordingly. Major factors covered are lack of qualified leads, lack of competitive differentiation, length of sales pipeline, etc. Showcasing this set of slides titled Top Factors Contributing To Decline Of Sales Demonstration PDF. The topics addressed in these templates are Top Factors Contributing, Decline Of Sales. All the content presented in this PPT design is completely editable. Download it and make adjustments in color, background, font etc. as per your unique business setting.

Customer Decline Of Sales Analysis Dashboard Rules PDF
The following slide presents a key performance indicating dashboards that can be used by managers in order to analyse customer-lost sales. Major key performance indicators are lost deals rate, lost sales rate, customer data analytics, etc. Pitch your topic with ease and precision using this Customer Decline Of Sales Analysis Dashboard Rules PDF. This layout presents information on Customer Data Analytics. It is also available for immediate download and adjustment. So, changes can be made in the color, design, graphics or any other component to create a unique layout.

Inventory Stock Out And Decline Of Sales Analysis Dashboard Inspiration PDF
Following slide presents a key performance indicating dashboard that can be used by businesses to track Inventory stock out and lost sales. Major key performance indicators are percentage stockouts, amount of sales, lost sales accountability, etc. Pitch your topic with ease and precision using this Inventory Stock Out And Decline Of Sales Analysis Dashboard Inspiration PDF. This layout presents information on Lost Sales Summary, Stock Out Details It is also available for immediate download and adjustment. So, changes can be made in the color, design, graphics or any other component to create a unique layout.

Kpis To Optimize For Overcoming Decline Of Sales Mockup PDF
This slide consists of key performance indicators that can be implemented by managers for optimizing and overcoming lost sales. Major key performance indicators are stockout rate, order fulfilment rate, customer satisfaction rate, etc. Showcasing this set of slides titled Kpis To Optimize For Overcoming Decline Of Sales Mockup PDF. The topics addressed in these templates are Target, Actual, Deviation. All the content presented in this PPT design is completely editable. Download it and make adjustments in color, background, font etc. as per your unique business setting.

Content Analysis Survey Outcome Percentage Formats PDF
The slide showcases results of content analysis survey in percentage to increase website traffic and customer engagement rate. It includes key elements like case studies, organic research, trending topics, marketing topic and checklists. Showcasing this set of slides titled Content Analysis Survey Outcome Percentage Formats PDF. The topics addressed in these templates are Content Analysis, Survey Outcome Percentage. All the content presented in this PPT design is completely editable. Download it and make adjustments in color, background, font etc. as per your unique business setting.

Customer Experience Analysis Survey Outcome Percentage Portrait PDF
The following slide highlights percentage of results to analyze and enhance customer experience. It includes key elements such as customer experience with product, global net promoter score, regional sales agent performance, satisfaction channel, quarterly NPS, etc. Pitch your topic with ease and precision using this Customer Experience Analysis Survey Outcome Percentage Portrait PDF. This layout presents information on Customer Experience, Promoter Score, Regional Sales. It is also available for immediate download and adjustment. So, changes can be made in the color, design, graphics or any other component to create a unique layout.

Customer Service Satisfaction Survey Outcome In Percentage Microsoft PDF
The slide showcases percentage result of customer satisfaction to identify service improvement areas. It includes key questions related to service satisfaction, service recommendation, business type and service improvement areas. Pitch your topic with ease and precision using this Customer Service Satisfaction Survey Outcome In Percentage Microsoft PDF. This layout presents information on Customer Service, Satisfaction Survey, Outcome In Percentage. It is also available for immediate download and adjustment. So, changes can be made in the color, design, graphics or any other component to create a unique layout.
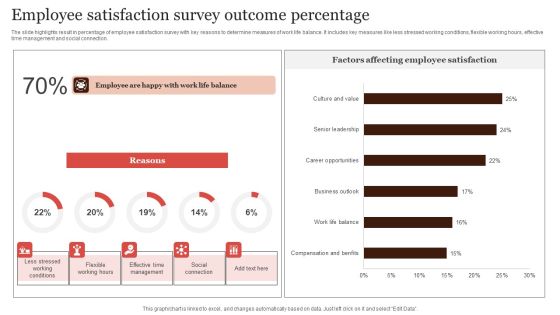
Employee Satisfaction Survey Outcome Percentage Graphics PDF
The slide highlights result in percentage of employee satisfaction survey with key reasons to determine measures of work life balance. It includes key measures like less stressed working conditions, flexible working hours, effective time management and social connection. Showcasing this set of slides titled Employee Satisfaction Survey Outcome Percentage Graphics PDF. The topics addressed in these templates are Factors Affecting, Employee Satisfaction, Survey Outcome Percentage. All the content presented in this PPT design is completely editable. Download it and make adjustments in color, background, font etc. as per your unique business setting.
Online Shopping Survey Outcome In Percentage Icons PDF
The slide showcases percentage results to analyze experience of online shopping to identify areas for enhancing shopping experience. It includes key elements such as reasons for online shopping, elements considered by customers and shopping platforms. Pitch your topic with ease and precision using this Online Shopping Survey Outcome In Percentage Icons PDF. This layout presents information on Price Comparison, Product Information, Online Reviews. It is also available for immediate download and adjustment. So, changes can be made in the color, design, graphics or any other component to create a unique layout.

Outcome In Percentage Of Social Media Survey Demonstration PDF
This slide showcases percentage results of social media survey analyzing youngsters frequency of going online. It includes key elements like trending social media platforms, youngsters own their personal smartphone, etc. Showcasing this set of slides titled Outcome In Percentage Of Social Media Survey Demonstration PDF. The topics addressed in these templates are Frequently Youngsters, Trending Social Apps, Personal Smartphones. All the content presented in this PPT design is completely editable. Download it and make adjustments in color, background, font etc. as per your unique business setting.
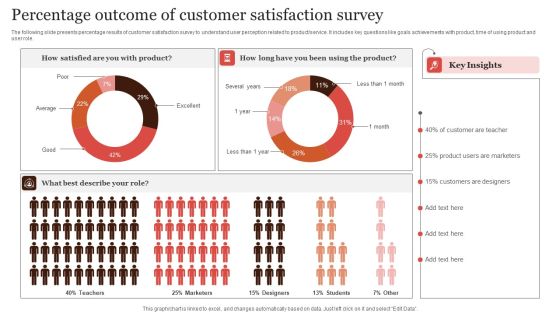
Percentage Outcome Of Customer Satisfaction Survey Infographics PDF
The following slide presents percentage results of customer satisfaction survey to understand user perception related to product or service. It includes key questions like goals achievements with product, time of using product and user role. Pitch your topic with ease and precision using this Percentage Outcome Of Customer Satisfaction Survey Infographics PDF. This layout presents information on Percentage Outcome, Customer Satisfaction Survey. It is also available for immediate download and adjustment. So, changes can be made in the color, design, graphics or any other component to create a unique layout.
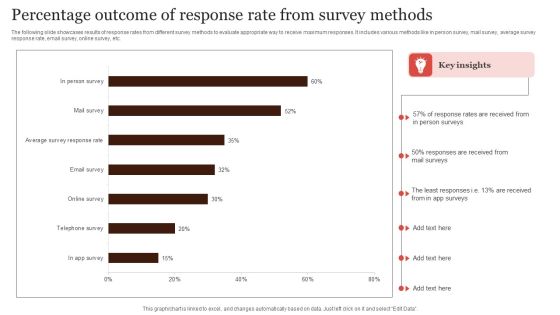
Percentage Outcome Of Response Rate From Survey Methods Guidelines PDF
The following slide showcases results of response rates from different survey methods to evaluate appropriate way to receive maximum responses. It includes various methods like in person survey, mail survey, average survey response rate, email survey, online survey, etc. Showcasing this set of slides titled Percentage Outcome Of Response Rate From Survey Methods Guidelines PDF. The topics addressed in these templates are Percentage Outcome, Response Rate, Survey Methods. All the content presented in this PPT design is completely editable. Download it and make adjustments in color, background, font etc. as per your unique business setting.

Product Market Research Survey Outcome Percentage Elements PDF
This slide showcases percentage of results of market research and analysis survey to effectively understand customer behavior towards product or service. It includes key elements like customer profession, customer by countries and customer responses. Pitch your topic with ease and precision using this Product Market Research Survey Outcome Percentage Elements PDF. This layout presents information on Customer By Countries, Customer Professions, Customer Responses. It is also available for immediate download and adjustment. So, changes can be made in the color, design, graphics or any other component to create a unique layout.
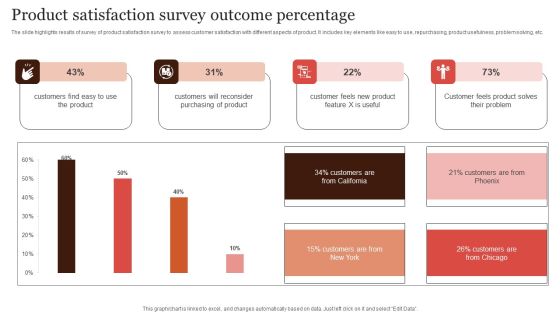
Product Satisfaction Survey Outcome Percentage Elements PDF
The slide highlights results of survey of product satisfaction survey to assess customer satisfaction with different aspects of product. It includes key elements like easy to use, repurchasing, product usefulness, problem solving, etc. Showcasing this set of slides titled Product Satisfaction Survey Outcome Percentage Elements PDF. The topics addressed in these templates are Customers Will Reconsider, Purchasing Of Product, Survey Outcome Percentage. All the content presented in this PPT design is completely editable. Download it and make adjustments in color, background, font etc. as per your unique business setting.
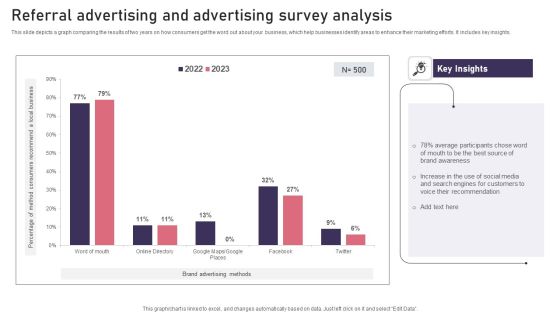
Referral Advertising And Advertising Survey Analysis Background PDF
This slide depicts a graph comparing the results of two years on how consumers get the word out about your business, which help businesses identify areas to enhance their marketing efforts. It includes key insights. Showcasing this set of slides titled Referral Advertising And Advertising Survey Analysis Background PDF. The topics addressed in these templates are Referral Advertising, Advertising Survey Analysis. All the content presented in this PPT design is completely editable. Download it and make adjustments in color, background, font etc. as per your unique business setting.
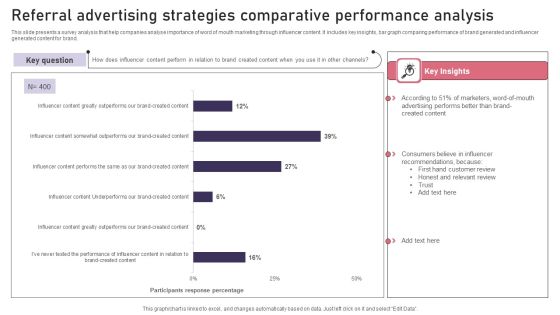
Referral Advertising Strategies Comparative Performance Analysis Diagrams PDF
This slide presents a survey analysis that help companies analyse importance of word of mouth marketing through influencer content. It includes key insights, bar graph comparing performance of brand generated and influencer generated content for brand. Showcasing this set of slides titled Referral Advertising Strategies Comparative Performance Analysis Diagrams PDF. The topics addressed in these templates are Referral Advertising, Strategies Comparative, Performance Analysis. All the content presented in this PPT design is completely editable. Download it and make adjustments in color, background, font etc. as per your unique business setting.

Business Project Management Program Hazards Assessment Icons PDF
The following slide provide a risk management dashboard which helps business and organisation to identify the error levels and take necessary actions accordingly. Key elements are risk heat map, vulnerabilities, action plan breakdown, risk rating etc.Showcasing this set of slides titled Business Project Management Program Hazards Assessment Icons PDF. The topics addressed in these templates are Average Risk Threshold, Risk Threshold. All the content presented in this PPT design is completely editable. Download it and make adjustments in color, background, font etc. as per your unique business setting.
Email Advertising Report Growth Dashboard Formats PDF
This slide dashboard is helpful for managers, executives, and stakeholders to display the effectiveness of an email marketing strategy. It includes active accounts, deleted accounts, and unsubscribed accounts in a month and a year. Pitch your topic with ease and precision using this Email Advertising Report Growth Dashboard Formats PDF. This layout presents information on Email Advertising, Report Growth Dashboard . It is also available for immediate download and adjustment. So, changes can be made in the color, design, graphics or any other component to create a unique layout.
HR Attrition Rate By Company Size Elements PDF
This slide consists of turnover rate of employees which can be used by recruiters, business owners, industry decision-makers, organizations, and data analysts to obtain a general understanding of the turnover rate in the economy. Key elements covered are number of employees working in the organization, duration of employment and turnover rate. Pitch your topic with ease and precision using this HR Attrition Rate By Company Size Elements PDF. This layout presents information on Key Takeaways, Business Sizes, Employees. It is also available for immediate download and adjustment. So, changes can be made in the color, design, graphics or any other component to create a unique layout.
Forecasted Land Asset Management Software Market Share Introduction PDF
Following slide demonstrates forecasted market share of asset management software by different regions to determine business future potential. It includes key components such as users growth by different countries and number of users. Showcasing this set of slides titled Forecasted Land Asset Management Software Market Share Introduction PDF. The topics addressed in these templates are Services Requirement, Asset Management, Maximum Growth. All the content presented in this PPT design is completely editable. Download it and make adjustments in color, background, font etc. as per your unique business setting.
Kpis List Of Project Management Lifecycle Formats PDF
This slide depicts project management indicators list which helps manager to measure company and sector and evaluate performance achieving strategies. It include indicators such as average score, result areas and review of the project. Pitch your topic with ease and precision using this Kpis List Of Project Management Lifecycle Formats PDF. This layout presents information on Project Management, Performance Score, Average. It is also available for immediate download and adjustment. So, changes can be made in the color, design, graphics or any other component to create a unique layout.
Facebook Analytics Pixel Marketing Plan Dashboard Professional PDF
This slide exhibits dashboard which offers free point of view for optimization and in-depth analysis of visitors. This template helps in tracking social media and campaigns performance. It involves information related to revenue, age factor, etc. Showcasing this set of slides titled Facebook Analytics Pixel Marketing Plan Dashboard Professional PDF Graphics. The topics addressed in these templates are People Metrics, Lifetime Value, Purchases Repeated. All the content presented in this PPT design is completely editable. Download it and make adjustments in color, background, font etc. as per your unique business setting.
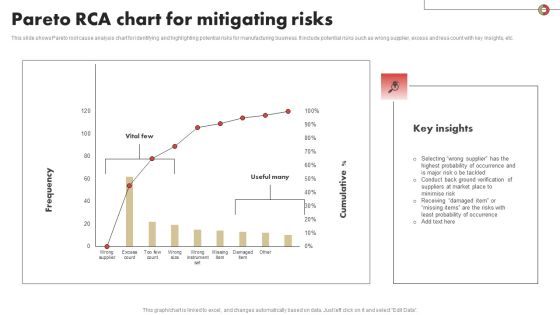
Pareto RCA Chart For Mitigating Risks Slides PDF
This slide shows Pareto root cause analysis chart for identifying and highlighting potential risks for manufacturing business. It include potential risks such as wrong supplier, excess and less count with key insights, etc. Pitch your topic with ease and precision using this Pareto RCA Chart For Mitigating Risks Slides PDF Download. This layout presents information on Mitigating, Pareto, Probability. It is also available for immediate download and adjustment. So, changes can be made in the color, design, graphics or any other component to create a unique layout.
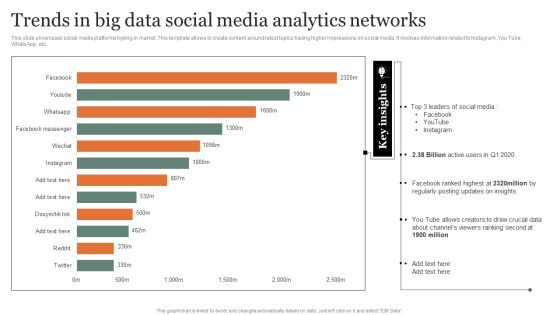
Trends In Big Data Social Media Analytics Networks Guidelines PDF
This slide showcases social media platforms hyping in market. This template allows to create content around latest topics having higher impressions on social media. It involves information related to Instagram, You Tube, WhatsApp, etc. Showcasing this set of slides titled Trends In Big Data Social Media Analytics Networks Guidelines PDF Topics. The topics addressed in these templates are Analytics Networks, Posting Updates, Ranking Second. All the content presented in this PPT design is completely editable. Download it and make adjustments in color, background, font etc. as per your unique business setting.
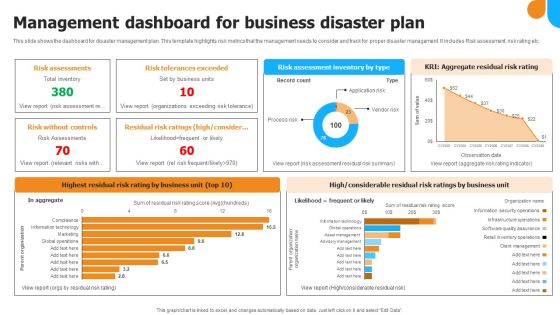
Management Dashboard For Business Disaster Plan Infographics PDF
This slide shows the dashboard for disaster management plan. This template highlights risk metrics that the management needs to consider and track for proper disaster management. It includes Risk assessment, risk rating etc. Showcasing this set of slides titled Management Dashboard For Business Disaster Plan Infographics PDF Graphics. The topics addressed in these templates are Risk Assessments, Risk Tolerances Exceeded, Risk Without Controls. All the content presented in this PPT design is completely editable. Download it and make adjustments in color, background, font etc. as per your unique business setting.
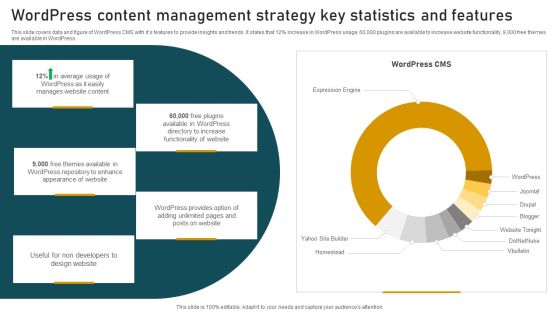
Wordpress Content Management Strategy Key Statistics And Features Summary PDF
This slide covers data and figure of WordPress CMS with its features to provide insights and trends. It states that 12 percent increase in WordPress usage, 60,000 plugins are available to increase website functionality, 9,000 free themes are available in WordPress. Showcasing this set of slides titled Wordpress Content Management Strategy Key Statistics And Features Summary PDF. The topics addressed in these templates are Wordpress Content, Management Strategy, Statistics And Features. All the content presented in this PPT design is completely editable. Download it and make adjustments in color, background, font etc. as per your unique business setting.
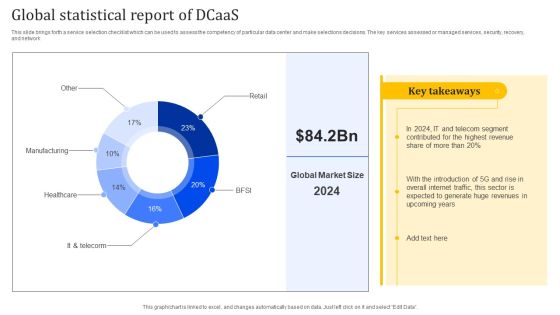
Global Statistical Report Of Dcaas Portrait PDF
This slide brings forth a service selection checklist which can be used to assess the competency of particular data center and make selections decisions. The key services assessed or managed services, security, recovery, and network. Showcasing this set of slides titled Global Statistical Report Of Dcaas Portrait PDF. The topics addressed in these templates are Manufacturing, Healthcare, Global Statistical. All the content presented in this PPT design is completely editable. Download it and make adjustments in color, background, font etc. as per your unique business setting.

Forecasted U S Merged Real And Virtual Environment Market Size Rules PDF
This slide shows market size of mixed reality in U.S. over 10 years from year 2021 to 31 over various sectors like healthcare, education and construction. It includes graph and key insights with MR sectors application and leading companies etc. Showcasing this set of slides titled Forecasted U S Merged Real And Virtual Environment Market Size Rules PDF. The topics addressed in these templates are MR Technology Segment, Mixed Technology, Technology Company Limited. All the content presented in this PPT design is completely editable. Download it and make adjustments in color, background, font etc. as per your unique business setting.


 Continue with Email
 Sign up for an account
 Home
Home