AI PPT Maker
Templates
PPT Bundles
Design Services
Business PPTs
Business Plan
Management
Strategy
Introduction PPT
Roadmap
Self Introduction
Timelines
Process
Marketing
Agenda
Technology
Medical
Startup Business Plan
Cyber Security
Dashboards
SWOT
Proposals
Education
Pitch Deck
Digital Marketing
KPIs
Project Management
Product Management
Artificial Intelligence
Target Market
Communication
Supply Chain
Google Slides
Research Services
 One Pagers
All Categories
-
Home
- Customer Favorites
- Investment Portfolio
Investment Portfolio

Statistics Showing Annual Comparison Of Multiple Beauty Care Products Ppt Infographics Objects PDF
This slide contains graph which can be used by cosmetic manufacturing organizations to represent difference between annual sales of various products. It includes products such as skin care, hair care, oral care and others. Showcasing this set of slides titled Statistics Showing Annual Comparison Of Multiple Beauty Care Products Ppt Infographics Objects PDF. The topics addressed in these templates are Skin Care, Hair Care, 2022 To 2023. All the content presented in this PPT design is completely editable. Download it and make adjustments in color, background, font etc. as per your unique business setting.

Call Center Communication Kpis Performance Dashboard With First Call Resolution Rate Graphics PDF
This slide showcases dashboard that can help organization to analyze the performance of call center agents communication KPIs and take necessary actions in case of high abandonment rate. Its key components are average response time, first call resolution and top performing call agents. Showcasing this set of slides titled Call Center Communication Kpis Performance Dashboard With First Call Resolution Rate Graphics PDF. The topics addressed in these templates are Overall Average, Response Time, First Call Resolution, Daily Abandonment Rate. All the content presented in this PPT design is completely editable. Download it and make adjustments in color, background, font etc. as per your unique business setting.

Communication Kpis Performance Dashboard Of Social Media Channels Mockup PDF
This slide showcases dashboard that can help organization to analyze the effectiveness of communication KPIs campaign by studying channel views and number of likes. Its key components are youtube channel views, linkedin shares, linked in clicks and facebook daily reach. Pitch your topic with ease and precision using this Communication Kpis Performance Dashboard Of Social Media Channels Mockup PDF. This layout presents information on Linkedin Shares, Facebook Page likes, Facebook Daily Reach. It is also available for immediate download and adjustment. So, changes can be made in the color, design, graphics or any other component to create a unique layout.

Dashboard For Email Communication Kpis Metrics Topics PDF
This slide showcases email communication KPIs and dashboard that can help to keep track of performance of email marketing campaign. Its key elements are number of campaign, total recipients, average open percent and average click percent. Showcasing this set of slides titled Dashboard For Email Communication Kpis Metrics Topics PDF. The topics addressed in these templates are Number Campaigns, Total Recipients, Engagement Distribution. All the content presented in this PPT design is completely editable. Download it and make adjustments in color, background, font etc. as per your unique business setting.
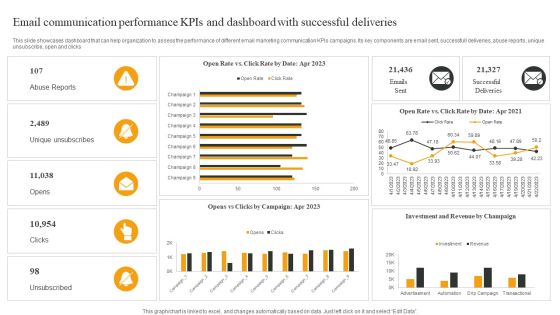
Email Communication Performance Kpis And Dashboard With Successful Deliveries Elements PDF
This slide showcases dashboard that can help organization to assess the performance of different email marketing communication KPIs campaigns. Its key components are email sent, successfull deliveries, abuse reports, unique unsubscribe, open and clicks. Showcasing this set of slides titled Email Communication Performance Kpis And Dashboard With Successful Deliveries Elements PDF. The topics addressed in these templates are Abuse Reports, Unique Unsubscribes, Opens. All the content presented in this PPT design is completely editable. Download it and make adjustments in color, background, font etc. as per your unique business setting.

Internal Organizational Communication Kpis And Dashboard With Channels Infographics PDF
This slide showcases dashboard that can help organization to assess the performance of internal communication and analyzing the user participation. Its key components are message success, channels and user engagement. Pitch your topic with ease and precision using this Internal Organizational Communication Kpis And Dashboard With Channels Infographics PDF. This layout presents information on User Participation, User Engagement, Message Success. It is also available for immediate download and adjustment. So, changes can be made in the color, design, graphics or any other component to create a unique layout.

Monthly Email Communication Kpis And Dashboard Download PDF
This slide showcases dashboard for email communication KPIs that can help organization to analyze the reach and average response time of customers. Its key elements are send messages, recipients, received messages, senders and monthly email distribution. Pitch your topic with ease and precision using this Monthly Email Communication Kpis And Dashboard Download PDF. This layout presents information on Sent Messages, Recipients, Average Response Time, Received Message. It is also available for immediate download and adjustment. So, changes can be made in the color, design, graphics or any other component to create a unique layout.
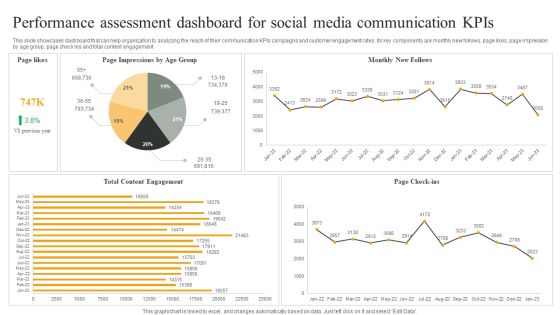
Performance Assessment Dashboard For Social Media Communication Kpis Graphics PDF
This slide showcases dashboard that can help organization to analyzing the reach of their communication KPIs campaigns and customer engagement rates. Its key components are monthly new follows, page likes, page impression by age group, page check ins and total content engagement. Pitch your topic with ease and precision using this Performance Assessment Dashboard For Social Media Communication Kpis Graphics PDF. This layout presents information on Monthly New Follows, Page Check ins, Total Content Engagement. It is also available for immediate download and adjustment. So, changes can be made in the color, design, graphics or any other component to create a unique layout.

Business Disaster Threat Cause Pie Chart Ppt Pictures Gallery PDF
The given below slide showcases the major causes of business disasters to assess and formulate recovery plan accordingly. It mainly includes software failure, data sabotage, ransomware, human error, hardware failure etc. Showcasing this set of slides titled Business Disaster Threat Cause Pie Chart Ppt Pictures Gallery PDF. The topics addressed in these templates are Key Insights, Few Possible Solutions, Implement Data Backup. All the content presented in this PPT design is completely editable. Download it and make adjustments in color, background, font etc. as per your unique business setting.

Five Element Disaster Threat Recovery Status Ppt Outline Inspiration PDF
The below slide presents the disaster risk recovery plan status to have quick insight of vulnerabilities. It includes elements such as systems, services, staff, supplier, sites along with the disruptions and corrective actions. Pitch your topic with ease and precision using this Five Element Disaster Threat Recovery Status Ppt Outline Inspiration PDF. This layout presents information on Health Status, Disruptions, Gaps. It is also available for immediate download and adjustment. So, changes can be made in the color, design, graphics or any other component to create a unique layout.
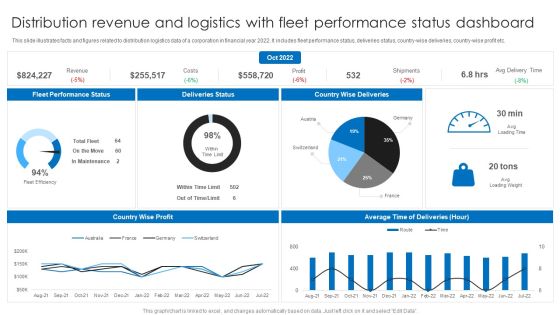
Distribution Revenue And Logistics With Fleet Performance Status Dashboard Ppt Layouts Background PDF
This slide illustrates facts and figures related to distribution logistics data of a corporation in financial year 2022. It includes fleet performance status, deliveries status, country-wise deliveries, country-wise profit etc. Pitch your topic with ease and precision using this Distribution Revenue And Logistics With Fleet Performance Status Dashboard Ppt Layouts Background PDF. This layout presents information on Deliveries Status, Country Wise Deliveries, Fleet Performance Status. It is also available for immediate download and adjustment. So, changes can be made in the color, design, graphics or any other component to create a unique layout.

Future Trends Of IT Infrastructure And Operations Information Tech System Maintenance Ideas PDF
This slide covers the future trends of IT infrastructure and operations such automation strategy rethinking, disaster recovery strategies, scaling devOps agility, impact of IoT, etc. Find a pre-designed and impeccable Future Trends Of IT Infrastructure And Operations Information Tech System Maintenance Ideas PDF. The templates can ace your presentation without additional effort. You can download these easy to edit presentation templates to make your presentation stand out from others. So, what are you waiting for Download the template from Slidegeeks today and give a unique touch to your presentation.

Infrastructure Management With System Center Operations Manager SCOM Themes PDF
This slide covers the dashboard which can be used to monitor server applications and business transactions of the organization.Create an editable Infrastructure Management With System Center Operations Manager SCOM Themes PDF that communicates your idea and engages your audience. Whether you are presenting a business or an educational presentation, pre-designed presentation templates help save time.Infrastructure Management With System Center Operations Manager SCOM Themes PDF is highly customizable and very easy to edit, covering many different styles from creative to business presentations. Slidegeeks has creative team members who have crafted amazing templates. So, go and get them without any delay.

30 60 90 Days Sales And Promotion Planning Valuation Icon Summary PDF
The given below slide showcases the required actions to improve companys sales and achieve the set targets. It also includes KPIs such as product, projection, and quality standards etc. Showcasing this set of slides titled 30 60 90 Days Sales And Promotion Planning Valuation Icon Summary PDF. The topics addressed in these templates are Quality Standards, Products, Projection. All the content presented in this PPT design is completely editable. Download it and make adjustments in color, background, font etc. as per your unique business setting.
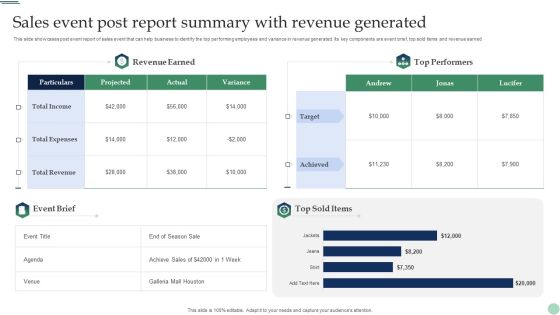
Sales Event Post Report Summary With Revenue Generated Portrait PDF
This slide showcases post event report of sales event that can help business to identify the top performing employees and variance in revenue generated. Its key components are event brief, top sold items and revenue earned. Showcasing this set of slides titled Sales Event Post Report Summary With Revenue Generated Portrait PDF. The topics addressed in these templates are Revenue Earned, Top Performers, Revenue Generated. All the content presented in this PPT design is completely editable. Download it and make adjustments in color, background, font etc. as per your unique business setting.

KPI Dashboard To Assess Facebook Business Marketing Approach Performance Portrait PDF
This slide covers KPI dashboard to assess Facebook marketing strategy performance. It involves details such as audience engagement, page engagement, page likes and post shares. Pitch your topic with ease and precision using this KPI Dashboard To Assess Facebook Business Marketing Approach Performance Portrait PDF. This layout presents information on Audience Engagement, Page Engagement, Post Comments. It is also available for immediate download and adjustment. So, changes can be made in the color, design, graphics or any other component to create a unique layout.

30 60 90 Days Sales And Promotion Planning Achievement Infographics PDF
The below slide depicts the assessment of sales and marketing plan execution to track the deviations. It includes the success rate of sales in previous three months and product wise projections for coming days. Showcasing this set of slides titled 30 60 90 Days Sales And Promotion Planning Achievement Infographics PDF. The topics addressed in these templates are 30 60 90 Days, Sales Promotion Planning, Achievement. All the content presented in this PPT design is completely editable. Download it and make adjustments in color, background, font etc. as per your unique business setting.

30 60 90 Days Sales And Promotion Planning With Performance Analysis Guidelines PDF
The following slide illustrates the step by step sales and marketing plan to attain the business objectives. It also includes the sales performance evaluation by target achieved in the past 30 60 90 days. Showcasing this set of slides titled 30 60 90 Days Sales And Promotion Planning With Performance Analysis Guidelines PDF. The topics addressed in these templates are 30 60 90 Days, Sales Promotion Planning, Performance Analysis. All the content presented in this PPT design is completely editable. Download it and make adjustments in color, background, font etc. as per your unique business setting.
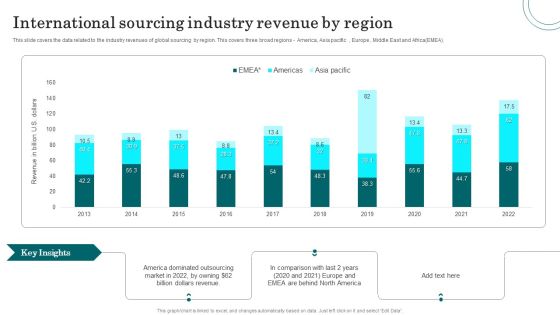
International Sourcing Industry Revenue By Region Information PDF
This slide covers the data related to the industry revenues of global sourcing by region. This covers three broad regions America, Asia pacific, Europe, Middle East and Africa EMEA. Showcasing this set of slides titled International Sourcing Industry Revenue By Region Information PDF. The topics addressed in these templates are Dollars Revenue, America Dominated Outsourcing Market, Industry Revenue. All the content presented in this PPT design is completely editable. Download it and make adjustments in color, background, font etc. as per your unique business setting.
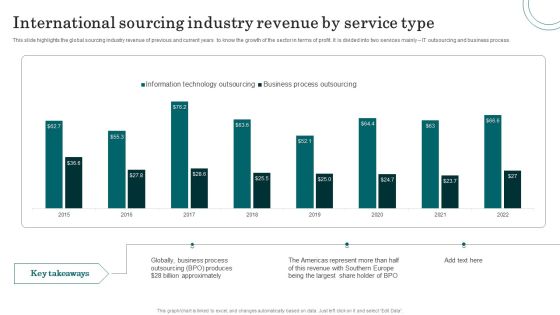
International Sourcing Industry Revenue By Service Type Mockup PDF
This slide highlights the global sourcing industry revenue of previous and current years to know the growth of the sector in terms of profit. It is divided into two services mainly IT outsourcing and business process. Pitch your topic with ease and precision using this International Sourcing Industry Revenue By Service Type Mockup PDF. This layout presents information on Business Process, Revenue, Share Holder. It is also available for immediate download and adjustment. So, changes can be made in the color, design, graphics or any other component to create a unique layout.

B2C Content Marketing Statistics Indicating Usage Of Techniques Sample PDF
This slide showcases business to consumer B2C content marketing figures highlighting usage of key strategies. It provides information about targeting, editorial calendar, promotion, website UI, social media, service development, etc. Pitch your topic with ease and precision using this B2C Content Marketing Statistics Indicating Usage Of Techniques Sample PDF. This layout presents information on Strategies, Marketers, Content Team. It is also available for immediate download and adjustment. So, changes can be made in the color, design, graphics or any other component to create a unique layout.

Quarterly Business Performance Assessment And Evaluation Of A Manufacturing Firm Inspiration PDF
This slide includes Quarterly Business Review of a company. It gives an account of sales of Product A, Product B, Product C and Product D, respectively with trend analysis of revenues generated. Showcasing this set of slides titled Quarterly Business Performance Assessment And Evaluation Of A Manufacturing Firm Inspiration PDF. The topics addressed in these templates are Quarterly Business Analysis, Product, Sales. All the content presented in this PPT design is completely editable. Download it and make adjustments in color, background, font etc. as per your unique business setting.

Cyber Protection Incident And Privacy Analysis With KPI Dashboard Ideas PDF
The following slide highlights some kpas of cyber security incidents to evaluate and monitor threats. It includes elements such as open incidents, warnings by severity, average response time, warnings pending for inspection etc. Showcasing this set of slides titled Cyber Protection Incident And Privacy Analysis With KPI Dashboard Ideas PDF. The topics addressed in these templates are Cyber Protection Incident, Privacy Analysis, KPI Dashboard. All the content presented in this PPT design is completely editable. Download it and make adjustments in color, background, font etc. as per your unique business setting.
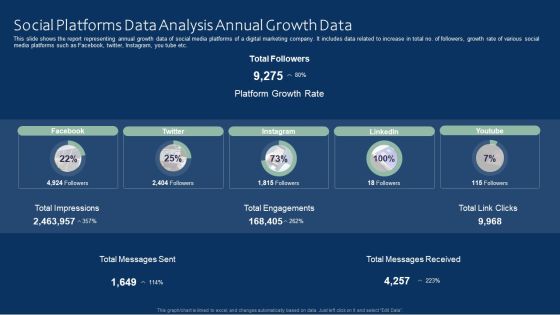
Social Platforms Data Analysis Annual Growth Data Ideas PDF
This slide shows the report representing annual growth data of social media platforms of a digital marketing company. It includes data related to increase in total no. of followers, growth rate of various social media platforms such as Facebook, twitter, Instagram, you tube etc. Pitch your topic with ease and precision using this Social Platforms Data Analysis Annual Growth Data Ideas PDF. This layout presents information on Social Platforms Data Analysis, Annual Growth Data. It is also available for immediate download and adjustment. So, changes can be made in the color, design, graphics or any other component to create a unique layout.

Customer Engagement Data Through Social Platforms Data Analysis Brochure PDF
This slide demonstrates the dashboard representing the user engagement related to campaign A organized by ABC company. It includes statistical data related to no. of reach, custom button clicks, no. of shares, post engagement rate, taps on website link by users etc. Showcasing this set of slides titled Customer Engagement Data Through Social Platforms Data Analysis Brochure PDF. The topics addressed in these templates are Customer Engagement Data, Social Platforms Data Analysis. All the content presented in this PPT design is completely editable. Download it and make adjustments in color, background, font etc. as per your unique business setting.
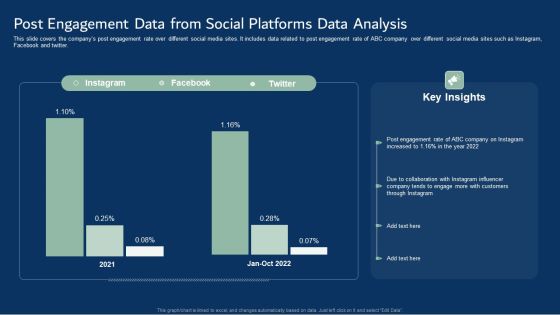
Post Engagement Data From Social Platforms Data Analysis Template PDF
This slide covers the companys post engagement rate over different social media sites. It includes data related to post engagement rate of ABC company over different social media sites such as Instagram, Facebook and twitter. Pitch your topic with ease and precision using this Post Engagement Data From Social Platforms Data Analysis Template PDF. This layout presents information on Post Engagement Data, Social Platforms Data Analysis. It is also available for immediate download and adjustment. So, changes can be made in the color, design, graphics or any other component to create a unique layout.
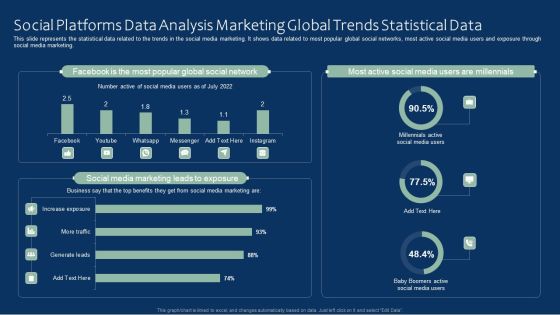
Social Platforms Data Analysis Marketing Global Trends Statistical Data Rules PDF
This slide represents the statistical data related to the trends in the social media marketing. It shows data related to most popular global social networks, most active social media users and exposure through social media marketing. Pitch your topic with ease and precision using this Social Platforms Data Analysis Marketing Global Trends Statistical Data Rules PDF. This layout presents information on Social Platforms Data Analysis, Marketing Global, Trends Statistical Data. It is also available for immediate download and adjustment. So, changes can be made in the color, design, graphics or any other component to create a unique layout.

Social Platforms Data Analysis Showcasing Social Media Content Types For Businesses Inspiration PDF
This slide demonstrates the statistical data showing the results of social media content for business. It includes details related to customer engagement through image posts, stories, videos, user-generated content etc. Showcasing this set of slides titled Social Platforms Data Analysis Showcasing Social Media Content Types For Businesses Inspiration PDF. The topics addressed in these templates are Content Types For Businesses, Showcasing Social Media, Social Platforms Data Analysis. All the content presented in this PPT design is completely editable. Download it and make adjustments in color, background, font etc. as per your unique business setting.

Social Platforms Data Analysis Usage By Digital Marketing Companies Data Clipart PDF
This slide represents statistical data related to use of various social media platforms by digital marketing company for customer engagement. It includes use of various social media platforms such as Instagram, facebook, twitter, you tube etc. for customer engagement. Pitch your topic with ease and precision using this Social Platforms Data Analysis Usage By Digital Marketing Companies Data Clipart PDF. This layout presents information on Social Platforms Data Analysis, Digital Marketing Companies Data. It is also available for immediate download and adjustment. So, changes can be made in the color, design, graphics or any other component to create a unique layout.
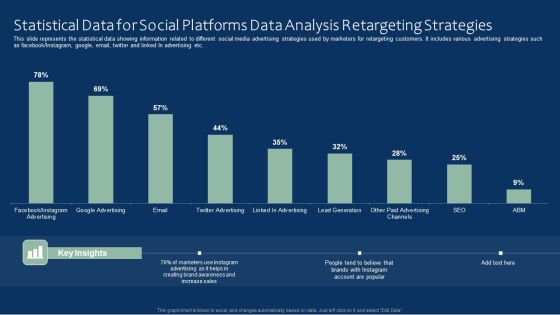
Statistical Data For Social Platforms Data Analysis Retargeting Strategies Inspiration PDF
This slide represents the statistical data showing information related to different social media advertising strategies used by marketers for retargeting customers. It includes various advertising strategies such as facebook or Instagram, google, email, twitter and linked In advertising etc. Showcasing this set of slides titled Statistical Data For Social Platforms Data Analysis Retargeting Strategies Inspiration PDF. The topics addressed in these templates are Social Platforms Data, Statistical Data, Analysis Retargeting Strategies. All the content presented in this PPT design is completely editable. Download it and make adjustments in color, background, font etc. as per your unique business setting.
Statistical Data On Social Platforms Data Analysis Services Offered By Marketing Agencies Icons PDF
This slide shows the statistics related to social media services provided by the marketing agencies to their clients. It includes various services such as content creation, social media monitoring, strategy building, campaign analysis etc. Pitch your topic with ease and precision using this Statistical Data On Social Platforms Data Analysis Services Offered By Marketing Agencies Icons PDF. This layout presents information on Statistical Data, Social Platforms Data, Analysis Services, Marketing Agencies. It is also available for immediate download and adjustment. So, changes can be made in the color, design, graphics or any other component to create a unique layout.

Usage Of Social Platforms Data Analysis For Marketers Information PDF
This slide represents the various uses of social media data analysis for marketers. It includes various uses of data analysis for marketers such as development of creative content, trend analysis, measure ROI, competitive insights etc. Showcasing this set of slides titled Usage Of Social Platforms Data Analysis For Marketers Information PDF. The topics addressed in these templates are Creative Content Development, Assess Campaign Performance, Build Communication. All the content presented in this PPT design is completely editable. Download it and make adjustments in color, background, font etc. as per your unique business setting.

Departmental Tracking Goals Progress Dashboard Diagrams PDF
This slide depicts a progress chart for maintaining transparency and alignment in tracking cross-functional goals. It also includes organizational objective details such as total on track objectives, recently updated, overall progress, etc. Showcasing this set of slides titled Departmental Tracking Goals Progress Dashboard Diagrams PDF. The topics addressed in these templates are Departmental Tracking Goals, Progress Dashboard . All the content presented in this PPT design is completely editable. Download it and make adjustments in color, background, font etc. as per your unique business setting.
Tracking Goals Achievement Status Dashboard Themes PDF
This slide showcases the objective status report, which helps track current the percentage of the targets achieved and left. It also includes the number of overdue targets and unachieved departmental goals. Pitch your topic with ease and precision using this Tracking Goals Achievement Status Dashboard Themes PDF. This layout presents information on Achieved Objectives, Unachieved Objectives, Overdue. It is also available for immediate download and adjustment. So, changes can be made in the color, design, graphics or any other component to create a unique layout.
Tracking Goals Alignment And Analytical Chart Slides PDF
This slide showcases a visual depiction of the organizations goals, overall progress, and goal alignment. It also includes enlisted objectives tracking details such as end date, assigner, progress, and performance rating. Showcasing this set of slides titled Tracking Goals Alignment And Analytical Chart Slides PDF. The topics addressed in these templates are Develop Process Improvement Plan, Increase Customer Retention Rate. All the content presented in this PPT design is completely editable. Download it and make adjustments in color, background, font etc. as per your unique business setting.
Tracking Goals Alignment KPI Dashboard Guidelines PDF
This slide showcases a tracking dashboard for determining the alignment and progress percentage of the assigned objectives. It also includes the objective evaluation KPIs such as active objectives, overall progress, total employees, objective as per employees, aligned, organizational and departmental objectives. Pitch your topic with ease and precision using this Tracking Goals Alignment KPI Dashboard Guidelines PDF. This layout presents information on Employee, Organizational Objectives, Departmental Objectives. It is also available for immediate download and adjustment. So, changes can be made in the color, design, graphics or any other component to create a unique layout.
Tracking Goals Dashboard With Progress Report Rules PDF
This slide showcases the progress report which helps to determine gaps in the objective achievement process and take corrective actions. It also includes objective details such as contributor, due date, and progress percentage. Showcasing this set of slides titled Tracking Goals Dashboard With Progress Report Rules PDF. The topics addressed in these templates are Immediate Action Required, Progress Update Required, Concise Goal Outcome Required. All the content presented in this PPT design is completely editable. Download it and make adjustments in color, background, font etc. as per your unique business setting.
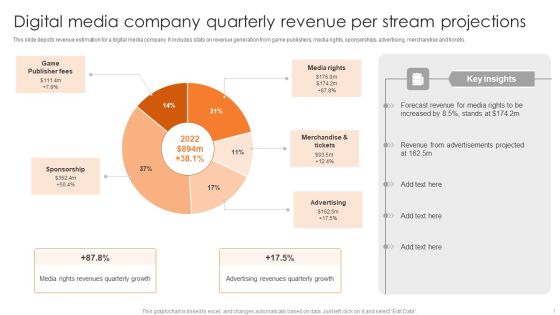
Digital Media Company Quarterly Revenue Per Stream Projections Elements PDF
This slide depicts revenue estimation for a digital media company. It includes stats on revenue generation from game publishers, media rights, sponsorships, advertising, merchandise and tickets. Pitch your topic with ease and precision using this Digital Media Company Quarterly Revenue Per Stream Projections Elements PDF. This layout presents information on Game Publisher Fees, Media Rights, Merchandise And Tickets. It is also available for immediate download and adjustment. So, changes can be made in the color, design, graphics or any other component to create a unique layout.
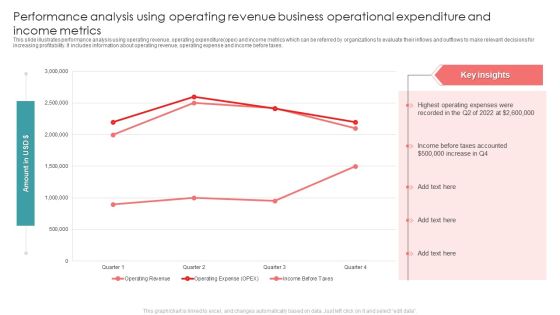
Performance Analysis Using Operating Revenue Business Operational Expenditure And Income Metrics Diagrams PDF
This slide illustrates performance analysis using operating revenue, operating expenditure opex and income metrics which can be referred by organizations to evaluate their inflows and outflows to make relevant decisions for increasing profitability. It includes information about operating revenue, operating expense and income before taxes. Pitch your topic with ease and precision using this Performance Analysis Using Operating Revenue Business Operational Expenditure And Income Metrics Diagrams PDF. This layout presents information on Taxes, Highest Operating, Recorded. It is also available for immediate download and adjustment. So, changes can be made in the color, design, graphics or any other component to create a unique layout.
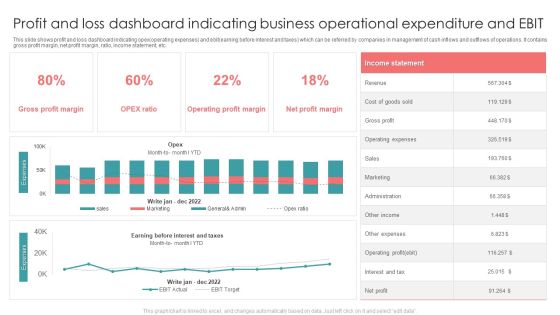
Profit And Loss Dashboard Indicating Business Operational Expenditure And EBIT Formats PDF
This slide shows profit and loss dashboard indicating opex operating expenses and ebit earning before interest and taxes which can be referred by companies in management of cash inflows and outflows of operations. It contains gross profit margin, net profit margin, ratio, income statement, etc. Showcasing this set of slides titled Profit And Loss Dashboard Indicating Business Operational Expenditure And EBIT Formats PDF. The topics addressed in these templates are Revenue, Gross Profit, Sales. All the content presented in this PPT design is completely editable. Download it and make adjustments in color, background, font etc. as per your unique business setting.

Impact Of Multichannel Marketing Program On Retail Business Brochure PDF
The purpose of this slide is to highlight key statistics associated with the impact of omnichannel retail. It provides information about customer retention, average profit margin per customer and customer lifetime value. Showcasing this set of slides titled Impact Of Multichannel Marketing Program On Retail Business Brochure PDF. The topics addressed in these templates are Customer Lifetime Value, Customer Retention, Average Profit Margin. All the content presented in this PPT design is completely editable. Download it and make adjustments in color, background, font etc. as per your unique business setting.

KPI Dashboard Highlighting Results Of Multichannel Retail Marketing Rules PDF
The purpose of this slide is to highlight a comprehensive dashboard of omnichannel retail. The key metrics covered in the slide are types of marketing channels, comparison of channels for two different years, transactions by months etc. Pitch your topic with ease and precision using this KPI Dashboard Highlighting Results Of Multichannel Retail Marketing Rules PDF. This layout presents information on Comparison Of Channel Sales, Percentage Of Sales, Transactions By Month. It is also available for immediate download and adjustment. So, changes can be made in the color, design, graphics or any other component to create a unique layout.
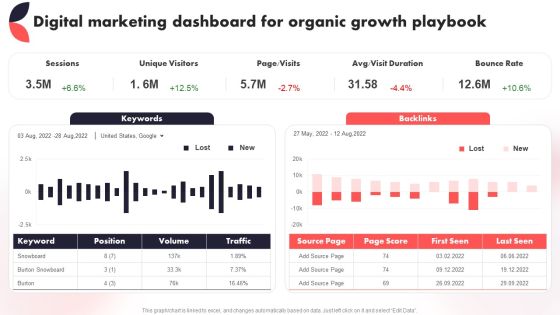
Digital Marketing Dashboard For Organic Growth Playbook Year Over Year Business Success Playbook Themes PDF
This Digital Marketing Dashboard For Organic Growth Playbook Year Over Year Business Success Playbook Themes PDF from Slidegeeks makes it easy to present information on your topic with precision. It provides customization options, so you can make changes to the colors, design, graphics, or any other component to create a unique layout. It is also available for immediate download, so you can begin using it right away. Slidegeeks has done good research to ensure that you have everything you need to make your presentation stand out. Make a name out there for a brilliant performance.

How Companies Excel With Organic Growth Year Over Year Business Success Playbook Guidelines PDF
Purpose of the following slide is to show the impact of organic growth over the organization, these KPIs can help in measuring the effectiveness of these strategies. These indicators can be repurchase rate, recommendation by customer, willingness to purchase product, etc.Find a pre-designed and impeccable How Companies Excel With Organic Growth Year Over Year Business Success Playbook Guidelines PDF. The templates can ace your presentation without additional effort. You can download these easy-to-edit presentation templates to make your presentation stand out from others. So, what are you waiting for Download the template from Slidegeeks today and give a unique touch to your presentation.

Contact Strategy Impact On Consumer Response Rate Ppt Icon Templates PDF
This slide covers positive customer insights on contact strategy. It enhances customer experience and increases the response and retention rates along with customer engagement. Pitch your topic with ease and precision using this Contact Strategy Impact On Consumer Response Rate Ppt Icon Templates PDF. This layout presents information on Customer Retention Rates, Quick Response Rate, Enhances Customer Experience. It is also available for immediate download and adjustment. So, changes can be made in the color, design, graphics or any other component to create a unique layout.

COVID Impact Analysis Based On Factors Of Advanced Economies Ppt Slides Example PDF
This slide covers positive and negative impact of COVID-19 on economies. It includes factor such as competition in network services, government response, collaboration between companies, venture capital availability, etc. Showcasing this set of slides titled COVID Impact Analysis Based On Factors Of Advanced Economies Ppt Slides Example PDF. The topics addressed in these templates are Advanced Economies, Network Services, Collaboration Between Companies. All the content presented in this PPT design is completely editable. Download it and make adjustments in color, background, font etc. as per your unique business setting.

COVID Impact Analysis On Business Outcomes Stats Ppt Layouts Introduction PDF
This slide depicts impact of corona virus on various issues faced by small, medium scale enterprises. It includes overview of disruptions such as employee absenteeism, supply chain, transportation, financial instability, profit reduction, decrease in sales, demand reduction, etc. Showcasing this set of slides titled COVID Impact Analysis On Business Outcomes Stats Ppt Layouts Introduction PDF. The topics addressed in these templates are Reduction Sales, Reduction Profit, Reduction Production. All the content presented in this PPT design is completely editable. Download it and make adjustments in color, background, font etc. as per your unique business setting.

COVID Impact Analysis On Food And Transportation Industry Ppt Infographic Template Diagrams PDF
This slide depicts impact of COVID-19 on multiple services of travel and tourism industry. It includes operations such as food services, lodging, air transportation, retail, recreation and amusement. Showcasing this set of slides titled COVID Impact Analysis On Food And Transportation Industry Ppt Infographic Template Diagrams PDF. The topics addressed in these templates are Food Services, Air Transportation Faced, Restrictions Travel Policy. All the content presented in this PPT design is completely editable. Download it and make adjustments in color, background, font etc. as per your unique business setting.

COVID Impact Analysis On Freight And Transportation Sector Ppt Outline Graphics Tutorials PDF
This slide covers impact of COVID-19 on freight, transportation equipment and travel industry. It includes impact on demand, insights on global GDP growth, impact on supply chain, supply bottlenecks, short-term pricing outlook, etc. Pitch your topic with ease and precision using this COVID Impact Analysis On Freight And Transportation Sector Ppt Outline Graphics Tutorials PDF. This layout presents information on Freight And Logistics, Transportation Equipment, Deflationary. It is also available for immediate download and adjustment. So, changes can be made in the color, design, graphics or any other component to create a unique layout.
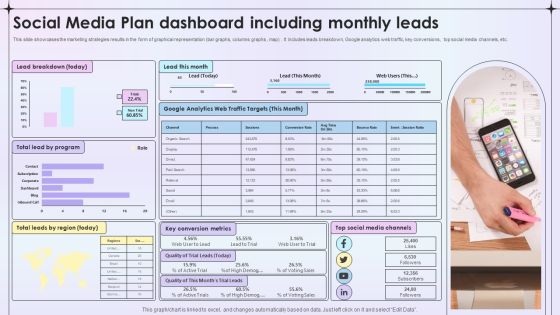
Social Media Plan Dashboard Including Monthly Leads Ppt File Slides PDF
This slide showcases the marketing strategies results in the form of graphical representation bar graphs, columns graphs , map. It includes leads breakdown, Google analytics web traffic, key conversions , top social media channels, etc. Showcasing this set of slides titled Social Media Plan Dashboard Including Monthly Leads Ppt File Slides PDF. The topics addressed in these templates are Lead Breakdown, Key Conversion Metrics, Social Media Channels. All the content presented in this PPT design is completely editable. Download it and make adjustments in color, background, font etc. as per your unique business setting.
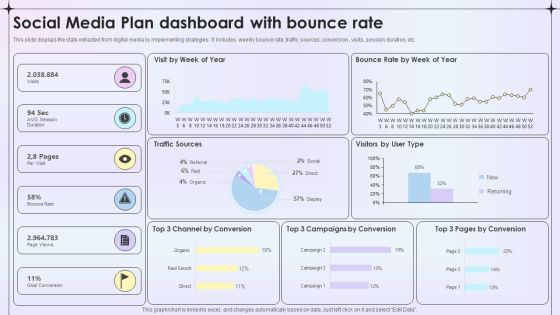
Social Media Plan Dashboard With Bounce Rate Ppt Ideas Graphics Template PDF
This slide displays the stats extracted from digital media by implementing strategies . It includes weekly bounce rate, traffic sources, conversion , visits, session duration, etc. Pitch your topic with ease and precision using this Social Media Plan Dashboard With Bounce Rate Ppt Ideas Graphics Template PDF. This layout presents information on Traffic Sources, Visitors User Type, Goal Conversion. It is also available for immediate download and adjustment. So, changes can be made in the color, design, graphics or any other component to create a unique layout.

KPI Dashboard To Measure Talent Performance Slides PDF
This slide represents dashboard to measure talent performance in organization. It includes talent applicant status, team training methods, talented candidate status, risk for loss of potential talent pool etc. Get a simple yet stunning designed KPI Dashboard To Measure Talent Performance Slides PDF. It is the best one to establish the tone in your meetings. It is an excellent way to make your presentations highly effective. So, download this PPT today from Slidegeeks and see the positive impacts. Our easy to edit KPI Dashboard To Measure Talent Performance Slides PDF can be your go-to option for all upcoming conferences and meetings. So, what are you waiting for Grab this template today.
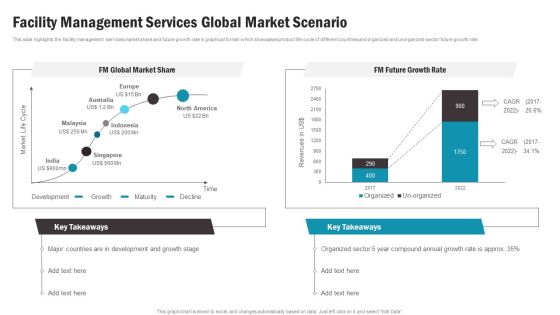
Facility Management Services Global Market Scenario Topics PDF
This slide highlights the facility management services market share and future growth rate in graphical format which showcases product life cycle of different countries and organized and unorganized sector future growth rate. This Facility Management Services Global Market Scenario Topics PDF is perfect for any presentation, be it in front of clients or colleagues. It is a versatile and stylish solution for organizing your meetings. The product features a modern design for your presentation meetings. The adjustable and customizable slides provide unlimited possibilities for acing up your presentation. Slidegeeks has done all the homework before launching the product for you. So, do not wait, grab the presentation templates today.
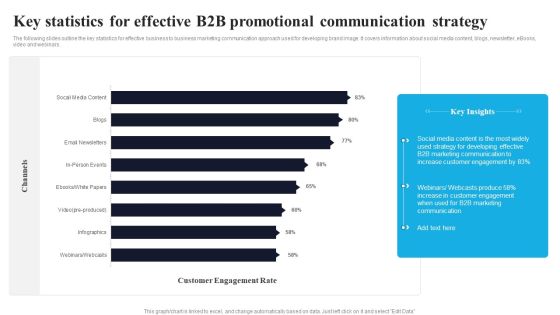
Key Statistics For Effective B2B Promotional Communication Strategy Information PDF
The following slides outline the key statistics for effective business to business marketing communication approach used for developing brand image. It covers information about social media content, blogs, newsletter, eBooks, video and webinars. Showcasing this set of slides titled Key Statistics For Effective B2B Promotional Communication Strategy Information PDF. The topics addressed in these templates are Customer Engagement Rate, Social Media Content, Customer Engagement. All the content presented in this PPT design is completely editable. Download it and make adjustments in color, background, font etc. as per your unique business setting.

KPI Dashboard To Measure Performance Of B2B Promotional Communication Strategy Mockup PDF
The following slides outline the key performance indicator dashboard to track performance of B2B marketing communication approach. It covers information about pipeline deals, revenue by campaign, email engagement and landing page completion. Pitch your topic with ease and precision using this KPI Dashboard To Measure Performance Of B2B Promotional Communication Strategy Mockup PDF. This layout presents information on Pipeline Deals, Engagement Health, Email Engagement. It is also available for immediate download and adjustment. So, changes can be made in the color, design, graphics or any other component to create a unique layout.

KPI Dashboard To Manage Various Risks In Project Administration Sample PDF
This slide signifies the key performance indicator dashboard to manage various threats in company project. It covers information about corporate risk, control performance, open issues and map. Showcasing this set of slides titled KPI Dashboard To Manage Various Risks In Project Administration Sample PDF. The topics addressed in these templates are Control Performance, Open Issues, Corporate Risk. All the content presented in this PPT design is completely editable. Download it and make adjustments in color, background, font etc. as per your unique business setting.
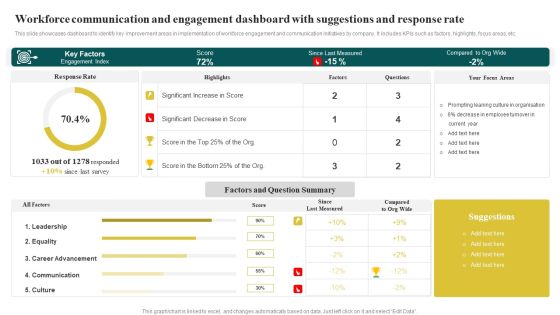
Workforce Communication And Engagement Dashboard With Suggestions And Response Rate Microsoft PDF
This slide showcases dashboard to identify key improvement areas in implementation of workforce engagement and communication initiatives by company. It includes KPIs such as factors, highlights, focus areas, etc. Pitch your topic with ease and precision using this Workforce Communication And Engagement Dashboard With Suggestions And Response Rate Microsoft PDF. This layout presents information on Key Factors, Since Last Measured, Factors And Que. It is also available for immediate download and adjustment. So, changes can be made in the color, design, graphics or any other component to create a unique layout.
Workforce Engagement And Communication Dashboard With Net Promoter Score Icons PDF
The following slide displays KPI dashboard to keep track of workforce engagement and communication at workplace to help company increase employee productivity. It includes elements such as monthly score, passive, promoters, detractors, etc. Showcasing this set of slides titled Workforce Engagement And Communication Dashboard With Net Promoter Score Icons PDF. The topics addressed in these templates are Participation Rate, Engagement Score, Overall Score. All the content presented in this PPT design is completely editable. Download it and make adjustments in color, background, font etc. as per your unique business setting.
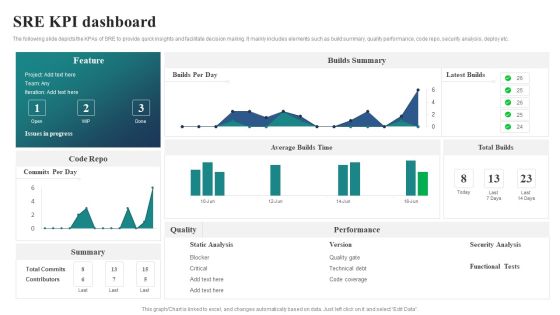
SRE KPI Dashboard Ppt PowerPoint Presentation File Slide Portrait PDF
The following slide depicts the KPAs of SRE to provide quick insights and facilitate decision making. It mainly includes elements such as build summary, quality performance, code repo, security analysis, deploy etc. Showcasing this set of slides titled SRE KPI Dashboard Ppt PowerPoint Presentation File Slide Portrait PDF. The topics addressed in these templates are Builds Summary, Latest Builds, Total Builds. All the content presented in this PPT design is completely editable. Download it and make adjustments in color, background, font etc. as per your unique business setting.
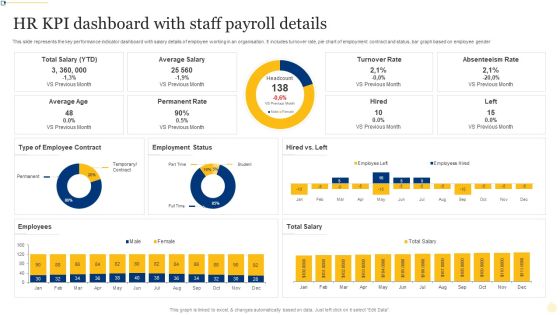
HR KPI Dashboard With Staff Payroll Details Ppt PowerPoint Presentation File Layout Ideas PDF
This slide represents the key performance indicator dashboard with salary details of employee working in an organisation. It includes turnover rate, pie chart of employment contract and status, bar graph based on employee gender. Showcasing this set of slides titled HR KPI Dashboard With Staff Payroll Details Ppt PowerPoint Presentation File Layout Ideas PDF. The topics addressed in these templates are Turnover Rate, Absenteeism Rate, Permanent Rate. All the content presented in this PPT design is completely editable. Download it and make adjustments in color, background, font etc. as per your unique business setting.
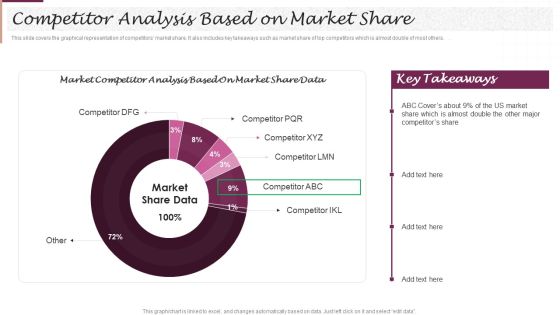
New Market Segment Entry Plan Competitor Analysis Based On Market Share Demonstration PDF
This slide covers the graphical representation of competitors market share. It also includes key takeaways such as market share of top competitors which is almost double of most others. . If your project calls for a presentation, then Slidegeeks is your go-to partner because we have professionally designed, easy-to-edit templates that are perfect for any presentation. After downloading, you can easily edit New Market Segment Entry Plan Competitor Analysis Based On Market Share Demonstration PDF and make the changes accordingly. You can rearrange slides or fill them with different images. Check out all the handy templates.
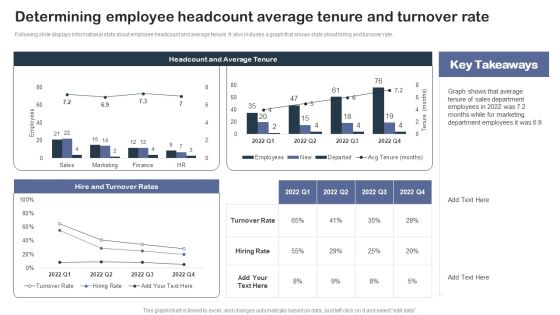
Staff Succession Planning And Development Determining Employee Headcount Average Elements PDF
Following slide displays informational stats about employee headcount and average tenure. It also includes a graph that shows stats about hiring and turnover rate.Get a simple yet stunning designed Staff Succession Planning And Development Determining Employee Headcount Average Elements PDF. It is the best one to establish the tone in your meetings. It is an excellent way to make your presentations highly effective. So, download this PPT today from Slidegeeks and see the positive impacts. Our easy-to-edit Staff Succession Planning And Development Determining Employee Headcount Average Elements PDF can be your go-to option for all upcoming conferences and meetings. So, what are you waiting for Grab this template today.
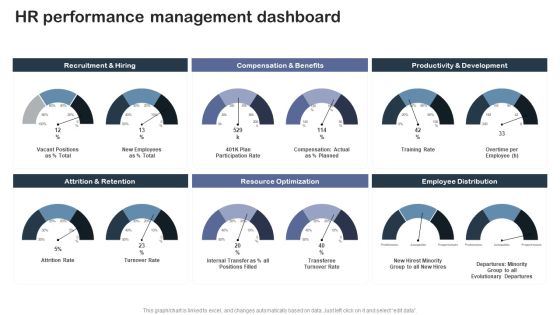
Staff Succession Planning And Development Hr Performance Management Dashboard Structure PDF
Do you have an important presentation coming up Are you looking for something that will make your presentation stand out from the rest Look no further than Staff Succession Planning And Development Hr Performance Management Dashboard Structure PDF. With our professional designs, you can trust that your presentation will pop and make delivering it a smooth process. And with Slidegeeks, you can trust that your presentation will be unique and memorable. So why wait Grab Staff Succession Planning And Development Hr Performance Management Dashboard Structure PDF today and make your presentation stand out from the rest.

Addressing 5G Spectrum Network Coverage Hotspots Urban Rural Inspiration PDF
This slide provides details regarding 5G spectrum network coverage including hotspots, urban coverage and rural coverage. Create an editable Addressing 5G Spectrum Network Coverage Hotspots Urban Rural Inspiration PDF that communicates your idea and engages your audience. Whether you are presenting a business or an educational presentation, pre designed presentation templates help save time. Addressing 5G Spectrum Network Coverage Hotspots Urban Rural Inspiration PDF is highly customizable and very easy to edit, covering many different styles from creative to business presentations. Slidegeeks has creative team members who have crafted amazing templates. So, go and get them without any delay.

5G Technology Development For Digital Transformation 5G Emerging As Network Of Opportunity Portrait PDF
This slide provides details regarding 5G as next generation mobile technology and emerging as network of opportunity catering various need of users, telecom operators, etc. Find a pre designed and impeccable 5G Technology Development For Digital Transformation 5G Emerging As Network Of Opportunity Portrait PDF. The templates can ace your presentation without additional effort. You can download these easy to edit presentation templates to make your presentation stand out from others. So, what are you waiting for Download the template from Slidegeeks today and give a unique touch to your presentation.

5G Technology Development For Digital Transformation Determine Competitive Landscape Of 5G Clipart PDF
Create an editable 5G Technology Development For Digital Transformation Determine Competitive Landscape Of 5G Clipart PDF that communicates your idea and engages your audience. Whether you are presenting a business or an educational presentation, pre designed presentation templates help save time. 5G Technology Development For Digital Transformation Determine Competitive Landscape Of 5G Clipart PDF is highly customizable and very easy to edit, covering many different styles from creative to business presentations. Slidegeeks has creative team members who have crafted amazing templates. So, go and get them without any delay.

Benefits Of Enterprise Risk Management Experienced By Organizations Pictures PDF
This slide represents the ways in which enterprise risk management helps organizations to improve decision quality, reduce business liability and frame regulatory issues. It includes details related to results of survey conducted to analyze benefits of ERM experienced by various organizations. Find a pre designed and impeccable Benefits Of Enterprise Risk Management Experienced By Organizations Pictures PDF. The templates can ace your presentation without additional effort. You can download these easy to edit presentation templates to make your presentation stand out from others. So, what are you waiting for Download the template from Slidegeeks today and give a unique touch to your presentation.
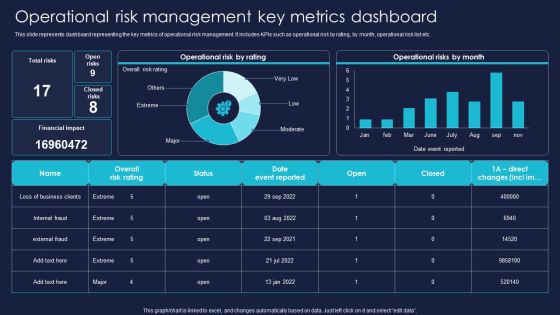
Operational Risk Management Key Metrics Dashboard Professional PDF
This slide represents dashboard representing the key metrics of operational risk management. It includes KPIs such as operational risk by rating, by month, operational risk list etc. Get a simple yet stunning designed Operational Risk Management Key Metrics Dashboard Professional PDF. It is the best one to establish the tone in your meetings. It is an excellent way to make your presentations highly effective. So, download this PPT today from Slidegeeks and see the positive impacts. Our easy to edit Operational Risk Management Key Metrics Dashboard Professional PDF can be your go-to option for all upcoming conferences and meetings. So, what are you waiting for Grab this template today.
Global Automotive Industry Analysis Global Automotive Production Industry Revenue Icons PDF
This slide covers a graphical representation of worldwide automobile manufacturing industry revenue. It also includes key insights into disruptions of global manufacturing, supply chain, consumer spending, etc. This Global Automotive Industry Analysis Global Automotive Production Industry Revenue Icons PDF is perfect for any presentation, be it in front of clients or colleagues. It is a versatile and stylish solution for organizing your meetings. The product features a modern design for your presentation meetings. The adjustable and customizable slides provide unlimited possibilities for acing up your presentation. Slidegeeks has done all the homework before launching the product for you. So, do not wait, grab the presentation templates today.

Global Automotive Industry Analysis Global Sales Of Major Automakers And Groups Pictures PDF
This slide covers a graphical representation of worldwide automobile manufacturing industry revenue. It also includes key insights into disruptions of global manufacturing, supply chain, consumer spending, etc. The Global Automotive Industry Analysis Global Sales Of Major Automakers And Groups Pictures PDF is a compilation of the most recent design trends as a series of slides. It is suitable for any subject or industry presentation, containing attractive visuals and photo spots for businesses to clearly express their messages. This template contains a variety of slides for the user to input data, such as structures to contrast two elements, bullet points, and slides for written information. Slidegeeks is prepared to create an impression.

Client Success Org Structure Health Scorecard Background PDF
This slide showcases customer success organization service analysis by assessing various health parameters to ensure client satisfaction. It includes KPIs such as deployment, engagement, adoption, ROI, sentiment, NPS, etc. Showcasing this set of slides titled Client Success Org Structure Health Scorecard Background PDF. The topics addressed in these templates are Overall Score, Key Insights, Outcomes Health . All the content presented in this PPT design is completely editable. Download it and make adjustments in color, background, font etc. as per your unique business setting.

KPI Dashboard To Track Process Products Sold By Insurance Topics PDF
This slide shows dashboard which can be used to compare insurance sales of current and previous year. It includes metrics such as monthly policy status, quarterly premium revenue, overall policy status, etc. Pitch your topic with ease and precision using this KPI Dashboard To Track Process Products Sold By Insurance Topics PDF. This layout presents information on Overall Policy Status, Quarterly Premium Revenue, Monthly Policy Status. It is also available for immediate download and adjustment. So, changes can be made in the color, design, graphics or any other component to create a unique layout.
Stock Performance Dashboard For Metrics Team Management Ppt Outline Icons PDF
This slide represents the dashboard for tracking the management team member, manager, and teams ability to ensure inventory accuracy over time. It includes KPIs such as inventory, average result area scores and result areas. Pitch your topic with ease and precision using this Stock Performance Dashboard For Metrics Team Management Ppt Outline Icons PDF. This layout presents information on Result areas, Metrics Team, Needs Help. It is also available for immediate download and adjustment. So, changes can be made in the color, design, graphics or any other component to create a unique layout.

KPI Dashboard Of Technical Customer Support Service Ppt Layouts Professional PDF
This slide covers KPI dashboard of technical customer support service. It involves KPIs such as overdue tickets, problem types, tickets by customer types and detail about technical support engineers. Showcasing this set of slides titled KPI Dashboard Of Technical Customer Support Service Ppt Layouts Professional PDF. The topics addressed in these templates are Overdue Tickets, Problems Types, Technical Support Engineers. All the content presented in this PPT design is completely editable. Download it and make adjustments in color, background, font etc. as per your unique business setting.

Human Capital Metrics With Employee Turnover Rate Ppt File Mockup PDF
This graph or chart is linked to excel, and changes automatically based on data. Just left click on it and select Edit Data. Showcasing this set of slides titled Human Capital Metrics With Employee Turnover Rate Ppt File Mockup PDF. The topics addressed in these templates are Employee Turnover Rate, Turnover Rate Division, Turnover Rate Year, Over Year. All the content presented in this PPT design is completely editable. Download it and make adjustments in color, background, font etc. as per your unique business setting.
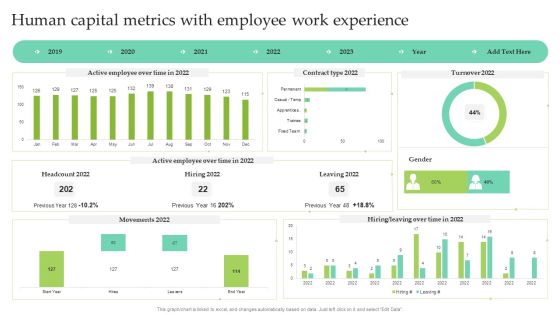
Human Capital Metrics With Employee Work Experience Ppt Show Images PDF
This graph or chart is linked to excel, and changes automatically based on data. Just left click on it and select Edit Data. Pitch your topic with ease and precision using this Human Capital Metrics With Employee Work Experience Ppt Show Images PDF. This layout presents information on Active Employee, Over Time, Contract Type 2022, Leaving 2022. It is also available for immediate download and adjustment. So, changes can be made in the color, design, graphics or any other component to create a unique layout.
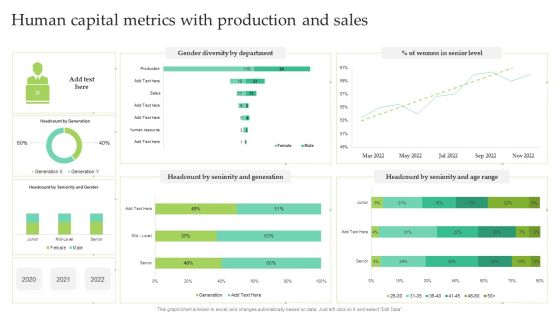
Human Capital Metrics With Production And Sales Ppt Infographic Template Summary PDF
This graph or chart is linked to excel, and changes automatically based on data. Just left click on it and select Edit Data. Showcasing this set of slides titled Human Capital Metrics With Production And Sales Ppt Infographic Template Summary PDF. The topics addressed in these templates are Women Senior Level, Gender Diversity Department, Seniority And Generation. All the content presented in this PPT design is completely editable. Download it and make adjustments in color, background, font etc. as per your unique business setting.
Retail Assortment Dashboard Depicting Store Performance Ppt Icon Structure PDF
This slide shows product assortment dashboard depicting store performance which can benefit managers in reviewing the current situation of outlets and make decisions according to reached benchmarks. It includes details about achieved sales, rate of conversion, weekday vs. Weekend sales, daily trend, etc. Showcasing this set of slides titled Retail Assortment Dashboard Depicting Store Performance Ppt Icon Structure PDF. The topics addressed in these templates are Achieved Sales, Rate Of Conversion, Daily Trend, Outlet Sales. All the content presented in this PPT design is completely editable. Download it and make adjustments in color, background, font etc. as per your unique business setting.

Centralized Repository Data Lake Reporting Dashboard Icons PDF
This slide represents the data lake reporting dashboard by covering the total number of users, total lake size, trusted zone size, conversion rate, and retention. Find a pre designed and impeccable Centralized Repository Data Lake Reporting Dashboard Icons PDF. The templates can ace your presentation without additional effort. You can download these easy to edit presentation templates to make your presentation stand out from others. So, what are you waiting for Download the template from Slidegeeks today and give a unique touch to your presentation.
Performance Tracking Dashboard For SDLC Phases Of Software Development Procedure Demonstration PDF
This slide represents the requirement gathering and analysis phase of the software development life cycle, including the steps taken in this stage, such as collecting needed information about the product to be made.This Performance Tracking Dashboard For SDLC Phases Of Software Development Procedure Demonstration PDF is perfect for any presentation, be it in front of clients or colleagues. It is a versatile and stylish solution for organizing your meetings. The product features a modern design for your presentation meetings. The adjustable and customizable slides provide unlimited possibilities for acing up your presentation. Slidegeeks has done all the homework before launching the product for you. So, do not wait, grab the presentation templates today.

Strategy 5 Value Based Pricing Pricing Strategies For New Product In Market Ideas PDF
This template covers the fifth strategy for value-based pricing along with the advantages and disadvantages of choosing this strategy.The Strategy 5 Value Based Pricing Pricing Strategies For New Product In Market Ideas PDF is a compilation of the most recent design trends as a series of slides. It is suitable for any subject or industry presentation, containing attractive visuals and photo spots for businesses to clearly express their messages. This template contains a variety of slides for the user to input data, such as structures to contrast two elements, bullet points, and slides for written information. Slidegeeks is prepared to create an impression.

Why Did Customers Leave Our Company Pricing Strategies For New Product In Market Professional PDF
This template covers the reasons involved why customers left the company such as price, customer service, quality, functionality, convenience, needs to be changed, etc.This Why Did Customers Leave Our Company Pricing Strategies For New Product In Market Professional PDF is perfect for any presentation, be it in front of clients or colleagues. It is a versatile and stylish solution for organizing your meetings. The product features a modern design for your presentation meetings. The adjustable and customizable slides provide unlimited possibilities for acing up your presentation. Slidegeeks has done all the homework before launching the product for you. So, do not wait, grab the presentation templates today.
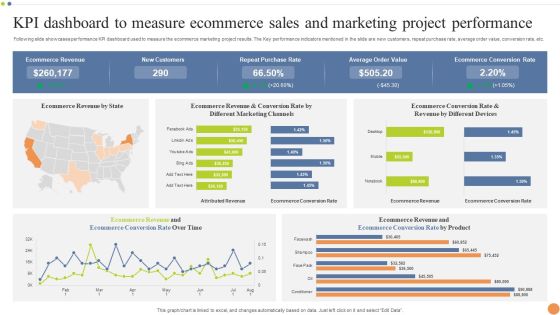
KPI Dashboard To Measure Ecommerce Sales And Marketing Project Performance Portrait PDF
Following slide showcases performance KPI dashboard used to measure the ecommerce marketing project results. The Key performance indicators mentioned in the slide are new customers, repeat purchase rate, average order value, conversion rate, etc. Pitch your topic with ease and precision using this KPI Dashboard To Measure Ecommerce Sales And Marketing Project Performance Portrait PDF. This layout presents information on Purchase Rate, Average Order Value, Ecommerce Conversion Rate. It is also available for immediate download and adjustment. So, changes can be made in the color, design, graphics or any other component to create a unique layout.
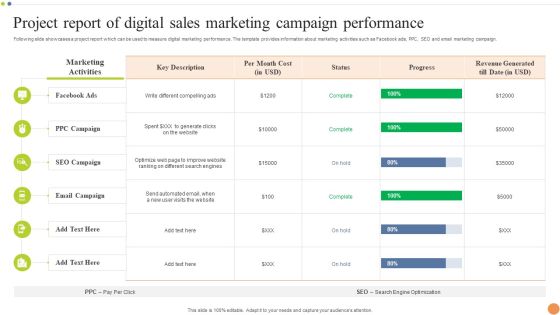
Project Report Of Digital Sales Marketing Campaign Performance Professional PDF
Following slide showcases a project report which can be used to measure digital marketing performance. The template provides information about marketing activities such as Facebook ads, PPC, SEO and email marketing campaign. Pitch your topic with ease and precision using this Project Report Of Digital Sales Marketing Campaign Performance Professional PDF. This layout presents information on Email Campaign, SEO Campaign, Marketing Activities. It is also available for immediate download and adjustment. So, changes can be made in the color, design, graphics or any other component to create a unique layout.
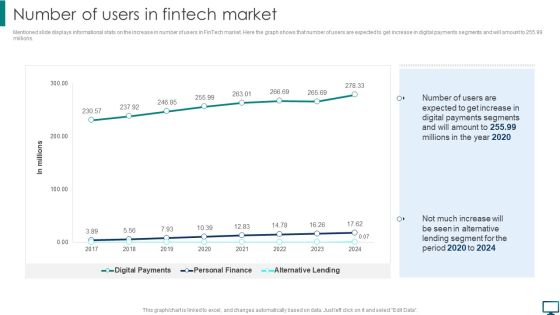
Optimizing Advanced Technology To Gain Competitive Edge Number Of Users In Fintech Market Elements PDF
Mentioned slide displays informational stats on the increase in number of users in FinTech market. Here the graph shows that number of users are expected to get increase in digital payments segments and will amount to 255.99 millions. Find a pre designed and impeccable Optimizing Advanced Technology To Gain Competitive Edge Number Of Users In Fintech Market Elements PDF. The templates can ace your presentation without additional effort. You can download these easy to edit presentation templates to make your presentation stand out from others. So, what are you waiting for Download the template from Slidegeeks today and give a unique touch to your presentation.
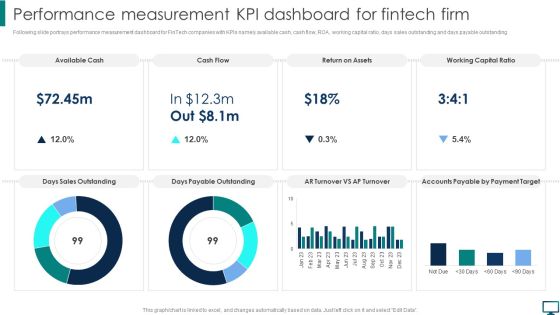
Performance Measurement KPI Dashboard For Fintech Firm Topics PDF
Following slide portrays performance measurement dashboard for FinTech companies with KPIs namely available cash, cash flow, ROA, working capital ratio, days sales outstanding and days payable outstanding. Create an editable Performance Measurement KPI Dashboard For Fintech Firm Topics PDF that communicates your idea and engages your audience. Whether you are presenting a business or an educational presentation, pre designed presentation templates help save time. Performance Measurement KPI Dashboard For Fintech Firm Topics PDF is highly customizable and very easy to edit, covering many different styles from creative to business presentations. Slidegeeks has creative team members who have crafted amazing templates. So, go and get them without any delay.
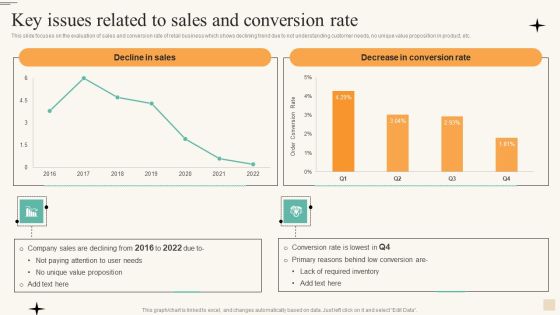
Retail Merchandise Management To Improve Buyer Engagement Key Issues Related Download PDF
This slide focuses on the evaluation of sales and conversion rate of retail business which shows declining trend due to not understanding customer needs, no unique value proposition in product, etc. This Retail Merchandise Management To Improve Buyer Engagement Key Issues Related Download PDF is perfect for any presentation, be it in front of clients or colleagues. It is a versatile and stylish solution for organizing your meetings. The product features a modern design for your presentation meetings. The adjustable and customizable slides provide unlimited possibilities for acing up your presentation. Slidegeeks has done all the homework before launching the product for you. So, do not wait, grab the presentation templates today.
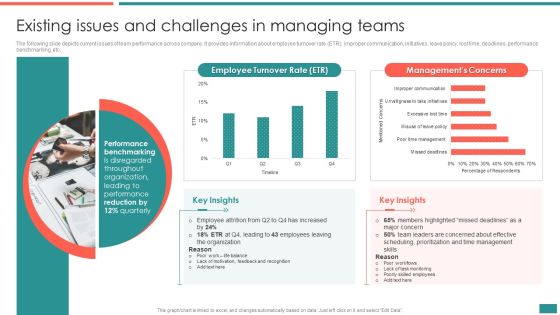
Existing Issues And Challenges In Managing Teams Building Efficient Workplace Performance Information PDF
The following slide depicts current issues of team performance across company. It provides information about employee turnover rate ETR, improper communication, initiatives, leave policy, lost time, deadlines, performance benchmarking, etc.Find a pre-designed and impeccable Existing Issues And Challenges In Managing Teams Building Efficient Workplace Performance Information PDF. The templates can ace your presentation without additional effort. You can download these easy-to-edit presentation templates to make your presentation stand out from others. So, what are you waiting for Download the template from Slidegeeks today and give a unique touch to your presentation.
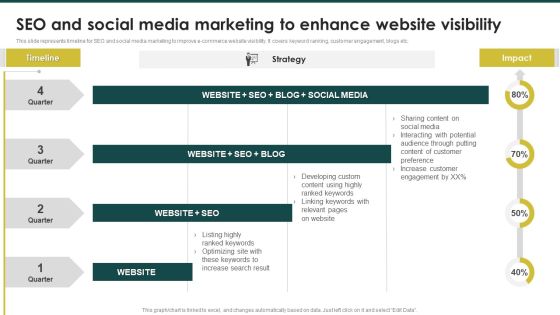
SEO And Social Media Marketing To Enhance Website Visibility Ecommerce Marketing Plan To Enhance Demonstration PDF
Retrieve professionally designed SEO And Social Media Marketing To Enhance Website Visibility Ecommerce Marketing Plan To Enhance Demonstration PDF to effectively convey your message and captivate your listeners. Save time by selecting pre-made slideshows that are appropriate for various topics, from business to educational purposes. These themes come in many different styles, from creative to corporate, and all of them are easily adjustable and can be edited quickly. Access them as PowerPoint templates or as Google Slides themes. You do not have to go on a hunt for the perfect presentation because Slidegeeks got you covered from everywhere.

Common Limitations Related To Stakeholders Management Strengthen Manage Relationships Professional PDF
This slide covers the problems with stakeholders Management plan due to which project fails such as poor communication, lack of stakeholders interest or lack of stakeholders control over project. The Common Limitations Related To Stakeholders Management Strengthen Manage Relationships Professional PDF is a compilation of the most recent design trends as a series of slides. It is suitable for any subject or industry presentation, containing attractive visuals and photo spots for businesses to clearly express their messages. This template contains a variety of slides for the user to input data, such as structures to contrast two elements, bullet points, and slides for written information. Slidegeeks is prepared to create an impression.
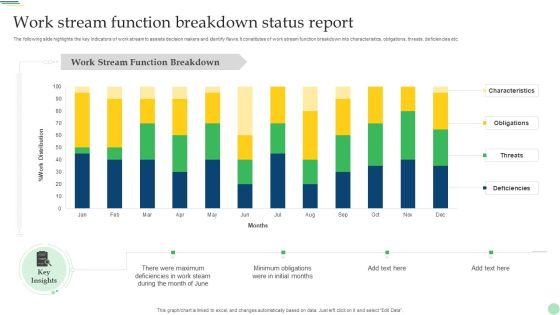
Work Stream Function Breakdown Status Report Demonstration PDF
The following slide highlights the key indicators of work stream to assists decision makers and identify flaws. It constitutes of work stream function breakdown into characteristics, obligations, threats, deficiencies etc. Pitch your topic with ease and precision using this Work Stream Function Breakdown Status Report Demonstration PDF. This layout presents information on Characteristics, Obligations, Threats, Deficiencies. It is also available for immediate download and adjustment. So, changes can be made in the color, design, graphics or any other component to create a unique layout.

Consumer Data Augmentation With Salesforce Dashboard Ppt Pictures Portrait PDF
The following slide displays a dashboard of customer data enrichment with the sales force. It contains information about promoter score, customer loyalty, top performer agents, customer satisfaction, and agent performance. Showcasing this set of slides titled Consumer Data Augmentation With Salesforce Dashboard Ppt Pictures Portrait PDF. The topics addressed in these templates are Promoter Score, Customer Loyalty, Top Performing Agents. All the content presented in this PPT design is completely editable. Download it and make adjustments in color, background, font etc. as per your unique business setting.

Data Augmentation Dashboard For Lead Generation Ppt Pictures Deck PDF
This slide illustrates a data enrichment dashboard that helps shorten the customer journey for lead generation. It also includes KPIs such as leads enriched against target, lead stage, user, and lead created by user. Showcasing this set of slides titled Data Augmentation Dashboard For Lead Generation Ppt Pictures Deck PDF. The topics addressed in these templates are Leads Enriched against, Target, Leads Enriched, Lead Stage, Leads Created User, Leads Enriched User. All the content presented in this PPT design is completely editable. Download it and make adjustments in color, background, font etc. as per your unique business setting.

Retail Store Data Map Dashboard Ppt PowerPoint Presentation Gallery Display PDF
This slide shows retail store data inventory dashboard. It provides information such as units sold, on hand, stock availability, top selling items, average inventory value by product category, etc. Pitch your topic with ease and precision using this Retail Store Data Map Dashboard Ppt PowerPoint Presentation Gallery Display PDF. This layout presents information on Inventory Turn, Over Ratio, Gross Margin ROI. It is also available for immediate download and adjustment. So, changes can be made in the color, design, graphics or any other component to create a unique layout.
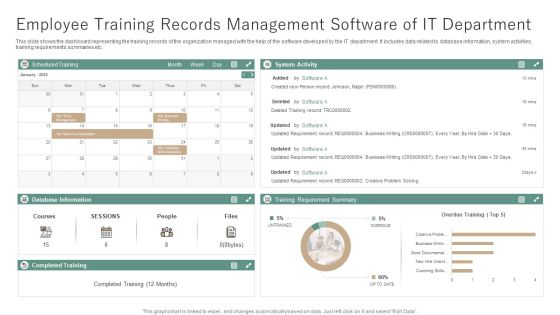
Employee Training Records Management Software Of IT Department Ppt File Layout PDF
This slide shows the dashboard representing the training records of the organization managed with the help of the software developed by the IT department. It includes data related to database information, system activities, training requirements summaries etc. Showcasing this set of slides titled Employee Training Records Management Software Of IT Department Ppt File Layout PDF. The topics addressed in these templates are Scheduled Training, Database Information, Completed Training. All the content presented in this PPT design is completely editable. Download it and make adjustments in color, background, font etc. as per your unique business setting.

Managing Cyber Security Incident Response KPI Dashboard Ppt Layouts Shapes PDF
This slide covers cyber security incident response KPI dashboard. It involves details such as intent alarm, event trend sources, event trend, sensor activity, major operating systems and asset information. Pitch your topic with ease and precision using this Managing Cyber Security Incident Response KPI Dashboard Ppt Layouts Shapes PDF. This layout presents information on Top Alarms Method, Alarms Intent, Timely Event Trend. It is also available for immediate download and adjustment. So, changes can be made in the color, design, graphics or any other component to create a unique layout.
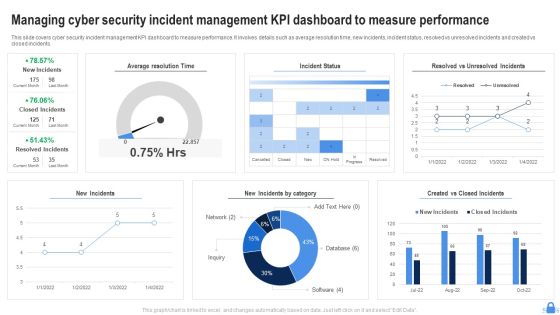
Managing Cyber Security Incident Management KPI Dashboard To Measure Performance Download PDF
This slide covers cyber security incident management KPI dashboard to measure performance. It involves details such as average resolution time, new incidents, incident status, resolved vs unresolved incidents and created vs closed incidents. Showcasing this set of slides titled Managing Cyber Security Incident Management KPI Dashboard To Measure Performance Download PDF. The topics addressed in these templates are Average Resolution Time, Incident Status, New Incidents. All the content presented in this PPT design is completely editable. Download it and make adjustments in color, background, font etc. as per your unique business setting.
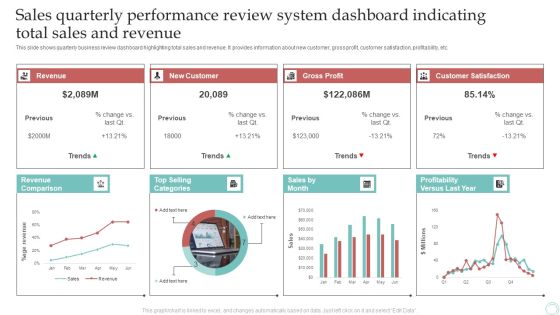
Sales Quarterly Performance Review System Dashboard Indicating Total Sales And Revenue Download PDF
This slide shows quarterly business review dashboard highlighting total sales and revenue. It provides information about new customer, gross profit, customer satisfaction, profitability, etc. Pitch your topic with ease and precision using this Sales Quarterly Performance Review System Dashboard Indicating Total Sales And Revenue Download PDF. This layout presents information on Revenue, New Customer, Gross Profit. It is also available for immediate download and adjustment. So, changes can be made in the color, design, graphics or any other component to create a unique layout.

Business Threats Landscape Dashboard For Cyber Security Program Management Ppt Gallery Images PDF
This slide shows risk landscape dashboard for cyber security program management which contains threat level by month, current threat posture, threats by source, threats by owner, risks by threat and threat register. This can help businesses in effective management of risks and counter measures. Showcasing this set of slides titled Business Threats Landscape Dashboard For Cyber Security Program Management Ppt Gallery Images PDF. The topics addressed in these templates are Current Threat Posture, Threat Register, Source. All the content presented in this PPT design is completely editable. Download it and make adjustments in color, background, font etc. as per your unique business setting.

Business Threats Landscape Dashboard For Malicious Detections And Analysis Ppt Gallery Show PDF
This slide shows risk landscape dashboard for malicious detections and analysis which contains total malicious detections, unique hashes, organizations, countries, sectors, threat types, etc. This can help cyber department in choosing a counter application or security application to prevent viruses. Showcasing this set of slides titled Business Threats Landscape Dashboard For Malicious Detections And Analysis Ppt Gallery Show PDF. The topics addressed in these templates are Total Malicious Detections, Total Unique Hashes, Total Unique Organizations. All the content presented in this PPT design is completely editable. Download it and make adjustments in color, background, font etc. as per your unique business setting.

Business Threats Landscape Dashboard With Cyber Attacks Analysis Ppt Summary Brochure PDF
This slide illustrates risk landscape dashboard with cyber attacks analysis which contains malware attack frequency, country wise attacks, top 10 attacks, etc. It can assist IT managers in analyzing top threats so that they can be dealt with proper efficiency. Pitch your topic with ease and precision using this Business Threats Landscape Dashboard With Cyber Attacks Analysis Ppt Summary Brochure PDF. This layout presents information on Malware Attack Frequency, Every Minute, Every Second. It is also available for immediate download and adjustment. So, changes can be made in the color, design, graphics or any other component to create a unique layout.
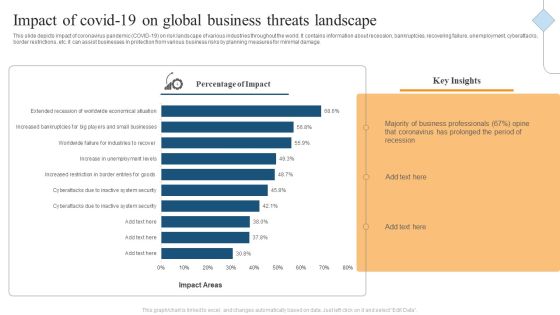
Impact Of Covid 19 On Global Business Threats Landscape Ppt Summary Ideas PDF
This slide depicts impact of coronavirus pandemic COVID-19 on risk landscape of various industries throughout the world. It contains information about recession, bankruptcies, recovering failure, unemployment, cyberattacks, border restrictions, etc. it can assist businesses in protection from various business risks by planning measures for minimal damage. Showcasing this set of slides titled Impact Of Covid 19 On Global Business Threats Landscape Ppt Summary Ideas PDF. The topics addressed in these templates are Percentage Impact, Key Insights, Business Professionals. All the content presented in this PPT design is completely editable. Download it and make adjustments in color, background, font etc. as per your unique business setting.

Statistics Depicting Risk Magnitude In Business Threats Landscape Ppt File Example Introduction PDF
This slide illustrates statistics which highlight magnitude of threats faced by various business units in a risk landscape. It entails information about cybersecurity, data privacy, digital innovation, cloud computing, transformational projects, mergers and acquisition and regulatory environment. Pitch your topic with ease and precision using this Statistics Depicting Risk Magnitude In Business Threats Landscape Ppt File Example Introduction PDF. This layout presents information on Business Units, Risk Magnitude, Business Landscape. It is also available for immediate download and adjustment. So, changes can be made in the color, design, graphics or any other component to create a unique layout.

Artificial Intelligence Global Future Growth Forthcoming Opportunities Ppt Show Clipart PDF
This slide covers forecast for global artificial intelligence market. It also includes technologies such as machine learning, natural language processing, etc. along with end user industries such as advertising and media houses, security, automotive healthcare, retail, fintech, etc. Showcasing this set of slides titled Artificial Intelligence Global Future Growth Forthcoming Opportunities Ppt Show Clipart PDF. The topics addressed in these templates are Global Artificial, Intelligence Market, Growth. All the content presented in this PPT design is completely editable. Download it and make adjustments in color, background, font etc. as per your unique business setting.

Inbound Leads Generation And Conversion Analytics Ppt Summary Show PDF
This slide covers record of prospects visits and leads generated using different sources. It includes sources such as organic search, referrals, social media, email marketing, paid search, direct traffic, etc. along with total visits, conversion rates, contacts generated, customers count, conversion rates and graph depicting monthly visits using these sources. Showcasing this set of slides titled Inbound Leads Generation And Conversion Analytics Ppt Summary Show PDF. The topics addressed in these templates are Organic Search, Referrals, Social Media. All the content presented in this PPT design is completely editable. Download it and make adjustments in color, background, font etc. as per your unique business setting.

Evaluation Survey Outcomes For Managerial Performance Assessment Ppt Gallery Graphics PDF
This slide states that managers in small business are less communicative than enterprise counterparts. It includes survey report on job fulfilment based on effective managers feedback. Showcasing this set of slides titled Evaluation Survey Outcomes For Managerial Performance Assessment Ppt Gallery Graphics PDF. The topics addressed in these templates are Employees Receiving Evaluations, Feedback From Managers, Performance Evaluation. All the content presented in this PPT design is completely editable. Download it and make adjustments in color, background, font etc. as per your unique business setting.
Performance Tracking Dashboard For 5G Technology Difference Between 4G And 5G Network Introduction PDF
This slide describes the performance tracking dashboard for 5G technology by covering the details of subscribers, qoe, consumption, customer support, coverage, devices, and dimensions.Find a pre-designed and impeccable Performance Tracking Dashboard For 5G Technology Difference Between 4G And 5G Network Introduction PDF. The templates can ace your presentation without additional effort. You can download these easy-to-edit presentation templates to make your presentation stand out from others. So, what are you waiting for Download the template from Slidegeeks today and give a unique touch to your presentation.

Dashboard For Monitoring Process Performance Of Wastewater Treatment Plant Ppt Infographic Template Demonstration PDF
This slide showcase dashboard for monitoring process performance of wastewater management plant which contains cooling degrees, control, efficiency, protection, etc. Showcasing this set of slides titled Dashboard For Monitoring Process Performance Of Wastewater Treatment Plant Ppt Infographic Template Demonstration PDF. The topics addressed in these templates are Percent Control, Water Use Efficiency, Scale Protection, Protection From Erosion. All the content presented in this PPT design is completely editable. Download it and make adjustments in color, background, font etc. as per your unique business setting.

Market Chart Showing Revenue Breakdown Of FMCG Company Ppt Layouts Layouts PDF
This slide shows the percentage of revenue generated in fast moving consumable goods industry from different segments which are food products, households, personal, baby and hair care, OTC products and others. Showcasing this set of slides titled Market Chart Showing Revenue Breakdown Of FMCG Company Ppt Layouts Layouts PDF. The topics addressed in these templates are Food Products, Personal Care, Households. All the content presented in this PPT design is completely editable. Download it and make adjustments in color, background, font etc. as per your unique business setting.

Usage Trend Chart Of Skincare Product Market Ppt Slides Graphics Download PDF
This slide shows market trend graph of skincare product usage in four quarters. It also indicates that product A is most preferred by the customers. Pitch your topic with ease and precision using this Usage Trend Chart Of Skincare Product Market Ppt Slides Graphics Download PDF. This layout presents information on Trend Product, Skincare Product, Quarter Due. It is also available for immediate download and adjustment. So, changes can be made in the color, design, graphics or any other component to create a unique layout.

Action Plan To Bridge Business Performance Gaps Guide For Successful Merger And Acquisition Summary PDF
Mentioned slide highlights the information about the action plan that company can use to bridge its business performance gaps. The slide also includes the details about the efforts required for a specific action. Find a pre-designed and impeccable Action Plan To Bridge Business Performance Gaps Guide For Successful Merger And Acquisition Summary PDF. The templates can ace your presentation without additional effort. You can download these easy-to-edit presentation templates to make your presentation stand out from others. So, what are you waiting for Download the template from Slidegeeks today and give a unique touch to your presentation.

Workplace Impact Analysis Of Employee Onboarding Buddy System Program Ppt Styles Information PDF
This slide analysis the impact of before and after implementing onboarding buddy system at workplace. It presents impact on elements like employee retention, productivity, employee engagement and job satisfaction. Showcasing this set of slides titled Workplace Impact Analysis Of Employee Onboarding Buddy System Program Ppt Styles Information PDF. The topics addressed in these templates are Organizations, Positive Impact, Employee Productivity. All the content presented in this PPT design is completely editable. Download it and make adjustments in color, background, font etc. as per your unique business setting.
Key Blocks For Project Management Dashboard Ppt Icon Tips PDF
This slide illustrates graphical representations of facts and figures related to project drivers. It includes stakeholders engagement, feedback and response rate, business units performance etc. Showcasing this set of slides titled Key Blocks For Project Management Dashboard Ppt Icon Tips PDF. The topics addressed in these templates are Stakeholders Engagement Score, Business Units Performance, Effective Communication Score. All the content presented in this PPT design is completely editable. Download it and make adjustments in color, background, font etc. as per your unique business setting.

Technical Analysis Dashboard With Website Performance Report Ppt Inspiration Outline PDF
This slide showcases dashboard for website Analysis that can help to identify the reasons and errors for decline in website speed and performance. Its key elements are site health, crawled pages and thematic reports. Showcasing this set of slides titled Technical Analysis Dashboard With Website Performance Report Ppt Inspiration Outline PDF. The topics addressed in these templates are Crawlability, International SEO, Site Performance, International Linking. All the content presented in this PPT design is completely editable. Download it and make adjustments in color, background, font etc. as per your unique business setting.
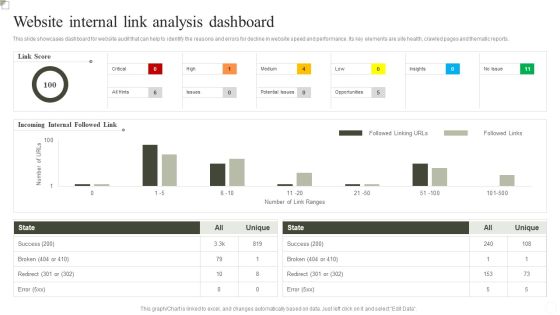
Website Internal Link Analysis Dashboard Ppt Inspiration Outline PDF
This slide showcases dashboard for website Analysis that can help to identify the reasons and errors for decline in website speed and performance. Its key elements are site health, crawled pages and thematic reports. Pitch your topic with ease and precision using this Website Internal Link Analysis Dashboard Ppt Inspiration Outline PDF. This layout presents information on Success, Incoming Internal Followed Link, Link Score. It is also available for immediate download and adjustment. So, changes can be made in the color, design, graphics or any other component to create a unique layout.

Architecture Engineering Planning Services Company EBITDA And Margin Guidelines PDF
This slide highlights the earnings before interest, taxes, depreciation, and amortization of the architecture company which showcases five year data through combination chart. This Architecture Engineering Planning Services Company EBITDA And Margin Guidelines PDF from Slidegeeks makes it easy to present information on your topic with precision. It provides customization options, so you can make changes to the colors, design, graphics, or any other component to create a unique layout. It is also available for immediate download, so you can begin using it right away. Slidegeeks has done good research to ensure that you have everything you need to make your presentation stand out. Make a name out there for a brilliant performance.

Architecture Engineering Planning Services Company Total Projects Completed In 2022 Formats PDF
This slide highlights the total projects completed by architecture company through pie chart. It includes data of residential single and multi family homes, commercial, public, interiors, small projects and heritage projects. Find a pre designed and impeccable Architecture Engineering Planning Services Company Total Projects Completed In 2022 Formats PDF. The templates can ace your presentation without additional effort. You can download these easy to edit presentation templates to make your presentation stand out from others. So, what are you waiting for Download the template from Slidegeeks today and give a unique touch to your presentation.

Customer Lead Development Management Strategies Sales Dashboard Sample PDF
Explore a selection of the finest Customer Lead Development Management Strategies Sales Dashboard Sample PDF here. With a plethora of professionally designed and pre made slide templates, you can quickly and easily find the right one for your upcoming presentation. You can use our Customer Lead Development Management Strategies Sales Dashboard Sample PDF to effectively convey your message to a wider audience. Slidegeeks has done a lot of research before preparing these presentation templates. The content can be personalized and the slides are highly editable. Grab templates today from Slidegeeks.

Customer Lead Development Management Strategies Total Lead Capture Automation In Percentage Brochure PDF
This slide shows the total lead capture automation in percentage through various channels include Ads. Phone, chat, social, etc. The Customer Lead Development Management Strategies Total Lead Capture Automation In Percentage Brochure PDF is a compilation of the most recent design trends as a series of slides. It is suitable for any subject or industry presentation, containing attractive visuals and photo spots for businesses to clearly express their messages. This template contains a variety of slides for the user to input data, such as structures to contrast two elements, bullet points, and slides for written information. Slidegeeks is prepared to create an impression.
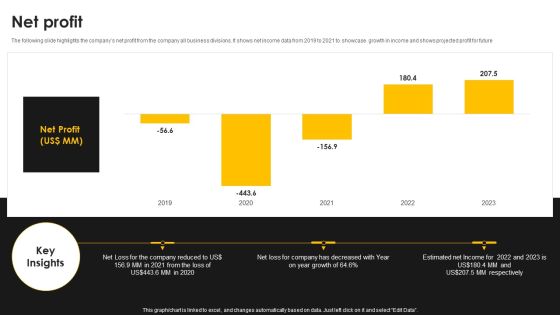
Kantar Consulting Company Outline Net Profit Elements PDF
The following slide highlights the companys net profit from the company all business divisions. It shows net income data from 2019 to 2021 to showcase growth in income and shows projected profit for future. Find a pre designed and impeccable Kantar Consulting Company Outline Net Profit Elements PDF. The templates can ace your presentation without additional effort. You can download these easy to edit presentation templates to make your presentation stand out from others. So, what are you waiting for Download the template from Slidegeeks today and give a unique touch to your presentation.

Cloud Computing Project Administration Dashboard With Change Requests Ppt Layouts Background Images PDF
Mentioned slide illustrates a comprehensive cloud project management. It covers various metrics such as planned and actual spending, risk count, issues count, change requests, overall project progress, etc. Showcasing this set of slides titled Cloud Computing Project Administration Dashboard With Change Requests Ppt Layouts Background Images PDF. The topics addressed in these templates are Project Financials, Project Spend, Project Progress. All the content presented in this PPT design is completely editable. Download it and make adjustments in color, background, font etc. as per your unique business setting.
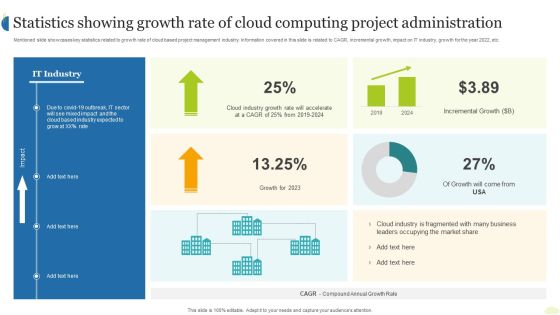
Statistics Showing Growth Rate Of Cloud Computing Project Administration Ppt Ideas Aids PDF
Mentioned slide showcases key statistics related to growth rate of cloud based project management industry. Information covered in this slide is related to CAGR, incremental growth, impact on IT industry, growth for the year 2022, etc. Showcasing this set of slides titled Statistics Showing Growth Rate Of Cloud Computing Project Administration Ppt Ideas Aids PDF. The topics addressed in these templates are IT Industry, Growth 2023, Incremental Growth. All the content presented in this PPT design is completely editable. Download it and make adjustments in color, background, font etc. as per your unique business setting.

Automobile Company Actual And Forecasted Monthly Sales Dashboard Ppt Infographic Template Aids PDF
This slide shows the dashboard for forecasting the sales of an automobile company for the current month. It represents details related to revenue by pipeline, new deals, sales forecast, revenue goal attainment by owner for the current month and pipeline coverage by next month. Showcasing this set of slides titled Automobile Company Actual And Forecasted Monthly Sales Dashboard Ppt Infographic Template Aids PDF. The topics addressed in these templates are Forecast Month, Revenue Goal Attainment, Revenue Goal Attainment. All the content presented in this PPT design is completely editable. Download it and make adjustments in color, background, font etc. as per your unique business setting.

Financial Services Organization Monthly Sales Forecast Dashboard Ppt Summary Slideshow PDF
This slide shows the dashboard representing data related to monthly sales forecast of the organization offering financial services to its clients. It includes information related to forecasted data, sales forecast, total sales, forecast projection etc. Showcasing this set of slides titled Financial Services Organization Monthly Sales Forecast Dashboard Ppt Summary Slideshow PDF. The topics addressed in these templates are Forecasts Sales, Time Series View, Forecast Projection. All the content presented in this PPT design is completely editable. Download it and make adjustments in color, background, font etc. as per your unique business setting.

Real Estate Business Monthly Sales Forecast Dashboard Ppt Layouts Grid PDF
This slide represents the dashboard showing the data related to sales forecasting for the real estate business. It shows details related to the set target, sales targets won, open and forecasted and also shows the graph representing the sales pipeline for the year. Showcasing this set of slides titled Real Estate Business Monthly Sales Forecast Dashboard Ppt Layouts Grid PDF. The topics addressed in these templates are Next Billing Data, Pipeline, Current Fiscal Year. All the content presented in this PPT design is completely editable. Download it and make adjustments in color, background, font etc. as per your unique business setting.

Brand Engagement Promotional Campaign Implementation Key Impact Of Promotional Event For Brand Awareness Diagrams PDF
This slide represents key impacts for promotional event. It covers site traffic, ROAS, customer lifetime value, engaged visit rate, page value etc. Find a pre designed and impeccable Brand Engagement Promotional Campaign Implementation Key Impact Of Promotional Event For Brand Awareness Diagrams PDF. The templates can ace your presentation without additional effort. You can download these easy to edit presentation templates to make your presentation stand out from others. So, what are you waiting for Download the template from Slidegeeks today and give a unique touch to your presentation.

Brand Engagement Promotional Campaign Implementation Statistics Associated With Promotion Strategy Structure PDF
This slide represents statistics associated with promotion strategy. It includes word of mouth marketing, coupons, discounts, promotional email etc. Create an editable Brand Engagement Promotional Campaign Implementation Statistics Associated With Promotion Strategy Structure PDF that communicates your idea and engages your audience. Whether you are presenting a business or an educational presentation, pre designed presentation templates help save time. Brand Engagement Promotional Campaign Implementation Statistics Associated With Promotion Strategy Structure PDF is highly customizable and very easy to edit, covering many different styles from creative to business presentations. Slidegeeks has creative team members who have crafted amazing templates. So, go and get them without any delay.

Application Of Artificial Intelligence AI Driven Dashboard With Website Kpis Formats PDF
This slide shows AI driven dashboard with website KPIs. It provides information such as total visits, traffic sources, geography, bounce rate, monthly visits, average visit time, etc. Showcasing this set of slides titled Application Of Artificial Intelligence AI Driven Dashboard With Website Kpis Formats PDF. The topics addressed in these templates are Bounce Rate, Monthly Visits, Traffic Sources. All the content presented in this PPT design is completely editable. Download it and make adjustments in color, background, font etc. as per your unique business setting.
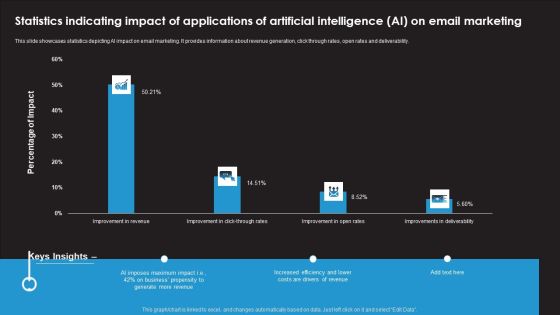
Statistics Indicating Impact Of Applications Of Artificial Intelligence AI On Email Marketing Inspiration PDF
This slide showcases statistics depicting AI impact on email marketing. It provides information about revenue generation, click through rates, open rates and deliverability. Showcasing this set of slides titled Statistics Indicating Impact Of Applications Of Artificial Intelligence AI On Email Marketing Inspiration PDF. The topics addressed in these templates are AI Imposes Maximum Impact, Business Propensity, Increased Efficiency. All the content presented in this PPT design is completely editable. Download it and make adjustments in color, background, font etc. as per your unique business setting.

Data Profiling Solutions Dashboard Indicating Row And Column Analysis Summary PDF
This slide illustrates data profiling dashboard indicating row and column analysis which can be referred by IT managers to manager to maintain quality and consistency of data. It contains information about reports, checking, evolution, overview, comparative, etc. Showcasing this set of slides titled Data Profiling Solutions Dashboard Indicating Row And Column Analysis Summary PDF. The topics addressed in these templates are Overview Analysis, Column Evaluation, Comparative Evaluation. All the content presented in this PPT design is completely editable. Download it and make adjustments in color, background, font etc. as per your unique business setting.
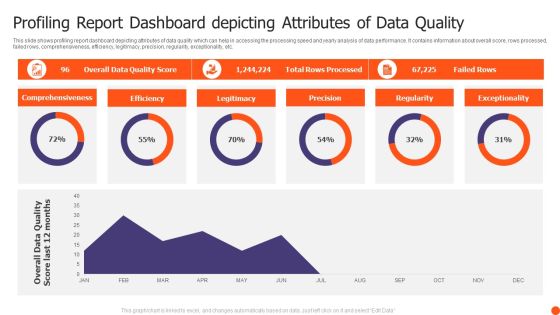
Profiling Report Dashboard Depicting Attributes Of Data Quality Themes PDF
This slide shows profiling report dashboard depicting attributes of data quality which can help in accessing the processing speed and yearly analysis of data performance. It contains information about overall score, rows processed, failed rows, comprehensiveness, efficiency, legitimacy, precision, regularity, exceptionality, etc. Pitch your topic with ease and precision using this Profiling Report Dashboard Depicting Attributes Of Data Quality Themes PDF. This layout presents information on Comprehensiveness, Efficiency, Legitimacy, Precision. It is also available for immediate download and adjustment. So, changes can be made in the color, design, graphics or any other component to create a unique layout.
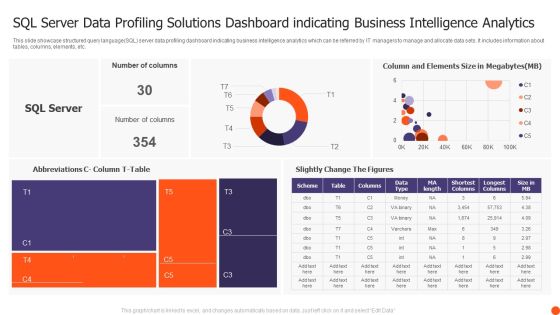
SQL Server Data Profiling Solutions Dashboard Indicating Business Intelligence Analytics Structure PDF
This slide showcase structured query language SQL server data profiling dashboard indicating business intelligence analytics which can be referred by IT managers to manage and allocate data sets. It includes information about tables, columns, elements, etc. Showcasing this set of slides titled SQL Server Data Profiling Solutions Dashboard Indicating Business Intelligence Analytics Structure PDF. The topics addressed in these templates are Number Columns, Slightly Change Figures, SQL Server. All the content presented in this PPT design is completely editable. Download it and make adjustments in color, background, font etc. as per your unique business setting.

Dashboard Of Product Sales Growth And Gross Analysis Analysis Ppt Styles Good PDF
The following slide highlights the dashboard o product sales growth and gross margin analysis illustrating key headings which includes sales by product, sales by month, sales product by margin, sales product by quantity, gross margin growth, gross margin trend and product inventory. Showcasing this set of slides titled Dashboard Of Product Sales Growth And Gross Analysis Analysis Ppt Styles Good PDF. The topics addressed in these templates are Gross Margin Growth, Gross Margin Trend, Product Inventory. All the content presented in this PPT design is completely editable. Download it and make adjustments in color, background, font etc. as per your unique business setting.
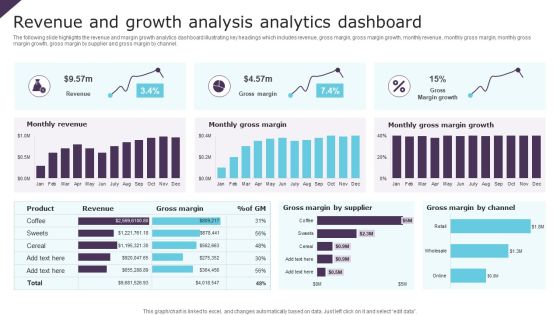
Revenue And Growth Analysis Analytics Dashboard Ppt Infographic Template Brochure PDF
The following slide highlights the revenue and margin growth analytics dashboard illustrating key headings which includes revenue, gross margin, gross margin growth, monthly revenue, monthly gross margin, monthly gross margin growth, gross margin by supplier and gross margin by channel. Pitch your topic with ease and precision using this Revenue And Growth Analysis Analytics Dashboard Ppt Infographic Template Brochure PDF. This layout presents information on Monthly Revenue, Monthly Gross Margin, Gross Margin Growth. It is also available for immediate download and adjustment. So, changes can be made in the color, design, graphics or any other component to create a unique layout.

Sales Revenue And Gross Growth Analysis Dashboard Ppt Inspiration Background Image PDF
The following slide highlights the sales revenue and gross margin growth dashboard illustrating key headings which includes gross margin, total revenue, total client, total product, gross margin trend, gross margin growth, monthly gross margin, monthly revenue, yearly revenue growth and gross margin growth trend by product. Showcasing this set of slides titled Sales Revenue And Gross Growth Analysis Dashboard Ppt Inspiration Background Image PDF. The topics addressed in these templates are Gross Margin, Total Revenue, Total Clients. All the content presented in this PPT design is completely editable. Download it and make adjustments in color, background, font etc. as per your unique business setting.

Program Management Report With Activity And Tasks Dashboard Ppt File Objects PDF
This slide covers the programme status of the project with the activities and completion percentage of the same. It also shows the outstanding tasks and the monthly status with various graphs. Pitch your topic with ease and precision using this Program Management Report With Activity And Tasks Dashboard Ppt File Objects PDF. This layout presents information on Activity, Team Management, Time Tracking. It is also available for immediate download and adjustment. So, changes can be made in the color, design, graphics or any other component to create a unique layout.

Business To Business Digital Advertisement Channels For Marketers Ppt File Background PDF
The following slide exhibits the percent of leads and revenue derived from various digital marketing channels. The channels covered are email marketing, PPC, social media, paid search and display advertising. Showcasing this set of slides titled Business To Business Digital Advertisement Channels For Marketers Ppt File Background PDF. The topics addressed in these templates are Maximum Leads, Email Marketing, Least Revenue Derived. All the content presented in this PPT design is completely editable. Download it and make adjustments in color, background, font etc. as per your unique business setting.

Food Processing Technology Industry Report And Market Analysis Brochure PDF
The following slide highlights market analysis and industry report of food technology industry recording market CAGR, market share of united states, yearly growth rate, market value, market share of several companies and advanced technology driving market growth, global food analysis etc. Pitch your topic with ease and precision using this Food Processing Technology Industry Report And Market Analysis Brochure PDF. This layout presents information on Market CAGR, Market Share Accounted, Global Food, Market Analysis. It is also available for immediate download and adjustment. So, changes can be made in the color, design, graphics or any other component to create a unique layout.

Network Risks Management And Barriers Dashboard Ppt PowerPoint Presentation Gallery Graphic Tips PDF
This slide represents a dashboard of network risk management. It also includes problem servers , workstations and their status, unmonitored network devices. Pitch your topic with ease and precision using this Network Risks Management And Barriers Dashboard Ppt PowerPoint Presentation Gallery Graphic Tips PDF. This layout presents information on Problem Servers, Server Status, Problem Workstations, Workstation Status. It is also available for immediate download and adjustment. So, changes can be made in the color, design, graphics or any other component to create a unique layout.
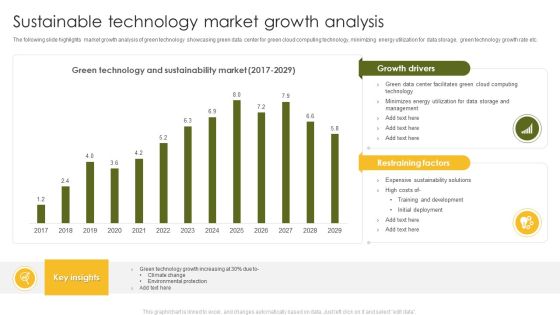
Sustainable Technology Market Growth Analysis Ppt Outline Slide Download PDF
The following slide highlights market growth analysis of green technology showcasing green data center for green cloud computing technology, minimizing energy utilization for data storage, green technology growth rate etc. Showcasing this set of slides titled Sustainable Technology Market Growth Analysis Ppt Outline Slide Download PDF. The topics addressed in these templates are Climate Change, Environmental Protection, Green Technology. All the content presented in this PPT design is completely editable. Download it and make adjustments in color, background, font etc. as per your unique business setting.
Youtube Marketing Dashboard Highlighting Traffic Source And Average Views Icons PDF
This slide showcases the youtube marketing dashboard which includes subscriber gained vs loss list which includes traffic sources and lasted uploaded videos data.Create an editable Youtube Marketing Dashboard Highlighting Traffic Source And Average Views Icons PDF that communicates your idea and engages your audience. Whether you are presenting a business or an educational presentation, pre-designed presentation templates help save time. Youtube Marketing Dashboard Highlighting Traffic Source And Average Views Icons PDF is highly customizable and very easy to edit, covering many different styles from creative to business presentations. Slidegeeks has creative team members who have crafted amazing templates. So, go and get them without any delay.

Attain Production Goals And Objectives Graph And Table Ppt Infographic Template Visuals PDF
This slide displays graphical representation of targeted and achieved production variance. It also includes critical insights such as target units, achieved production, achieved percentage, overachieved percentage, etc. Pitch your topic with ease and precision using this Attain Production Goals And Objectives Graph And Table Ppt Infographic Template Visuals PDF. This layout presents information on Target Vs Achieved, Key insight Table, Quarterly. It is also available for immediate download and adjustment. So, changes can be made in the color, design, graphics or any other component to create a unique layout.

Continuous Integration Dashboard For Automated Testing Framework Ppt Layouts Layout Ideas PDF
This slide shows continuous integration dashboard for test automation framework which can be referred by authors to review their testing performance. It contains information about weekly change volume by author, monthly change volume by author, repository, etc. Pitch your topic with ease and precision using this Continuous Integration Dashboard For Automated Testing Framework Ppt Layouts Layout Ideas PDF. This layout presents information on Total Changes Volume, Monthly Change Volume, Weekly Change Volume. It is also available for immediate download and adjustment. So, changes can be made in the color, design, graphics or any other component to create a unique layout.

Automated Testing Framework Dashboard Indicating Reported Issues And Results Ideas PDF
This slide showcase test automation framework dashboard indicating reported issues and results which can benefit IT firms in quick resolution of these problems. It contains information about weekly total, test results and details. It also includes information about passed, known issue, avoided, ended, queued, etc. Showcasing this set of slides titled Automated Testing Framework Dashboard Indicating Reported Issues And Results Ideas PDF. The topics addressed in these templates are Weekly Total, Test Results, Last 7 Days. All the content presented in this PPT design is completely editable. Download it and make adjustments in color, background, font etc. as per your unique business setting.

Customer NPS Metric Dashboard For Call Centers Ppt Inspiration Smartart PDF
This slide shows net promoter score dashboard for call centers which contains occupancy rate, tickets unassigned, opened tickets, completed tickets and raised tickets. It also has details on resolution rate on first call, enquiries, etc. Pitch your topic with ease and precision using this Customer NPS Metric Dashboard For Call Centers Ppt Inspiration Smartart PDF. This layout presents information on Occupancy Rate, Resolution Rate, Net Promoter Score. It is also available for immediate download and adjustment. So, changes can be made in the color, design, graphics or any other component to create a unique layout.

Dashboard Depicting Client And Employee Customer NPS Metric Ppt Gallery Deck PDF
This slide shows dashboard depicting client and employee net promoter score NPS. It contains information about customer refer probability, recent service review and repeated use of service. Showcasing this set of slides titled Dashboard Depicting Client And Employee Customer NPS Metric Ppt Gallery Deck PDF. The topics addressed in these templates are Client NPS, Employee NPS, Customer Probability. All the content presented in this PPT design is completely editable. Download it and make adjustments in color, background, font etc. as per your unique business setting.
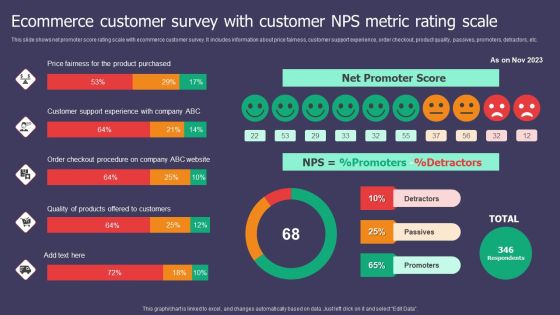
Ecommerce Customer Survey With Customer NPS Metric Rating Scale Ppt Inspiration Visual Aids PDF
This slide shows net promoter score rating scale with ecommerce customer survey. It includes information about price fairness, customer support experience, order checkout, product quality, passives, promoters, detractors, etc. Pitch your topic with ease and precision using this Ecommerce Customer Survey With Customer NPS Metric Rating Scale Ppt Inspiration Visual Aids PDF. This layout presents information on Net Promoter Score, Price Fairness, Product Purchased. It is also available for immediate download and adjustment. So, changes can be made in the color, design, graphics or any other component to create a unique layout.
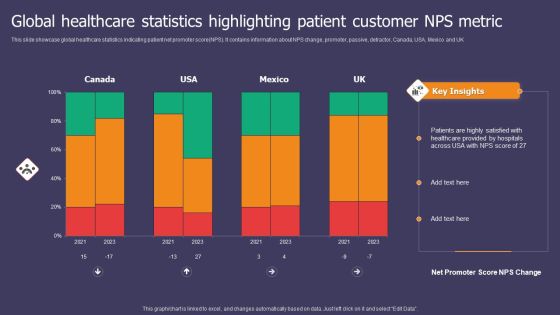
Global Healthcare Statistics Highlighting Patient Customer NPS Metric Ppt Summary Graphics Pictures PDF
This slide showcase global healthcare statistics indicating patient net promoter score NPS. It contains information about NPS change, promoter, passive, detractor, Canada, USA, Mexico and UK. Showcasing this set of slides titled Global Healthcare Statistics Highlighting Patient Customer NPS Metric Ppt Summary Graphics Pictures PDF. The topics addressed in these templates are Healthcare Provided, Hospitals Across, NPS Score. All the content presented in this PPT design is completely editable. Download it and make adjustments in color, background, font etc. as per your unique business setting.

Content Format Statistics For Influencer Marketing Strategy Paln Mockup PDF
This slide plans key statistics of that can help organization to select the format of content for influencer marketing strategy. Its key components are content format and percentage of marketers.Showcasing this set of slides titled Content Format Statistics For Influencer Marketing Strategy Paln Mockup PDF. The topics addressed in these templates are Marketers Prefer, Instagram Post, Easy Produce. All the content presented in this PPT design is completely editable. Download it and make adjustments in color, background, font etc. as per your unique business setting.
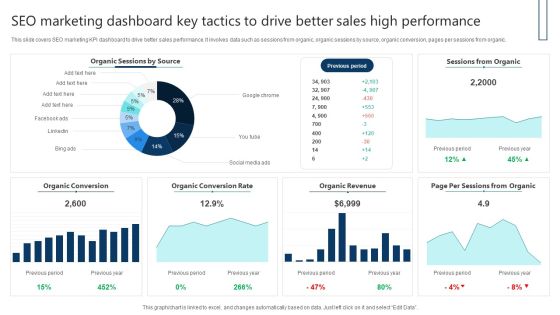
SEO Marketing Dashboard Key Tactics To Drive Better Sales High Performance Themes PDF
This slide covers SEO marketing KPI dashboard to drive better sales performance. It involves data such as sessions from organic, organic sessions by source, organic conversion, pages per sessions from organic. Showcasing this set of slides titled SEO Marketing Dashboard Key Tactics To Drive Better Sales High Performance Themes PDF. The topics addressed in these templates are Sessions From Organic, Organic Revenue, Organic Conversion Rate. All the content presented in this PPT design is completely editable. Download it and make adjustments in color, background, font etc. as per your unique business setting.
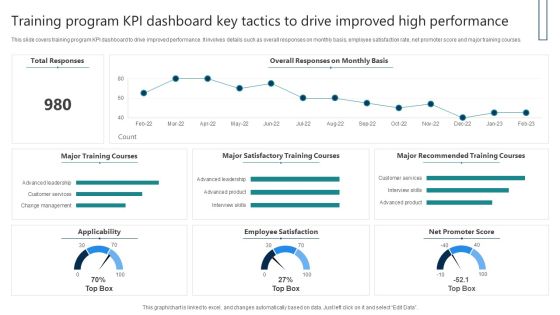
Training Program KPI Dashboard Key Tactics To Drive Improved High Performance Download PDF
This slide covers training program KPI dashboard to drive improved performance. It involves details such as overall responses on monthly basis, employee satisfaction rate, net promoter score and major training courses. Showcasing this set of slides titled Training Program KPI Dashboard Key Tactics To Drive Improved High Performance Download PDF. The topics addressed in these templates are Total Responses, Major Training Courses, Employee Satisfaction. All the content presented in this PPT design is completely editable. Download it and make adjustments in color, background, font etc. as per your unique business setting.

Sales Performance Monitoring Dashboard With Customer Details Ppt Infographics Themes PDF
This slide illustrates sales performance tracking dashboard with critical information. It provides information about customer details, invoice, earnings, leads, pending delivery, revenue, etc. Pitch your topic with ease and precision using this Sales Performance Monitoring Dashboard With Customer Details Ppt Infographics Themes PDF. This layout presents information on Todays Revenue, Today Delivered, Pending Delivery, Total Leads. It is also available for immediate download and adjustment. So, changes can be made in the color, design, graphics or any other component to create a unique layout.
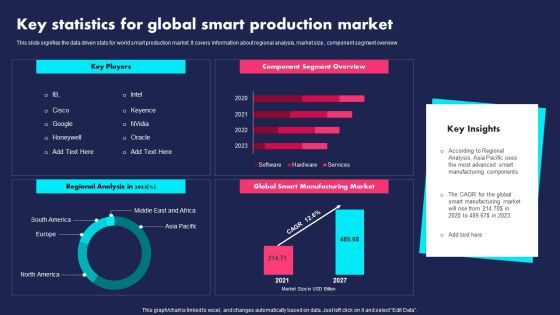
Key Statistics For Global Smart Production Market Ppt PowerPoint Presentation File Slides PDF
This slide signifies the data driven stats for world smart production market. It covers information about regional analysis, market size, component segment overview. Pitch your topic with ease and precision using this Key Statistics For Global Smart Production Market Ppt PowerPoint Presentation File Slides PDF. This layout presents information on Key Players, Component Segment Overview, Regional Analysis. It is also available for immediate download and adjustment. So, changes can be made in the color, design, graphics or any other component to create a unique layout.
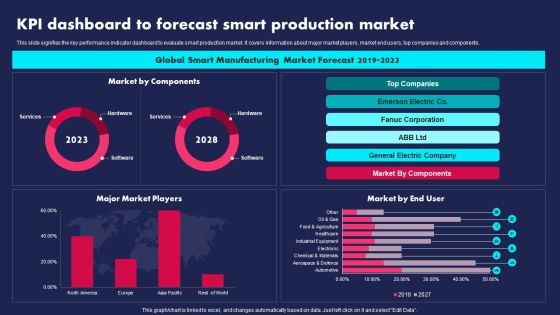
KPI Dashboard To Forecast Smart Production Market Ppt PowerPoint Presentation Gallery Visual Aids PDF
This slide signifies the key performance indicator dashboard to evaluate smart production market. It covers information about major market players, market end users, top companies and components. Pitch your topic with ease and precision using this KPI Dashboard To Forecast Smart Production Market Ppt PowerPoint Presentation Gallery Visual Aids PDF. This layout presents information on Global Smart Manufacturing, Market Forecast, 2019 To 2023. It is also available for immediate download and adjustment. So, changes can be made in the color, design, graphics or any other component to create a unique layout.

Software Development Project Weekly Status Update Summary Document Inspiration PDF
This slide represents a dashboard showing the weekly status of the software development projects of the IT department. It represents pie chart showing failed login rate, status of projects and aborted connects. Pitch your topic with ease and precision using this Software Development Project Weekly Status Update Summary Document Inspiration PDF. This layout presents information on High Failed, Login Rate, Abort Connects, Failed Login. It is also available for immediate download and adjustment. So, changes can be made in the color, design, graphics or any other component to create a unique layout.
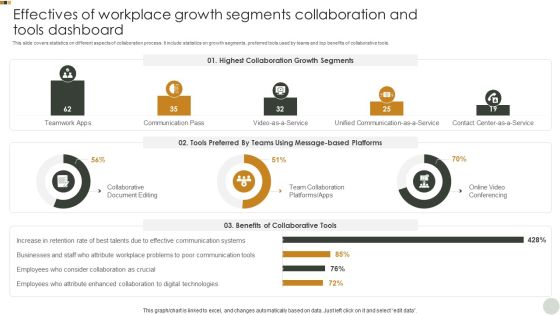
Effectives Of Workplace Growth Segments Collaboration And Tools Dashboard Graphics PDF
This slide covers statistics on different aspects of collaboration process. It include statistics on growth segments, preferred tools used by teams and top benefits of collaborative tools. Pitch your topic with ease and precision using this Effectives Of Workplace Growth Segments Collaboration And Tools Dashboard Graphics PDF. This layout presents information on Highest Collaboration, Growth Segments, Tools Preferred. It is also available for immediate download and adjustment. So, changes can be made in the color, design, graphics or any other component to create a unique layout.

Ad And Media Agency Company Profile Market Share Comparison Infographics PDF
This slide focuses on market share comparison with competitors which shows our leading company with greatest share in market due to increase in advertising projects in 2022. If your project calls for a presentation, then Slidegeeks is your go-to partner because we have professionally designed, easy-to-edit templates that are perfect for any presentation. After downloading, you can easily edit Ad And Media Agency Company Profile Market Share Comparison Infographics PDF and make the changes accordingly. You can rearrange slides or fill them with different images. Check out all the handy templates.
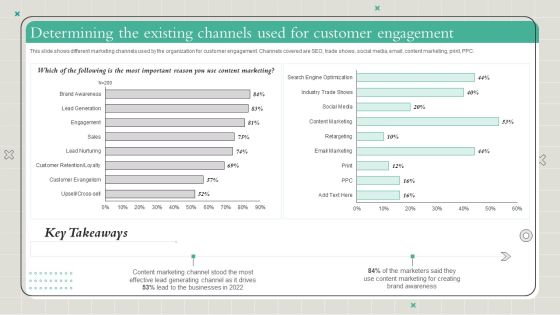
Playbook To Formulate Efficient Determining The Existing Channels Used For Customer Themes PDF
This slide shows different marketing channels used by the organization for customer engagement. Channels covered are SEO, trade shows, social media, email, content marketing, print, PPC. If your project calls for a presentation, then Slidegeeks is your go-to partner because we have professionally designed, easy-to-edit templates that are perfect for any presentation. After downloading, you can easily edit Playbook To Formulate Efficient Determining The Existing Channels Used For Customer Themes PDF and make the changes accordingly. You can rearrange slides or fill them with different images. Check out all the handy templates

Key Business Metrics Dashboard Company Process Administration And Optimization Playbook Infographics PDF
The following dashboard displays the key business metrics such as new customers, profit, revenue per customer, and weekly revenue. Slidegeeks is here to make your presentations a breeze with Key Business Metrics Dashboard Company Process Administration And Optimization Playbook Infographics PDF With our easy-to-use and customizable templates, you can focus on delivering your ideas rather than worrying about formatting. With a variety of designs to choose from, you are sure to find one that suits your needs. And with animations and unique photos, illustrations, and fonts, you can make your presentation pop. So whether you are giving a sales pitch or presenting to the board, make sure to check out Slidegeeks first.

Kpi Dashboard To Measure Talent Performance Employee Performance Management Tactics Professional PDF
This slide represents dashboard to measure talent performance in organization. It includes talent applicant status, team training methods, talented candidate status, risk for loss of potential talent pool etc.The Kpi Dashboard To Measure Talent Performance Employee Performance Management Tactics Professional PDF is a compilation of the most recent design trends as a series of slides. It is suitable for any subject or industry presentation, containing attractive visuals and photo spots for businesses to clearly express their messages. This template contains a variety of slides for the user to input data, such as structures to contrast two elements, bullet points, and slides for written information. Slidegeeks is prepared to create an impression.

Customer Lifecycle Marketing For B2C Companies Topics PDF
Here is a list of digital marketing activities that should be carried out by businesses to engage prospects and customers across their path to purchase. The Customer Lifecycle Marketing For B2C Companies Topics PDF is a compilation of the most recent design trends as a series of slides. It is suitable for any subject or industry presentation, containing attractive visuals and photo spots for businesses to clearly express their messages. This template contains a variety of slides for the user to input data, such as structures to contrast two elements, bullet points, and slides for written information. Slidegeeks is prepared to create an impression.
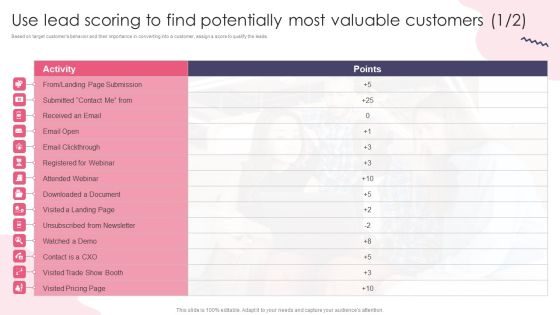
Use Lead Scoring To Find Potentially Most Valuable Customers Infographics PDF
Based on target customers behavior and their importance in converting into a customer, assign a score to qualify the leads. Retrieve professionally designed Use Lead Scoring To Find Potentially Most Valuable Customers Infographics PDF to effectively convey your message and captivate your listeners. Save time by selecting pre-made slideshows that are appropriate for various topics, from business to educational purposes. These themes come in many different styles, from creative to corporate, and all of them are easily adjustable and can be edited quickly. Access them as PowerPoint templates or as Google Slides themes. You do not have to go on a hunt for the perfect presentation because Slidegeeks got you covered from everywhere.
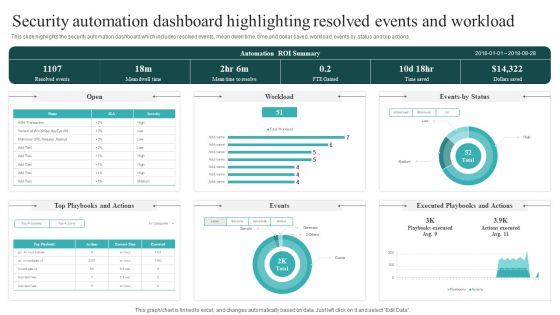
Security Automation Dashboard Highlighting Resolved Events And Workload Guidelines PDF
This slide highlights the security automation dashboard which includes resolved events, mean dwell time, time and dollar saved, workload, events by status and top actions. This Security Automation Dashboard Highlighting Resolved Events And Workload Guidelines PDF is perfect for any presentation, be it in front of clients or colleagues. It is a versatile and stylish solution for organizing your meetings. The Security Automation Dashboard Highlighting Resolved Events And Workload Guidelines PDF features a modern design for your presentation meetings. The adjustable and customizable slides provide unlimited possibilities for acing up your presentation. Slidegeeks has done all the homework before launching the product for you. So, don not wait, grab the presentation templates today.
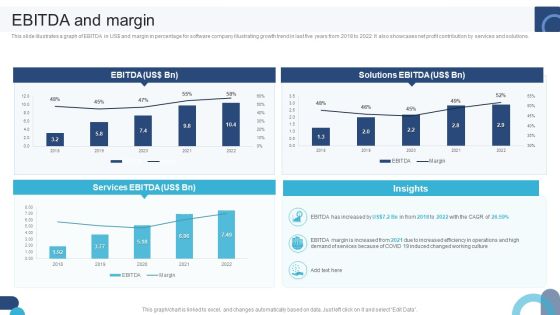
Digital Application Software Development Business Profile EBITDA And Margin Guidelines PDF
This slide illustrates a graph of EBITDA in US dollar and margin in percentage for software company illustrating growth trend in last five years from 2018 to 2022. It also showcases net profit contribution by services and solutions. If your project calls for a presentation, then Slidegeeks is your go-to partner because we have professionally designed, easy-to-edit templates that are perfect for any presentation. After downloading, you can easily edit Digital Application Software Development Business Profile EBITDA And Margin Guidelines PDF and make the changes accordingly. You can rearrange slides or fill them with different images. Check out all the handy templates

BPM Tools Application To Increase What Are The Top Priorities For Your Organization For 2021 Demonstration PDF
Do you have an important presentation coming up Are you looking for something that will make your presentation stand out from the rest Look no further thanBPM Tools Application To Increase What Are The Top Priorities For Your Organization For 2021 Demonstration PDF. With our professional designs, you can trust that your presentation will pop and make delivering it a smooth process. And with Slidegeeks, you can trust that your presentation will be unique and memorable. So why wait Grab BPM Tools Application To Increase What Are The Top Priorities For Your Organization For 2021 Demonstration PDF today and make your presentation stand out from the rest.

Clustered Column Dual Branding Campaign For Product Promotion And Recognition Inspiration PDF
Get a simple yet stunning designed Clustered Column Dual Branding Campaign For Product Promotion And Recognition Inspiration PDF. It is the best one to establish the tone in your meetings. It is an excellent way to make your presentations highly effective. So, download this PPT today from Slidegeeks and see the positive impacts. Our easy-to-edit Clustered Column Dual Branding Campaign For Product Promotion And Recognition Inspiration PDF can be your go-to option for all upcoming conferences and meetings. So, what are you waiting for Grab this template today.

Linked Data Visualization Data Quality Dashboard For Linked Data Pictures PDF
This slide describes the data quality dashboard for linked data by covering details of account information quality, contact details quality, financial data quality, and missing account information. Create an editable Linked Data Visualization Data Quality Dashboard For Linked Data Pictures PDF that communicates your idea and engages your audience. Whether youre presenting a business or an educational presentation, pre-designed presentation templates help save time. Linked Data Visualization Data Quality Dashboard For Linked Data Pictures PDF is highly customizable and very easy to edit, covering many different styles from creative to business presentations. Slidegeeks has creative team members who have crafted amazing templates. So, go and get them without any delay.
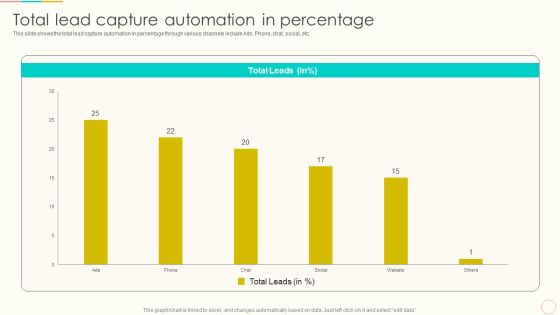
Lead Management To Engage Potential Customers Total Lead Capture Automation In Percentage Rules PDF
This slide shows the total lead capture automation in percentage through various channels include Ads. Phone, chat, social, etc. This Lead Management To Engage Potential Customers Total Lead Capture Automation In Percentage Rules PDF from Slidegeeks makes it easy to present information on your topic with precision. It provides customization options, so you can make changes to the colors, design, graphics, or any other component to create a unique layout. It is also available for immediate download, so you can begin using it right away. Slidegeeks has done good research to ensure that you have everything you need to make your presentation stand out. Make a name out there for a brilliant performance.
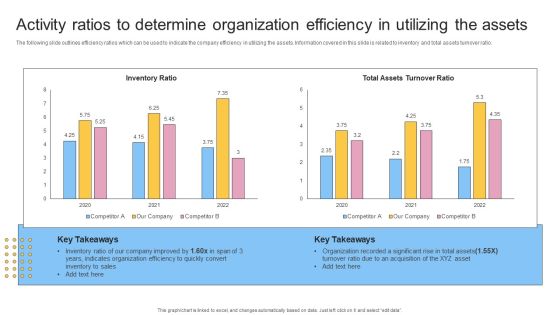
Activity Ratios To Determine Organization Efficiency In Utilizing The Assets Slides PDF
Slidegeeks is here to make your presentations a breeze with Activity Ratios To Determine Organization Efficiency In Utilizing The Assets Slides PDF With our easy to use and customizable templates, you can focus on delivering your ideas rather than worrying about formatting. With a variety of designs to choose from, you are sure to find one that suits your needs. And with animations and unique photos, illustrations, and fonts, you can make your presentation pop. So whether you are giving a sales pitch or presenting to the board, make sure to check out Slidegeeks first.

Financial Planning And Examination Plan For Small And Large Enterprises Bar Graph Elements PDF
Slidegeeks is here to make your presentations a breeze with Financial Planning And Examination Plan For Small And Large Enterprises Bar Graph Elements PDF With our easy to use and customizable templates, you can focus on delivering your ideas rather than worrying about formatting. With a variety of designs to choose from, you are sure to find one that suits your needs. And with animations and unique photos, illustrations, and fonts, you can make your presentation pop. So whether you are giving a sales pitch or presenting to the board, make sure to check out Slidegeeks first.

Effectiveness Of Online Media Channels Digital Marketing Strategy Deployment Graphics PDF
This slide focuses on the effectiveness of online media channels which covers email marketing, social PPC, content marketing, direct mail, etc.Get a simple yet stunning designed Effectiveness Of Online Media Channels Digital Marketing Strategy Deployment Graphics PDF. It is the best one to establish the tone in your meetings. It is an excellent way to make your presentations highly effective. So, download this PPT today from Slidegeeks and see the positive impacts. Our easy-to-edit Effectiveness Of Online Media Channels Digital Marketing Strategy Deployment Graphics PDF can be your go-to option for all upcoming conferences and meetings. So, what are you waiting for Grab this template today.
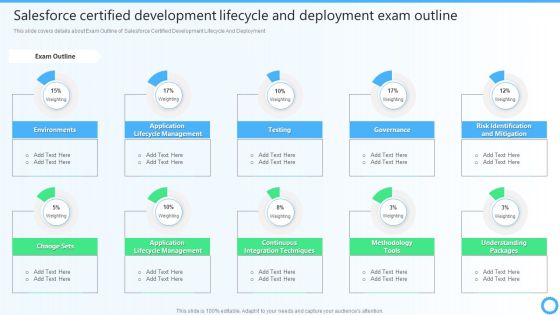
Salesforce Certified Development Lifecycle And Deployment Exam Outline IT Certifications To Enhance Inspiration PDF
This slide covers details about Exam Outline of Salesforce Certified Development Lifecycle And Deployment. Slidegeeks is here to make your presentations a breeze with Salesforce Certified Development Lifecycle And Deployment Exam Outline IT Certifications To Enhance Inspiration PDF With our easy-to-use and customizable templates, you can focus on delivering your ideas rather than worrying about formatting. With a variety of designs to choose from, you are sure to find one that suits your needs. And with animations and unique photos, illustrations, and fonts, you can make your presentation pop. So whether you are giving a sales pitch or presenting to the board, make sure to check out Slidegeeks first.

Emotional Marketing Strategy To Nurture Empowerment Branding Overview Elements Elements PDF
This Emotional Marketing Strategy To Nurture Empowerment Branding Overview Elements Elements PDF is perfect for any presentation, be it in front of clients or colleagues. It is a versatile and stylish solution for organizing your meetings. The Emotional Marketing Strategy To Nurture Empowerment Branding Overview Elements Elements PDF features a modern design for your presentation meetings. The adjustable and customizable slides provide unlimited possibilities for acing up your presentation. Slidegeeks has done all the homework before launching the product for you. So, dont wait, grab the presentation templates today.
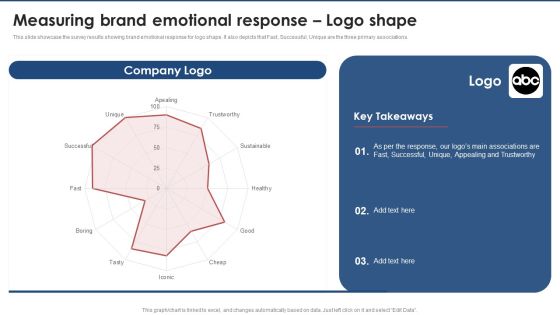
Measuring Brand Emotional Response Logo Shape Brand Value Estimation Guide Sample PDF
This slide showcase the survey results showing brand emotional response for logo shape. It also depicts that Fast, Successful, Unique are the three primary associations. The Measuring Brand Emotional Response Logo Shape Brand Value Estimation Guide Sample PDF is a compilation of the most recent design trends as a series of slides. It is suitable for any subject or industry presentation, containing attractive visuals and photo spots for businesses to clearly express their messages. This template contains a variety of slides for the user to input data, such as structures to contrast two elements, bullet points, and slides for written information. Slidegeeks is prepared to create an impression.
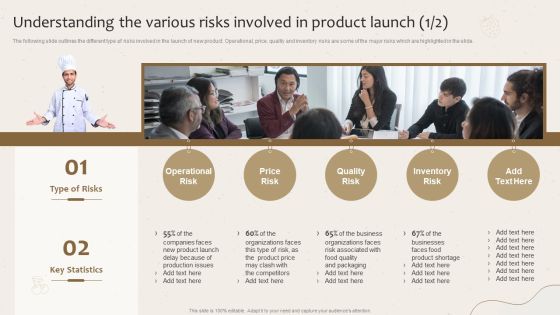
Understanding The Various Risks Involved In Product Launch Launching New Beverage Product Download PDF
Retrieve professionally designed Understanding The Various Risks Involved In Product Launch Launching New Beverage Product Download PDF to effectively convey your message and captivate your listeners. Save time by selecting pre-made slideshows that are appropriate for various topics, from business to educational purposes. These themes come in many different styles, from creative to corporate, and all of them are easily adjustable and can be edited quickly. Access them as PowerPoint templates or as Google Slides themes. You do not have to go on a hunt for the perfect presentation because Slidegeeks got you covered from everywhere.

IP Strategic Management Dashboard Ppt PowerPoint Presentation File Example PDF
This slide provides glimpse about facts and figures related to IP strategic management that can help an organization to ensure IP enforcement. It includes global patent coverage, active patients, etc. Showcasing this set of slides titled IP Strategic Management Dashboard Ppt PowerPoint Presentation File Example PDF. The topics addressed in these templates are Quarterly Annuities, Workload Distribution Firm, Active Patents. All the content presented in this PPT design is completely editable. Download it and make adjustments in color, background, font etc. as per your unique business setting.

Plastic Waste Recycling Statistics Based On Compound Annual Growth Rate Inspiration PDF
This slide covers statistics based on top countries contribution in plastic recycling and waste management. It includes report from period 2019-2025 with insights based on CAGR. Pitch your topic with ease and precision using this Plastic Waste Recycling Statistics Based On Compound Annual Growth Rate Inspiration PDF. This layout presents information on Contributes Maximum, 2015 To 2025. It is also available for immediate download and adjustment. So, changes can be made in the color, design, graphics or any other component to create a unique layout.

Post Consumer Recycled Plastic Waste Market Statistics With Growth Rate Elements PDF
This slide covers a report on plastic recycling based on future projections. It includes CAGR rate, incremental growth from 2019-2023, annual growth rate, etc. Showcasing this set of slides titled Post Consumer Recycled Plastic Waste Market Statistics With Growth Rate Elements PDF. The topics addressed in these templates are Market Acceleration, Growth CAGR, Incremental Growth, 2021 To 2023. All the content presented in this PPT design is completely editable. Download it and make adjustments in color, background, font etc. as per your unique business setting.
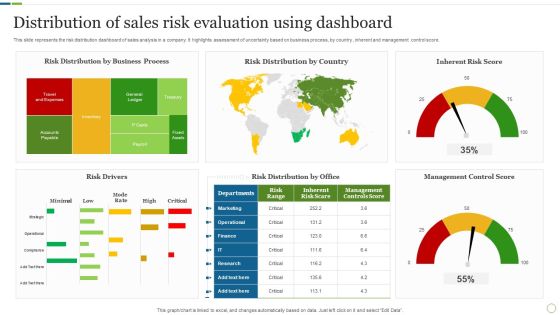
Distribution Of Sales Risk Evaluation Using Dashboard Brochure PDF
This slide represents the risk distribution dashboard of sales analysis in a company. It highlights assessment of uncertainty based on business process, by country , inherent and management control score. Showcasing this set of slides titled Distribution Of Sales Risk Evaluation Using Dashboard Brochure PDF. The topics addressed in these templates are Risk Drivers, Management Control Score, Inherent Risk Score. All the content presented in this PPT design is completely editable. Download it and make adjustments in color, background, font etc. as per your unique business setting.
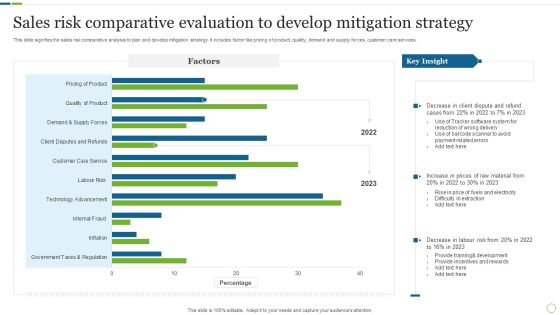
Sales Risk Comparative Evaluation To Develop Mitigation Strategy Rules PDF
This slide signifies the sales risk comparative analysis to plan and develop mitigation strategy. It includes factor like pricing of product, quality, demand and supply forces, customer care services. Showcasing this set of slides titled Sales Risk Comparative Evaluation To Develop Mitigation Strategy Rules PDF. The topics addressed in these templates are Raw Material, Labour Risk, Development. All the content presented in this PPT design is completely editable. Download it and make adjustments in color, background, font etc. as per your unique business setting.
