Investment Portfolio

Downturn Graph Indicating Growth Rate In Various Countries Ppt PowerPoint Presentation Layouts Design Templates PDF
Pitch your topic with ease and precision using this downturn graph indicating growth rate in various countries ppt powerpoint presentation layouts design templates pdf. This layout presents information on downturn graph indicating growth rate in various countries. It is also available for immediate download and adjustment. So, changes can be made in the color, design, graphics or any other component to create a unique layout.

Graph Showing Reduction In Product Sales Ppt PowerPoint Presentation Infographic Template Graphics Design PDF
Pitch your topic with ease and precision using this graph showing reduction in product sales ppt powerpoint presentation infographic template graphics design pdf. This layout presents information on graph showing reduction in product sales, 2015 to 2020. It is also available for immediate download and adjustment. So, changes can be made in the color, design, graphics or any other component to create a unique layout.

Business To Customers Content Marketing Strategy Ppt PowerPoint Presentation Layouts Designs Download PDF
Pitch your topic with ease and precision using this business to customers content marketing strategy ppt powerpoint presentation layouts designs download pdf. This layout presents information on social media, digital advertising, print advertising, search engine optimization, branding, testimonial, content marketing. It is also available for immediate download and adjustment. So, changes can be made in the color, design, graphics or any other component to create a unique layout.
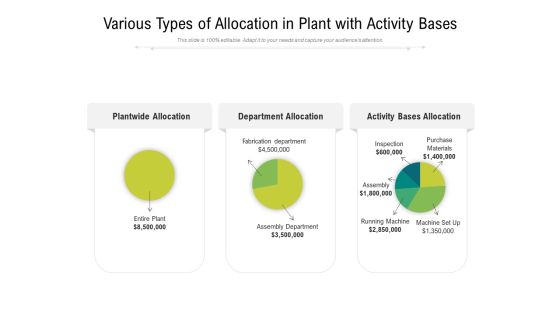
Various Types Of Allocation In Plant With Activity Bases Ppt PowerPoint Presentation File Graphics Design PDF
Pitch your topic with ease and precision using this various types of allocation in plant with activity bases ppt powerpoint presentation file graphics design pdf. This layout presents information on plantwide allocation, department allocation, activity bases allocation. It is also available for immediate download and adjustment. So, changes can be made in the color, design, graphics or any other component to create a unique layout.

Mobile Analytics To Assess User Interactions Ppt PowerPoint Presentation Layouts Design Inspiration PDF
Pitch your topic with ease and precision using this mobile analytics to assess user interactions ppt powerpoint presentation layouts design inspiration pdf. This layout presents information on platform android, occurrences, affected users, latest app version, revenue loss. It is also available for immediate download and adjustment. So, changes can be made in the color, design, graphics or any other component to create a unique layout.
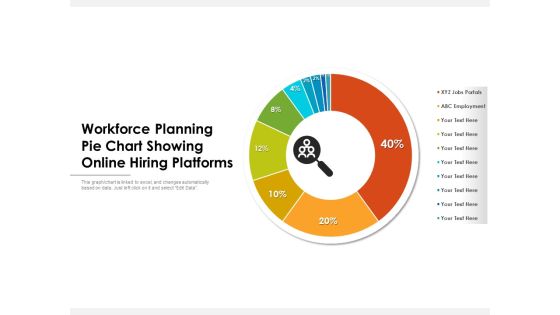
Workforce Planning Pie Chart Showing Online Hiring Platforms Ppt PowerPoint Presentation Inspiration Background Designs PDF
Pitch your topic with ease and precision using this workforce planning pie chart showing online hiring platforms ppt powerpoint presentation inspiration background designs pdf. This layout presents information on workforce planning pie chart showing online hiring platforms. It is also available for immediate download and adjustment. So, changes can be made in the color, design, graphics or any other component to create a unique layout.

Chart Depicting New Emerging Markets Share With Advanced Economies Ppt PowerPoint Presentation Gallery Design Ideas PDF
Pitch your topic with ease and precision using this chart depicting new emerging markets share with advanced economies ppt powerpoint presentation gallery design ideas pdf. This layout presents information on chart depicting new emerging markets share with advanced economies. It is also available for immediate download and adjustment. So, changes can be made in the color, design, graphics or any other component to create a unique layout.

It Operations Report With Support Status Ppt PowerPoint Presentation File Background Designs PDF
Pitch your topic with ease and precision using this it operations report with support status ppt powerpoint presentation file background designs pdf. This layout presents information on support status, total number of tickets resolved in each category, number of tickets in same issue type. It is also available for immediate download and adjustment. So, changes can be made in the color, design, graphics or any other component to create a unique layout.
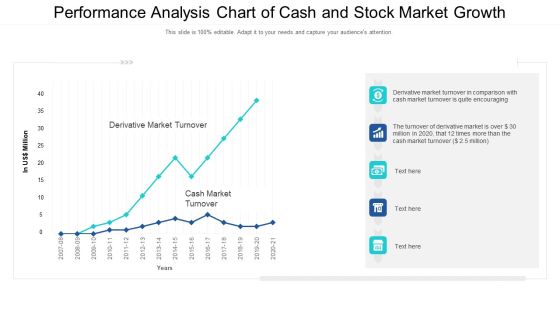
Performance Analysis Chart Of Cash And Stock Market Growth Ppt PowerPoint Presentation Outline Design Inspiration PDF
Showcasing this set of slides titled performance analysis chart of cash and stock market growth ppt powerpoint presentation outline design inspiration pdf. The topics addressed in these templates are performance analysis chart of cash and stock market growth. All the content presented in this PPT design is completely editable. Download it and make adjustments in color, background, font etc. as per your unique business setting.
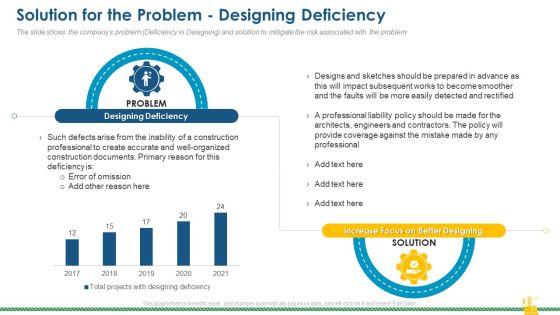
Rising Construction Defect Claims Against The Corporation Solution For The Problem Designing Deficiency Themes PDF
The slide shows the companys problem Deficiency in Designing and solution to mitigate the risk associated with the problem. Deliver an awe inspiring pitch with this creative rising construction defect claims against the corporation solution for the problem designing deficiency themes pdf bundle. Topics like construction, deficiency, engineers and contractors, focus can be discussed with this completely editable template. It is available for immediate download depending on the needs and requirements of the user.

Bar Chart With Percentage For Employed Workers By Gender Ppt PowerPoint Presentation File Graphics Design PDF
Showcasing this set of slides titled bar chart with percentage for employed workers by gender ppt powerpoint presentation file graphics design pdf. The topics addressed in these templates are bar chart with percentage for employed workers by gender. All the content presented in this PPT design is completely editable. Download it and make adjustments in color, background, font etc. as per your unique business setting.
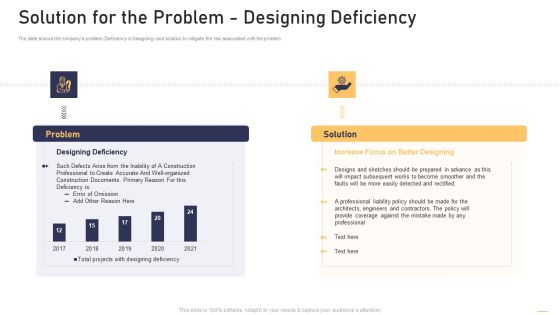
Surge In Construction Faults Lawsuits Case Competition Solution For The Problem Designing Deficiency Portrait PDF
The slide shows the companys problem Deficiency in Designing and solution to mitigate the risk associated with the problem. Deliver and pitch your topic in the best possible manner with this surge in construction faults lawsuits case competition solution for the problem designing deficiency portrait pdf. Use them to share invaluable insights on problem, solution and impress your audience. This template can be altered and modified as per your expectations. So, grab it now.

Location And Navigation Geo Location Based App Key Facts And Figures Designs PDF
Location And Navigation Geo Location Based App Key Facts And Figures Designs PDF. Deliver and pitch your topic in the best possible manner with this Location And Navigation Geo Location Based App Key Facts And Figures Designs PDF. Use them to share invaluable insights on Top Hundred Apps, Each Category, Business, Social and impress your audience. This template can be altered and modified as per your expectations. So, grab it now.

Product Performance Highlights With Key Growth Drivers Ppt Pictures Design Templates PDF
This graph or chart is linked to excel, and changes automatically based on data. Just left click on it and select Edit Data. Pitch your topic with ease and precision using this Product Performance Highlights With Key Growth Drivers Ppt Pictures Design Templates PDF. This layout presents information on Product Performance, Key Growth, Projected Growth. It is also available for immediate download and adjustment. So, changes can be made in the color, design, graphics or any other component to create a unique layout.
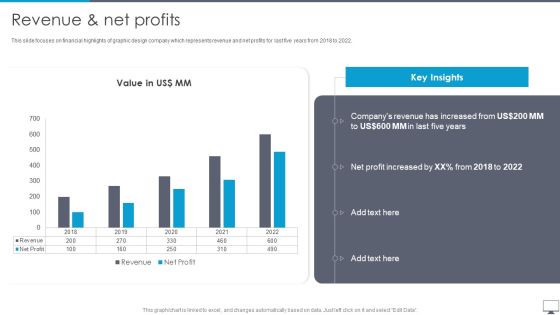
Graphic Designing And Visual Arts Company Profile Revenue And Net Profits Mockup PDF
This slide focuses on financial highlights of graphic design company which represents revenue and net profits for last five years from 2018 to 2022. Deliver and pitch your topic in the best possible manner with this Graphic Designing And Visual Arts Company Profile Revenue And Net Profits Mockup PDF. Use them to share invaluable insights on Companys Revenue, Net Profit Increased, Value and impress your audience. This template can be altered and modified as per your expectations. So, grab it now.

Call Center Client Helpline Dashboard Status Ppt Show Graphics Design PDF
This graph or chart is linked to excel, and changes automatically based on data. Just left click on it and select Edit Data. Showcasing this set of slides titled Call Center Client Helpline Dashboard Status Ppt Show Graphics Design PDF. The topics addressed in these templates are Call Monitor, Active Calls, Abandoned, Agents Ready. All the content presented in this PPT design is completely editable. Download it and make adjustments in color, background, font etc. as per your unique business setting.

Stock Requirement Plan With Inventory Summary Ppt PowerPoint Presentation Gallery Designs Download PDF
The following slide highlights the material requirement planning with inventory summary. It illustrates sales report, delivery report, inventory summary, purchase order and suppliers. Showcasing this set of slides titled Stock Requirement Plan With Inventory Summary Ppt PowerPoint Presentation Gallery Designs Download PDF. The topics addressed in these templates are Suppliers, Sales Report, Inventory Summary, Purchase Order. All the content presented in this PPT design is completely editable. Download it and make adjustments in color, background, font etc. as per your unique business setting.

Interior Design Company Outline EBITDA Margin Ppt PowerPoint Presentation Gallery Gridlines PDF
This slide represents the earning before interest, taxes, depreciation and amortization of interior design company for last five years which shows highest EBITDA in 2022 due to reduced operating expense. Deliver an awe inspiring pitch with this creative Interior Design Company Outline EBITDA Margin Ppt PowerPoint Presentation Gallery Gridlines PDF bundle. Topics like EBITDA Margin, Key Insights, 2018 to 2022 can be discussed with this completely editable template. It is available for immediate download depending on the needs and requirements of the user.
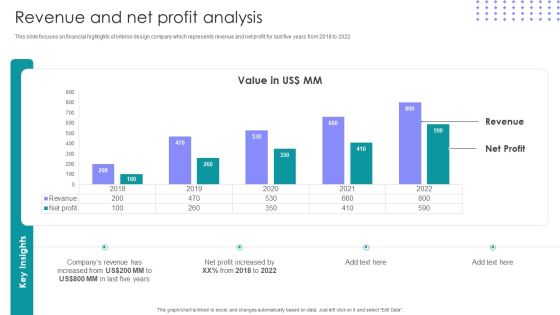
Interior Design Company Outline Revenue And Net Profit Analysis Ppt PowerPoint Presentation Gallery Influencers PDF
This slide focuses on financial highlights of interior design company which represents revenue and net profit for last five years from 2018 to 2022. Deliver an awe inspiring pitch with this creative Interior Design Company Outline Revenue And Net Profit Analysis Ppt PowerPoint Presentation Gallery Influencers PDF bundle. Topics like Revenue, Net Profit, 2018 To 2022 can be discussed with this completely editable template. It is available for immediate download depending on the needs and requirements of the user.
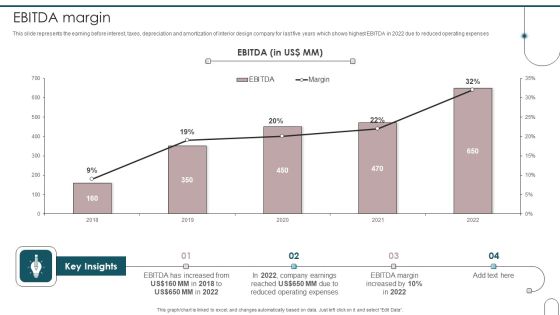
Home Interior Design And Decoration Company Profile EBITDA Margin Elements PDF
This slide represents the earning before interest, taxes, depreciation and amortization of interior design company for last five years which shows highest EBITDA in 2022 due to reduced operating expenses. Deliver an awe inspiring pitch with this creative Home Interior Design And Decoration Company Profile EBITDA Margin Elements PDF bundle. Topics like EBITDA, Reduced Operating Expense, 2018 To 2022 can be discussed with this completely editable template. It is available for immediate download depending on the needs and requirements of the user.

Home Interior Design And Decoration Company Profile Operating Profits From 2018 To 2022 Introduction PDF
This slide covers the operating profit of interior design company for last five years from 2018 to 2022 which shows changes in operating profits year after year. Deliver an awe inspiring pitch with this creative Home Interior Design And Decoration Company Profile Operating Profits From 2018 To 2022 Introduction PDF bundle. Topics like Operating Profit, Key Insights, 2018 To 2022 can be discussed with this completely editable template. It is available for immediate download depending on the needs and requirements of the user.

Home Interior Design And Decoration Company Profile Revenue And Net Profit Analysis Summary PDF
This slide focuses on financial highlights of interior design company which represents revenue and net profit for last five years from 2018 to 2022. Deliver and pitch your topic in the best possible manner with this Home Interior Design And Decoration Company Profile Revenue And Net Profit Analysis Summary PDF. Use them to share invaluable insights on Revenue, Net Profit, 2018 To 2022 and impress your audience. This template can be altered and modified as per your expectations. So, grab it now.

Interior Design Company Outline Operating Profits From 2018 To 2022 Themes PDF
This slide covers the operating profit of interior design company for last five years from 2018 to 2022 which shows changes in operating profits year after year. Deliver an awe inspiring pitch with this creative Interior Design Company Outline Operating Profits From 2018 To 2022 Themes PDF bundle. Topics like Operating Profit, 2018 To 2022, Key Insights can be discussed with this completely editable template. It is available for immediate download depending on the needs and requirements of the user.

Monthly Project Progress Details Dashboard To Monitor Work Progress Ppt Summary Design Templates PDF
The slide shows a dashboard for project progress management. It includes gross margin, billing utilization, invoiced, active users, scope delivered, quality, risks, etc. Showcasing this set of slides titled Monthly Project Progress Details Dashboard To Monitor Work Progress Ppt Summary Design Templates PDF. The topics addressed in these templates are Scope Delivered, Quality, Risks. All the content presented in this PPT design is completely editable. Download it and make adjustments in color, background, font etc. as per your unique business setting.
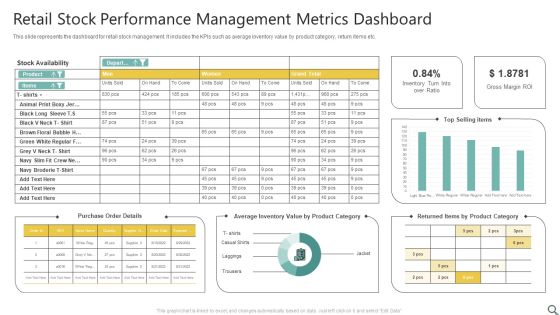
Retail Stock Performance Management Metrics Dashboard Ppt Professional Design Inspiration PDF
This slide represents the dashboard for retail stock management. It includes the KPIs such as average inventory value by product category, return items etc. Showcasing this set of slides titled Retail Stock Performance Management Metrics Dashboard Ppt Professional Design Inspiration PDF. The topics addressed in these templates are Stock Availability, Purchase Order Details, Top Selling Items. All the content presented in this PPT design is completely editable. Download it and make adjustments in color, background, font etc. as per your unique business setting.
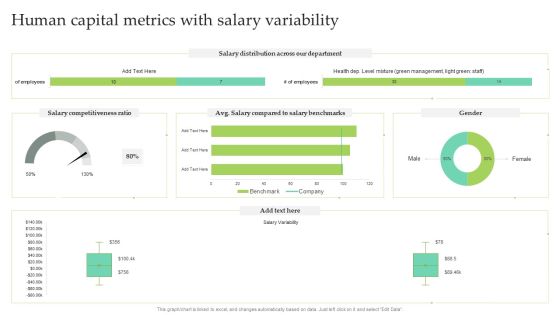
Human Capital Metrics With Salary Variability Ppt Infographic Template Designs PDF
This graph or chart is linked to excel, and changes automatically based on data. Just left click on it and select Edit Data. Pitch your topic with ease and precision using this Human Capital Metrics With Salary Variability Ppt Infographic Template Designs PDF. This layout presents information on Salary Distribution, Salary Competitiveness Ratio, Male. It is also available for immediate download and adjustment. So, changes can be made in the color, design, graphics or any other component to create a unique layout.
Market Penetration Dashboard With Population Metrics Ppt Icon Graphics Design PDF
This slide shows market penetration dashboard with key demographics. It provides information about census population, per capita income, leads to be penetrated and footfall. Showcasing this set of slides titled Market Penetration Dashboard With Population Metrics Ppt Icon Graphics Design PDF. The topics addressed in these templates are Census Population, Per Capita Income, Footfall. All the content presented in this PPT design is completely editable. Download it and make adjustments in color, background, font etc. as per your unique business setting.

Data Evaluation And Processing Toolkit Reasons Towards Failure Of Data Analytics Project Designs PDF
This slide shows the graph highlighting key reasons for the failure of data management project. If your project calls for a presentation, then Slidegeeks is your go-to partner because we have professionally designed, easy-to-edit templates that are perfect for any presentation. After downloading, you can easily edit Data Evaluation And Processing Toolkit Reasons Towards Failure Of Data Analytics Project Designs PDF and make the changes accordingly. You can rearrange slides or fill them with different images. Check out all the handy templates.

Web Design Company Overview Operating Profits From 2018 To 2022 Professional PDF
This slide covers the operating profit of web design company for last five years from 2018 to 2022 which shows changes in operating profits year after year. There are so many reasons you need a Web Design Company Overview Operating Profits From 2018 To 2022 Professional PDF. The first reason is you can not spend time making everything from scratch, Thus, Slidegeeks has made presentation templates for you too. You can easily download these templates from our website easily.
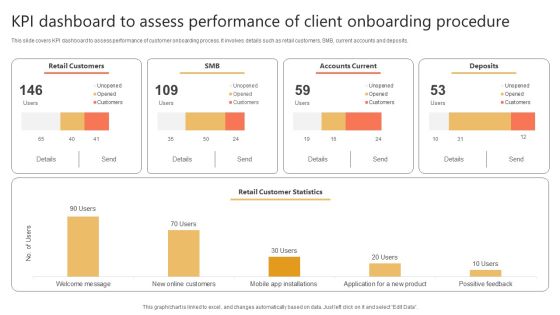
Kpi Dashboard To Assess Performance Of Client Onboarding Procedure Designs PDF
This slide covers KPI dashboard to assess performance of customer onboarding process. It involves details such as retail customers, SMB, current accounts and deposits. Showcasing this set of slides titled Kpi Dashboard To Assess Performance Of Client Onboarding Procedure Designs PDF. The topics addressed in these templates are Retail Customers, Accounts Current, Deposits. All the content presented in this PPT design is completely editable. Download it and make adjustments in color, background, font etc. as per your unique business setting.

Customer Relationship Management Salesperson Dashboard With Pipeline And Activity Level Designs PDF
This slide illustrates graphical representation of CRM sales team member data. It includes pipeline, business components and activity level, categories etc. Pitch your topic with ease and precision using this Customer Relationship Management Salesperson Dashboard With Pipeline And Activity Level Designs PDF. This layout presents information on Categories, Business Components, Team Member. It is also available for immediate download and adjustment. So, changes can be made in the color, design, graphics or any other component to create a unique layout.
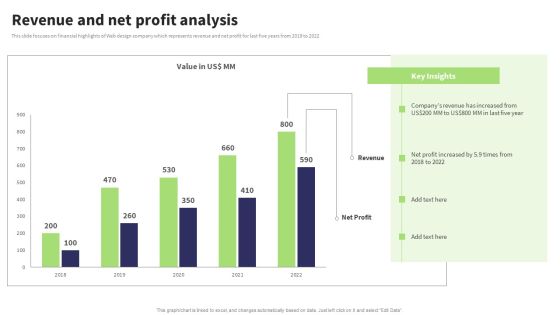
Website Design And Development Services Company Profile Revenue And Net Profit Analysis Formats PDF
This slide focuses on financial highlights of Web design company which represents revenue and net profit for last five years from 2018 to 2022. There are so many reasons you need a Website Design And Development Services Company Profile Revenue And Net Profit Analysis Formats PDF. The first reason is you can not spend time making everything from scratch, Thus, Slidegeeks has made presentation templates for you too. You can easily download these templates from our website easily.

Performance Assessment Of Channels Used For Direct Mail Advertising Designs PDF
This slide highlights performance assessment of direct mail marketing platform used to increase product visibility. It provides information regarding emails, brochure, postcards, free samples, discounts and envelop. Showcasing this set of slides titled Performance Assessment Of Channels Used For Direct Mail Advertising Designs PDF. The topics addressed in these templates are Consumers, Communicate Product, Increased Engagement. All the content presented in this PPT design is completely editable. Download it and make adjustments in color, background, font etc. as per your unique business setting.

Security And Surveillance Company Profile Security Company Business Model Designs PDF
This slide highlights the business model of home security company which includes target market, revenue stream, cost structure, future plans, products, customer segments, key activities and channels. Deliver an awe inspiring pitch with this creative Security And Surveillance Company Profile Security Company Business Model Designs PDF bundle. Topics like Target Market, Revenue Stream, Cost Structure can be discussed with this completely editable template. It is available for immediate download depending on the needs and requirements of the user.

Security Officer Service Company Profile Company Business Model Canvas Designs PDF
This slide highlights the business model of security guard company which includes target market, revenue stream, cost structure, future plans, products, customer segments, key activities and channels. Deliver an awe inspiring pitch with this creative Security Officer Service Company Profile Company Business Model Canvas Designs PDF bundle. Topics like Target Market, Customer Relationship, Customer Segments, Cost Structure can be discussed with this completely editable template. It is available for immediate download depending on the needs and requirements of the user.

Ansoff Matrix For Product And Market Expansion Cost And Income Optimization Formats PDF
This slide covers the Ans-off nine grid model which can used to understand market strategies for different products and services. This is a ansoff matrix for product and market expansion cost and income optimization formats pdf template with various stages. Focus and dispense information on one stages using this creative set, that comes with editable features. It contains large content boxes to add your information on topics like market development, partial diversification, market expansion, market penetration, product extension, product development, limited diversification. You can also showcase facts, figures, and other relevant content using this PPT layout. Grab it now.

Cost And Income Optimization Ansoff Matrix For Product And Market Expansion Demonstration PDF
This slide covers the Ans-off grid model which can used to understand market strategies for different products and services. This is a cost and income optimization ansoff matrix for product and market expansion demonstration pdf template with various stages. Focus and dispense information on four stages using this creative set, that comes with editable features. It contains large content boxes to add your information on topics like market penetration, product development, diversification, market development. You can also showcase facts, figures, and other relevant content using this PPT layout. Grab it now.
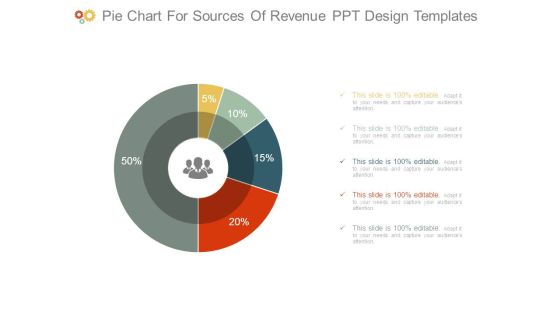
Pie Chart For Sources Of Revenue Ppt Design Templates
This is a pie chart for sources of revenue ppt design templates. This is a five stage process. The stages in this process are finance, success, business, marketing, percentage, donut.
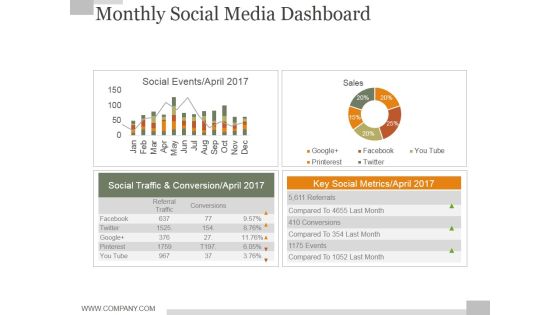
Monthly Social Media Dashboard Ppt PowerPoint Presentation Background Designs
This is a monthly social media dashboard ppt powerpoint presentation background designs. This is a four stage process. The stages in this process are business, finance, marketing, strategy, analysis, success.
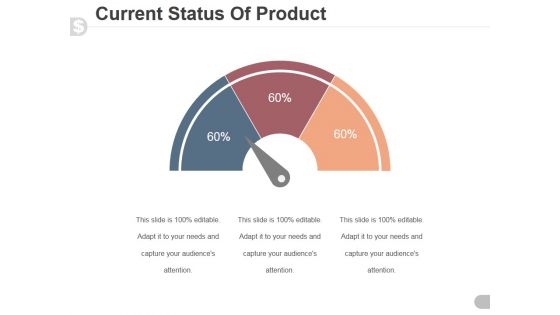
Current Status Of Product Ppt PowerPoint Presentation Designs Download
This is a current status of product ppt powerpoint presentation designs download. This is a three stage process. The stages in this process are speedometer, dashboard, business, marketing, finance.
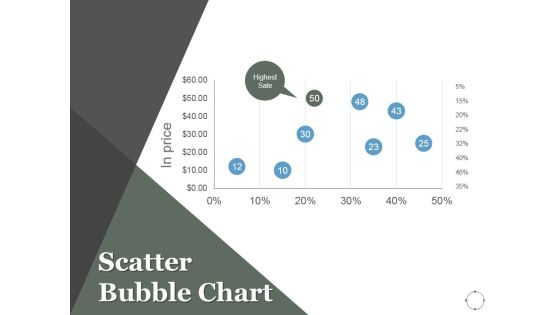
Scatter Bubble Chart Ppt PowerPoint Presentation Background Designs
This is a scatter bubble chart ppt powerpoint presentation background designs. This is a eight stage process. The stages in this process are projects, marketing, scatter chart, finance, management.

Activity Ratios Template 2 Ppt PowerPoint Presentation Design Templates
This is a activity ratios template 2 ppt powerpoint presentation design templates. This is a two stage process. The stages in this process are business, marketing, finance, growth, analysis.

Crm Dashboard Top Customers Ppt PowerPoint Presentation Styles Designs
This is a crm dashboard top customers ppt powerpoint presentation styles designs. This is a ten stage process. The stages in this process are business, customer, finance, bar graph, marketing, strategy, analysis.

Search Engine Rankings Ppt PowerPoint Presentation Pictures Designs Download
This is a search engine rankings ppt powerpoint presentation pictures designs download. This is a three stage process. The stages in this process are search engine rankings, finance, marketing, management, business.

Our Channel Sales Numbers Ppt PowerPoint Presentation Inspiration Graphics Design
This is a our channel sales numbers ppt powerpoint presentation inspiration graphics design. This is a four stage process. The stages in this process are business, finance, management, comparison, marketing.

Financial Highlights Template Ppt PowerPoint Presentation Professional Design Inspiration
This is a financial highlights template ppt powerpoint presentation professional design inspiration. This is a six stage process. The stages in this process are business, marketing, finance, analysis, planning.

Clustered Column Line Ppt PowerPoint Presentation Infographic Template Design Templates
This is a clustered column line ppt powerpoint presentation infographic template design templates. This is a four stage process. The stages in this process are business, marketing, column line, finance, product.

Dashboard Ppt PowerPoint Presentation Infographic Template Graphics Design
This is a dashboard ppt powerpoint presentation infographic template graphics design. This is a three stage process. The stages in this process are business, strategy, marketing, analysis, finance, dashboard.
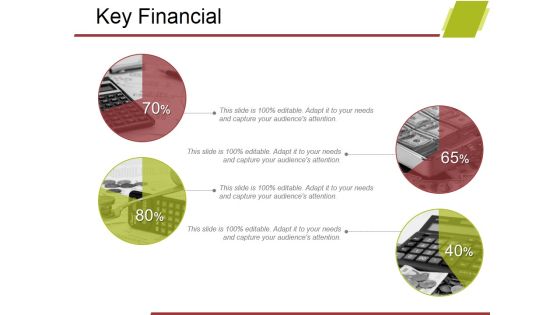
Key Financial Ppt PowerPoint Presentation Layouts Background Designs
This is a key financial ppt powerpoint presentation layouts background designs. This is a four stage process. The stages in this process are business, marketing, finance, key financial, management.

Inflation Rate Template 1 Ppt PowerPoint Presentation Professional Design Inspiration
This is a inflation rate template 1 ppt powerpoint presentation professional design inspiration. This is a twelve stage process. The stages in this process are business, finance, growth, marketing, strategy, analysis.
Real Estate Home Sales Ppt PowerPoint Presentation Icon Graphics Design
This is a real estate home sales ppt powerpoint presentation icon graphics design. This is a one stage process. The stages in this process are business, growth, finance, marketing, strategy.

Donut Pie Chart Ppt PowerPoint Presentation Infographics Background Designs
This is a donut pie chart ppt powerpoint presentation infographics background designs. This is a three stage process. The stages in this process are finance, business, marketing, strategy, percentage.
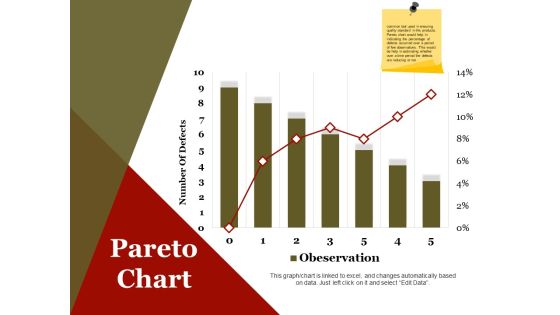
Pareto Chart Ppt PowerPoint Presentation Infographics Design Inspiration
This is a pareto chart ppt powerpoint presentation infographics design inspiration. This is a seven stage process. The stages in this process are number of defects, business, marketing, finance.
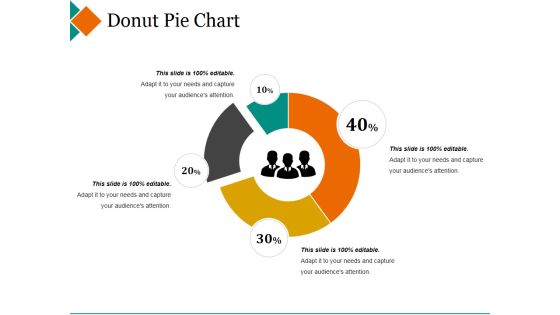
Donut Pie Chart Ppt PowerPoint Presentation Pictures Design Inspiration
This is a donut pie chart ppt powerpoint presentation pictures design inspiration. This is a four stage process. The stages in this process are maximum, donut, minimum, percentage, finance.
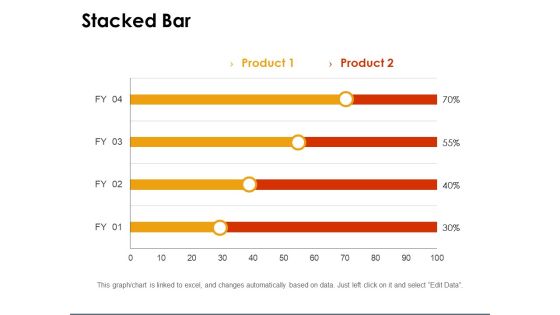
Stacked Bar Template 2 Ppt PowerPoint Presentation Infographics Graphics Design
This is a stacked bar template 2 ppt powerpoint presentation infographics graphics design. This is a two stage process. The stages in this process are percentage, business, marketing, finance.
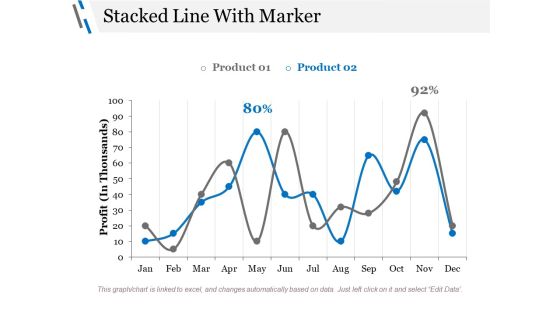
Stacked Line With Marker Ppt PowerPoint Presentation Styles Graphics Design
This is a stacked line with marker ppt powerpoint presentation styles graphics design. This is a three stage process. The stages in this process are profit, business, marketing, finance, percentage.
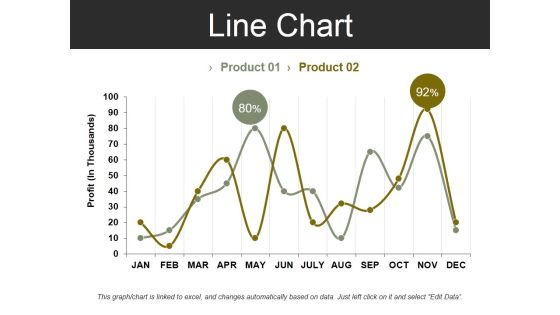
Line Chart Template 2 Ppt PowerPoint Presentation Summary Design Inspiration
This is a line chart template 2 ppt powerpoint presentation summary design inspiration. This is a two stage process. The stages in this process are profit, business, marketing, finance, chart.
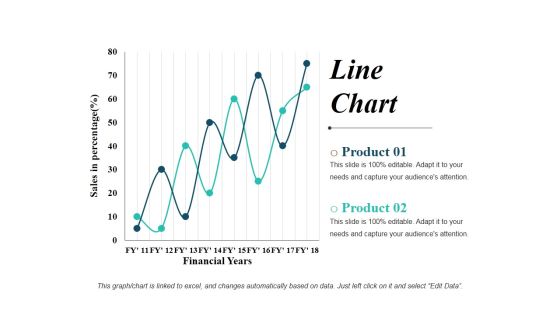
Line Chart Ppt PowerPoint Presentation Show Graphics Design
This is a line chart ppt powerpoint presentation show graphics design. This is a two stage process. The stages in this process are line graph, business, marketing, finance, planning.
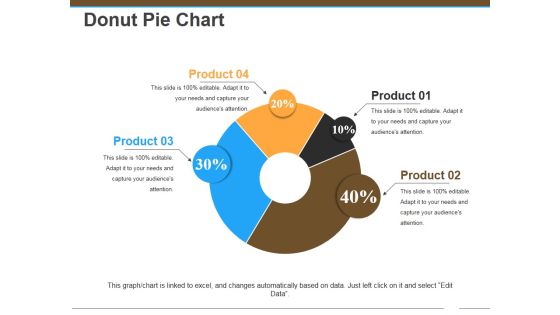
Donut Pie Chart Ppt Powerpoint Presentation Pictures Graphics Design
This is a donut pie chart ppt powerpoint presentation pictures graphics design. This is a four stage process. The stages in this process are donut pie chart, business, finance, management, analysis.
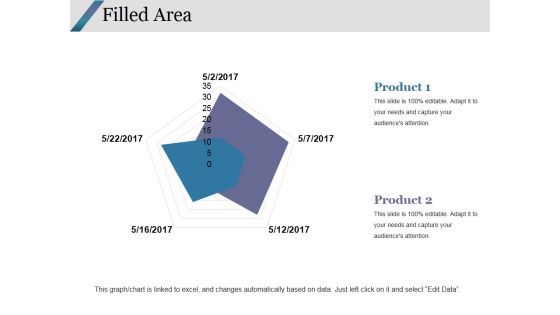
Filled Area Ppt PowerPoint Presentation Infographics Graphics Design
This is a filled area ppt powerpoint presentation infographics graphics design. This is a two stage process. The stages in this process are filled area, finance, marketing, strategy, analysis.
 Home
Home